

|
시장보고서
상품코드
2099753
HBM 8-Hi 대 12-Hi 스택 시장 : 시장 점유율 분석, 업계 동향 및 통계, 성장 예측(2026-2031년)HBM 8-Hi Vs 12-Hi Stack - Market Share Analysis, Industry Trends & Statistics, Growth Forecasts (2026 - 2031) |
||||||
 Mordor Intelligence
Mordor Intelligence에 의하면, HBM 8-Hi 대 12-Hi 스택 시장 규모는 2025년 28억 5,000만 달러로 평가되었고, 2026년에는 36억 2,000만 달러로 확대될 것으로 추정되고, 2031년까지 107억 달러에 이를 것으로 예상되며, 2026-2031년 CAGR 24.20%로 성장할 전망입니다.
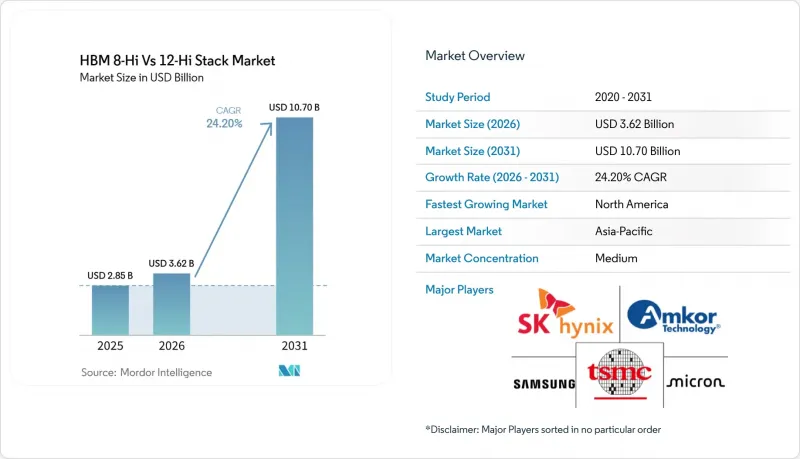
본 보고서는 용도별(서버, 네트워크, 고성능 컴퓨팅 등), 기술별(HBM2, HBM2E, HBM3 등), 스택당 메모리 용량별(최대 8 GB, 16GB, 24GB, 36GB 등), 프로세서 인터페이스별(GPU, CPU, AI 가속기 및 ASIC, FPGA 등), 지역별(북미, 아시아태평양 등)로 분류되어 있습니다. 시장 전망은 금액(달러) 기준으로 제시되어 있습니다.
세계의 HBM 8-Hi 대 12-Hi 스택 시장 동향 및 인사이트
AI 가속기의 대역폭 급속한 확대
주요 가속기의 각 세대에 따라 경쟁력 있는 AI 훈련 및 추론에 필요한 최소 메모리 대역폭이 높아지고 있으며, 이러한 변화로 인해 HBM 8-Hi 대 12-Hi 스택 시장은 더욱 신속한 업그레이드 주기로 전환되고 있습니다. NVIDIA의 Rubin 플랫폼은 HBM4의 총 대역폭을 기존 시스템에서 사용되던 수준을 크게 상회하는 수준으로 끌어올렸습니다. 이에 따라 메모리 공급업체들은 인증 기간을 연장하지 않고도 더 고성능의 스택을 제공해야 한다는 압박이 커지고 있습니다. 마이크론은 2025년 말, 자사의 HBM4 제품이 11 Gbps를 초과하는 속도로 작동하고 있으며, HBM3E보다 훨씬 빠른 속도로 양산 확대를 추진하고 있다고 발표했습니다. 이는 더 높은 핀 속도 목표가 더 이상 실험실의 이정표가 아니라, 이미 상업적인 요구 사항이 되었음을 보여줍니다. 이러한 변화가 중요한 이유는 HBM 8-Hi 대 12-Hi 스택 시장이 현재 우선 가속기의 로드맵에 반응하고 있으며, 공급업체의 계획이 해당 로드맵의 결정에 따르게 되었기 때문입니다. 또한, 고속 스택에는 더 엄격한 공정 관리, 신속한 인증, 그리고 GPU 및 ASIC 개발 주기와의 긴밀한 협력이 요구되므로 신규 진입 장벽도 높아집니다. 그 결과, 플랫폼 벤더들이 다양한 시스템 성과를 위해 최적화를 진행함에 따라, 고속 8-Hi 스택과 대용량 12-Hi 스택 모두에 대한 수요가 즉시 증가하고 있습니다.
주요 GPU 플랫폼의 HBM4 인증 수요
플래그십 GPU 프로그램에서의 인증은 HBM 8-Hi 대 12-Hi 스택 시장에서 가장 명확한 상업적 촉매제 중 하나가 되고 있습니다. JEDEC은 2025년 4월에 공식적인 HBM4 규격을 발표했으며, 이러한 움직임으로 인해 공급업체와 칩 설계자에게 2,048비트 인터페이스와 32개의 독립 채널에 대한 공통된 프레임워크가 제공되었습니다. SK하이닉스는 2025년 3월, 자사의 Advanced MR-MUF 공정을 활용해 최초의 12층 HBM4 샘플을 고객에게 출하하며, 다음 플랫폼 사이클에서 조기에 유리한 입지를 확보했습니다. 그 후, 삼성은 2026년 2월, 4nm 로직 베이스 다이를 기반으로 한 24GB-36GB 제품으로 HBM4의 상용 양산을 시작했으며, 여러 공급업체가 HBM4 도입의 첫 물결을 지원할 수 있음을 보여주었습니다. 또한 시노프시스(Synopsys)는 3nm 공정에서 최초의 HBM4 IP 테스트 칩 검증에 성공하며, 설계 생태계가 이미 새로운 규격에 맞추어 정비되고 있음을 보여주었습니다. 이러한 움직임들이 맞물리면서 구매자 입장에서의 단일 공급원 리스크가 완화되었고, HBM의 8-Hi 대 12-Hi 스택 시장 전반에서 공급업체 간의 경쟁이 격화되었습니다.
12층 이상 스택에서 TSV 수율 저하
HBM 8-Hi 대 12-Hi 스택 시장에서 TSV 수율은 여전히 가장 까다로운 제조 제약 사항 중 하나입니다. 이는 층이 추가될 때마다 정렬 및 신뢰성에 대한 부담이 증가하기 때문입니다. IEEE IRPS 2025에서 발표된 연구에 따르면, HBM3E에서 레이아웃이 정밀해질수록 TSV가 키프아웃 존에 근접하게 됨으로써 백엔드 신뢰성이 저하될 가능성이 있으며, 이러한 영향은 12-Hi 이상의 구성에서는 관리가 더욱 어려워진다는 사실이 밝혀졌습니다. 이러한 생산상의 과제는 실질적인 상업적 영향도 미칩니다. 더 높은 스택에서 안정적인 수율을 확보하려면 양산이 안정화될 때까지 수 분기 동안의 공정 학습 기간이 필요하기 때문입니다. 이러한 학습 주기로 인해 HBM의 8-Hi 및 12-Hi 스택 시장에서 수요를 출하량 증가로 연결하는 속도가 느려집니다. 또한 이는 이전 HBM 세대에서 이미 확고한 입지를 구축했던 자금력이 풍부한 공급업체조차도 인증 지연이 여전히 나타났던 이유를 설명하는 요인 중 하나입니다. 스택 목표와 동일한 속도로 수율이 향상될 때까지는 상위 계층 제품이 계속해서 수요를 상회하는 공급 부족에 직면할 것입니다.
부문 분석
2025년 HBM 8-Hi 대 12-Hi 스택 시장 점유율 중 서버가 83.38%를 차지했으며, 이는 현재 수요가 AI 가속기 인프라와 얼마나 밀접하게 연결되어 있는지를 보여줍니다. 고층 HBM은 여전히 극한의 메모리 대역폭과 용량이 높은 시스템 비용을 정당화할 수 있는 분야에서 주로 사용되고 있기 때문에 HBM 8-Hi 대 12-Hi 스택 시장은 서버를 중심으로 형성되었습니다. 또한, 서버의 교체 주기에 따라 출하되는 시스템 수뿐만 아니라 랙당 HBM 탑재량도 증가하고 있어, 이에 따라 수익 구조는 고밀도 도입 형태로 전환되고 있습니다. NVIDIA의 ‘Vera Rubin NVL72’는 랙당 20.7테라바이트의 HBM4를 탑재하고 있으며, 이전 ‘Grace Blackwell’ 시스템의 8테라바이트와 비교했을 때 랙 수준의 메모리 탑재량은 2.6배 증가했습니다. 삼성은 2026년 HBM 매출이 2025년 대비 3배 이상 증가할 것으로 전망하고 있으며, 이는 서버 플랫폼당 HBM 탑재량 증가와 일치합니다.
기타 용도 분야의 비중은 여전히 훨씬 작았으나, 상업적 중요도 측면에서는 네트워크와 HPC가 서버 분야에 가장 근접한 위치를 차지했습니다. 네트워킹 분야 수요도 기본적으로 유사한 이유로 증가했습니다. 즉, AI 클러스터에는 연결된 가속기와 비슷한 속도로 데이터를 전송할 수 있는 스위칭용 반도체가 필요하기 때문입니다. 브로드컴 관련 맞춤형 ASIC 프로그램은 HBM 8-Hi 대 12-Hi 스택 시장에서 서버 카테고리가 여전히 지배적이었음에도 불구하고, 범용 네트워킹 및 AI 인프라용 반도체에서 HBM의 역할을 확대함으로써 이러한 추세를 뒷받침했습니다. HPC는 여전히 중요했으나, 정부 및 연구 기관에서의 도입은 자금 조달 및 설치 주기가 길기 때문에 그 진전은 완만했습니다. 소비자 가전 및 자동차 및 운송 분야에서는 비용과 전력 소비 제약이 엄격한 제품에서 HBM의 높은 가격을 정당화하기가 여전히 어려웠기 때문에 도입은 초기 단계에 머물렀습니다.
HBM4는 2031년까지의 HBM 8-Hi 대 12-Hi 스택 시장 규모에서 연평균 성장률(CAGR) 25.08%로 확대될 것으로 예측되며, 예측 기간 동안 가장 빠르게 성장하는 기술 세대가 될 전망입니다. JEDEC이 2025년 4월에 발표한 HBM4 사양에서는 인터페이스 폭이 2,048비트로 두 배로 늘어나고, 32개의 독립 채널이 표준화되었습니다. 이를 통해 차세대 제품의 대역폭 상한선이 대폭 상향 조정되었습니다. 삼성은 자사의 상용 HBM4가 스택당 최대 3.3 TB/s에 도달했다고 발표했으며, 이는 새로운 GPU 및 ASIC 프로그램이 이 세대에 초점을 맞추고 있는 이유를 뒷받침합니다. 2025년에도 HBM 8-Hi 대 12-Hi 스택 시장은 여전히 HBM3E에 크게 의존하고 있었습니다. 이는 HBM4가 인증 단계나 초기 양산 단계에 진입했음에도 불구하고, Blackwell 및 MI350의 생산 주기로 인해 HBM3E 수요가 유지되었기 때문입니다. 이러한 중복 현상은 기술 전환이 단번에 이루어지는 것이 아니라, 여러 플랫폼 주기에 걸쳐 진행된다는 것을 의미합니다.
HBM2, HBM2E, HBM3 등의 구세대 제품은 아직 업데이트 주기를 완료하지 않은 레거시 HPC 및 그래픽스 환경에서 계속해서 사용되고 있었습니다. 이러한 계층은 시간이 지남에 따라 시장 점유율을 잃을 가능성이 높지만, 예측 기간의 초기 단계에서는 여전히 일정한 수익 기반을 제공합니다. 더 중요한 전환은 HBM4와 HBM4E 사이에서 일어나며, 각 공급업체들은 세대의 완전한 리셋을 기다리지 않고 이미 대역폭과 용량 확장을 모색하고 있습니다. 삼성은 2026년 5월에 48GB 12층 HBM4E 샘플을 출하했고, SK하이닉스는 2026년 6월에 12층 HBM4E 샘플을 출하했습니다. 이는 HBM의 8-Hi 대 12-Hi 스택 업계에서 기술 파이프라인이 이미 1차 물결인 HBM4를 넘어서는 중임을 보여줍니다. 또한 시노프시스(Synopsys)는 3nm 공정에서 HBM4 IP 검증에 성공했으며, 이를 통해 맞춤형 실리콘(custom silicon)으로의 신속한 도입에 필요한 보다 광범위한 설계 생태계가 지원될 것입니다.
지역별 분석
2025년, 아시아태평양은 HBM 8-Hi 대 12-Hi 스택 시장의 74.62% 점유율을 차지한 것으로 평가되었으며, 이는 한국과 대만에 메모리 제조 및 첨단 패키징이 집중되어 있음을 반영합니다. HBM 8-Hi 대 12-Hi 스택 시장은 SK하이닉스와 삼성이 한국에서 주요 HBM DRAM 생산을 담당하는 한편, 대만은 TSMC 및 관련 공급업체를 통해 CoWoS 패키징 역량의 대부분을 차지하고 있어 계속해서 아시아태평양을 중심으로 전개되고 있습니다. SK하이닉스가 용인 반도체 클러스터에 대한 투자를 가속화하고, AI 관련 수요에 대응해 생산 능력 확대를 지속하고 있기 때문에 한국은 현재 공급 확대의 중심에 위치하고 있습니다. 대만도 마찬가지로 중요한 위치를 차지하고 있습니다. CoWoS의 양산 속도는 패키지화된 가속기 모듈로서 HBM이 최종 시장에 얼마나 많은 양으로 공급되는지에 직접적인 영향을 미치기 때문입니다. 인도는 반도체 제조 분야에서 여전히 초기 단계에 있으며, 현재 진행 중인 프로그램은 아직 HBM급 생산과 연계되지 않았습니다.
북미는 하이퍼스케일러들의 설비 투자가 더욱 고도화된 메모리를 국내 AI 인프라로 지속적으로 유입시켰기 때문에 예측 기간 동안 가장 빠르게 성장한 지역이 되었습니다. 또한, 미국의 ‘CHIPS and Science Act’는 첨단 메모리 및 패키징 역량의 국내화를 촉진하여, HBM의 8-Hi 대 12-Hi 스택 시장에서 이 지역의 역할을 뒷받침했습니다. 마이크론은 아이다호주 및 뉴욕주의 최첨단 팹에 대한 투자로 수십 년에 걸쳐 500억 달러 규모의 국내 투자 계획을 제시했으며, 이 중 60억 달러 이상이 연방 정부의 지원으로 예상됩니다. 또한 SK하이닉스도 인디애나주에 38억 7,000만 달러를 투자해 첨단 패키징 시설을 건설하겠다고 발표했으며, 이는 패키징의 현지화가 정책 목표에서 확고한 투자로 전환되기 시작했음을 보여줍니다. 구매 측이 지정학적 집중 리스크를 낮출 수 있는 공급 옵션을 점점 더 선호하고 있기 때문에 이러한 움직임은 중요합니다.
유럽의 HBM 수요는 주로 HPC 프로그램이나 자동차용 AI 개발과 연동되어 왔으나, 해당 지역에는 여전히 주요 HBM 생산 능력이 부족했습니다. 그 결과, 유럽은 아시아태평양공급업체에 의존할 수밖에 없었으며, 공급이 핍박했을 때는 현지 프로젝트가 할당 우선순위에서 뒤로 밀리는 사태가 발생했습니다. 남미, 중동 및 아프리카는 여전히 소규모 수요 거점에 머물러 있었으며, 그 성장은 주로 정부 주도의 AI 인프라 및 데이터센터 계획에 의존하고 있었습니다. 이 지역들의 발전 방향은 현지 반도체 생산보다는 인프라 투자나 외부 공급업체에 대한 접근성에 크게 좌우되었습니다. 그 결과, HBM의 8-Hi 스택 및 12-Hi 스택 시장에서는 메모리 생산지와 향후 AI 연산 수요가 가속화되고 있는 지역 간에 여전히 뚜렷한 불균형이 나타났습니다.
기타 혜택 :
- 엑셀 형식 시장 예측(ME) 시트
- 3개월간의 애널리스트 지원
자주 묻는 질문
목차
제1장 서론
제2장 조사 방법
제3장 주요 요약
제4장 시장 구도
제5장 시장 규모 및 성장 예측
제6장 경쟁 구도
제7장 시장 기회 및 향후 전망
AJY 26.08.07According to Mordor Intelligence, the HBM 8-Hi vs 12-Hi stack market size is expected to increase from USD 2.85 billion in 2025 to USD 3.62 billion in 2026 and reach USD 10.70 billion by 2031, growing at a CAGR of 24.20% over 2026-2031.
This report is Segmented by Application (Servers, Networking, High-Performance Computing, and More), Technology (HBM2, HBM2E, HBM3, and More), Memory Capacity Per Stack (Up To 8 GB, 16 GB, 24 GB, 36 GB, and More), Processor Interface (GPU, CPU, AI Accelerator and ASIC, FPGA, and More), and Geography (North America, Asia-Pacific, and More). The Market Forecasts are Provided in Terms of Value (USD).
Global HBM 8-Hi Vs 12-Hi Stack Market Trends and Insights
Rapid AI Accelerator Bandwidth Scaling
Every major accelerator generation has raised the minimum memory bandwidth needed for competitive AI training and inference, and that shift has pushed the HBM 8-Hi vs 12-Hi stack market into a faster upgrade cycle. NVIDIA's Rubin platform raised aggregate HBM4 bandwidth well above the level used in earlier systems, which increased the pressure on memory suppliers to deliver higher-performing stacks without extending qualification windows. Micron stated in late 2025 that its HBM4 products were operating above 11 Gbps and ramping at a pace that was materially faster than HBM3E, which showed that higher pin-speed targets had already become a commercial requirement rather than a lab milestone. That shift matters because the HBM 8-Hi vs 12-Hi stack market now responds to accelerator roadmaps first, and supplier planning follows those roadmap decisions. It also raises the barrier for new entrants because faster stacks require stronger process control, faster qualification, and tighter integration with the GPU and ASIC development cycle. The immediate result is stronger demand for both high-speed 8-Hi stacks and higher-capacity 12-Hi stacks as platform vendors optimize for different system outcomes.
HBM4 Qualification Pull from Leading GPU Platforms
Qualification on flagship GPU programs has become one of the clearest commercial triggers in the HBM 8-Hi vs 12-Hi stack market. JEDEC released the formal HBM4 standard in April 2025, and that step gave suppliers and chip designers a common framework around a 2,048-bit interface and 32 independent channels. SK hynix shipped the first 12-layer HBM4 samples to customers in March 2025 using its Advanced MR-MUF process, which positioned it early in the next platform cycle. Samsung then moved into commercial HBM4 mass production in February 2026 with 24 GB to 36 GB products built on a 4 nm logic base die, showing that more than one supplier could support the first wave of HBM4 deployment. Synopsys also validated the first HBM4 IP test chip on a 3 nm process, which showed that the design ecosystem was already aligning around the new standard. Together, these steps reduced single-source risk for buyers and made supplier competition more intense across the HBM 8-Hi vs 12-Hi stack market.
TSV Yield Losses Above 12-Layer Stacks
TSV yield remains one of the hardest production limits in the HBM 8-Hi vs 12-Hi stack market because each added layer increases alignment and reliability pressure. Work presented at IEEE IRPS 2025 found that TSV keep-out zone proximity in HBM3E can degrade back-end reliability as layouts tighten, and that effect becomes more difficult to manage in 12-Hi and higher configurations. The same production issue has practical commercial effects because stable yield in taller stacks requires several quarters of process learning before volume output becomes dependable. That learning cycle slows the pace at which the HBM 8-Hi vs 12-Hi stack market can translate demand into shipment growth. It also helps explain why qualification delays remained visible even for well-funded suppliers that had already established strong positions in earlier HBM generations. Until yield improves at the same pace as stack ambition, upper-layer products will continue to face tighter supply than demand.
Other drivers and restraints analyzed in the detailed report include:
- Long-Term Supply Agreements Favoring 12-Hi Qualification
- Hybrid Bonding and Thermal Design Improvements Enabling Higher Stacks
- Limited CoWoS and SoIC Advanced-Packaging Capacity
For complete list of drivers and restraints, kindly check the Table Of Contents.
Segment Analysis
Servers accounted for 83.38% of the HBM 8-Hi vs 12-Hi stack market share in 2025, which shows how strongly current demand is tied to AI accelerator infrastructure. The HBM 8-Hi vs 12-Hi stack market stayed centered on servers because high-layer HBM is still used mainly where extreme memory bandwidth and capacity justify a premium system bill. The server refresh cycle is also increasing HBM content per rack, not only the number of systems shipped, and that changes the revenue mix in favor of denser deployments. NVIDIA's Vera Rubin NVL72 carries 20.7 terabytes of HBM4 per rack versus 8 terabytes in the earlier Grace Blackwell system, which lifts memory content by 2.6x at the rack level. Samsung expected its HBM sales to more than triple in 2026 from 2025, which was consistent with the rise in HBM content per server platform.
The rest of the application mix remained much smaller, although networking and HPC stood closest to the server segment in commercial relevance. Networking demand rose for the same basic reason, which is that AI clusters need switching silicon that can move data at speeds closer to the accelerators they connect. Broadcom-related custom ASIC programs supported that direction by increasing the role of HBM in merchant networking and AI infrastructure silicon, even though the server category remained dominant in the HBM 8-Hi vs 12-Hi stack market. HPC remained important but moved more slowly because government and research deployments follow longer funding and installation cycles. Consumer electronics and automotive and transportation stayed early in adoption because the cost premium of HBM remained difficult to justify in products with tighter cost and power limits.
HBM4 is projected to expand at a 25.08% CAGR in the HBM 8-Hi vs 12-Hi stack market size through 2031, making it the fastest-growing technology generation in the forecast period. JEDEC's April 2025 HBM4 release doubled the interface width to 2,048 bits and standardized 32 independent channels, which materially increased the bandwidth ceiling for next-generation products. Samsung stated that its commercial HBM4 reached up to 3.3 TB/s per stack, which underscored why new GPU and ASIC programs were aligning around this generation. The HBM 8-Hi vs 12-Hi stack market still relied heavily on HBM3E in 2025 because Blackwell and MI350 production cycles kept that generation relevant even as HBM4 moved into qualification and early ramp. This overlap means the technology shift is not a one-step replacement and will play out over several platform cycles.
Older generations such as HBM2, HBM2E, and HBM3 continued to serve legacy HPC and graphics deployments that had not yet completed refresh cycles. Those tiers are likely to lose share over time, but they still provide a base level of revenue in the early years of the forecast. The more important transition is between HBM4 and HBM4E, where suppliers are already trying to extend bandwidth and capacity without waiting for a full generational reset. Samsung shipped 48 GB 12-layer HBM4E samples in May 2026, and SK hynix shipped 12-layer HBM4E samples in June 2026, which showed that the technology pipeline within the HBM 8-Hi vs 12-Hi stack industry was already moving past first-wave HBM4. Synopsys also validated HBM4 IP on a 3 nm process, which supports the broader design ecosystem needed for faster adoption in custom silicon.
Complete Report Scope:
- By Application
- Servers
- Networking
- High-Performance Computing
- Consumer Electronics
- Automotive and Transportation
- By Technology
- HBM2
- HBM2E
- HBM3
- HBM3E
- HBM4
- By Memory Capacity Per Stack
- Up to 8 GB
- 16 GB
- 24 GB
- 36 GB
- Above 36 GB
- By Processor Interface
- GPU
- CPU
- AI Accelerator and ASIC
- FPGA
- Other Processor Interfaces
- By Geography
- North America
- United States
- Canada
- Mexico
- Europe
- Germany
- United Kingdom
- France
- Italy
- Rest of Europe
- Asia-Pacific
- China
- Japan
- South Korea
- Taiwan
- India
- Rest of Asia-Pacific
- South America
- Middle East and Africa
- North America
Geography Analysis
Asia-Pacific held 74.62% of the HBM 8-Hi vs 12-Hi stack market share in 2025, which reflects the concentration of memory fabrication and advanced packaging across South Korea and Taiwan. The HBM 8-Hi vs 12-Hi stack market remains centered in Asia-Pacific because SK hynix and Samsung run primary HBM DRAM production in South Korea, while Taiwan holds a large share of CoWoS packaging capacity through TSMC and related suppliers. South Korea sits at the center of current supply growth because SK hynix accelerated investment in the Yongin semiconductor cluster and continued to expand capacity in response to AI-related demand. Taiwan is equally critical because the pace of CoWoS ramp directly affects how much HBM can reach the end market as packaged accelerator modules. India remained at an early stage in semiconductor manufacturing, and its current programs did not yet intersect with HBM-class production.
North America was the fastest-growing geography in the forecast period because hyperscaler capital spending continued to pull more advanced memory into domestic AI infrastructure. The U.S. CHIPS and Science Act also encouraged localization of advanced memory and packaging capacity, which supported the region's role in the HBM 8-Hi vs 12-Hi stack market. Micron outlined a multi-decade USD 50 billion domestic investment commitment with more than USD 6 billion in expected federal support for leading-edge fabs in Idaho and New York. SK hynix also announced a USD 3.87 billion advanced packaging facility in Indiana, which showed that packaging localization had started to move from policy goal to committed investment. These moves matter because buyers increasingly prefer supply options that reduce geopolitical concentration risk.
Europe's HBM demand remained linked mainly to HPC programs and automotive AI development, but the region still lacked primary HBM manufacturing capacity. That left Europe dependent on Asia-Pacific suppliers and pushed local projects toward the back of allocation queues when supply tightened. South America and the Middle East and Africa remained smaller demand centers, with growth tied mainly to sovereign AI infrastructure and data center programs. Their direction depended more on infrastructure spending and external supplier access than on local semiconductor production. As a result, the HBM 8-Hi vs 12-Hi stack market still showed a clear imbalance between where memory is made and where future AI compute demand is accelerating.
- SK hynix Inc.
- Samsung Electronics Co., Ltd.
- Micron Technology, Inc.
- Taiwan Semiconductor Manufacturing Company Limited
- ASE Technology Holding Co., Ltd.
- Amkor Technology, Inc.
- Powertech Technology Inc.
- United Microelectronics Corporation
- GlobalFoundries Inc.
- Applied Materials, Inc.
- Marvell Technology, Inc.
- Rambus Inc.
- Cadence Design Systems, Inc.
- Synopsys, Inc.
- Siliconware Precision Industries Co., Ltd.
- JCET Group Co., Ltd.
- Chipbond Technology Corporation
- Broadcom Inc.
- Intel Corporation
- NVIDIA Corporation
Additional Benefits:
- The market estimate (ME) sheet in Excel format
- 3 months of analyst support
TABLE OF CONTENTS
1 INTRODUCTION
- 1.1 Study Assumptions and Market Definition
- 1.2 Scope of the Study
2 RESEARCH METHODOLOGY
3 EXECUTIVE SUMMARY
4 MARKET LANDSCAPE
- 4.1 Market Overview
- 4.2 Market Drivers
- 4.2.1 Rapid AI Accelerator Bandwidth Scaling
- 4.2.2 HBM4 Qualification Pull From Leading GPU Platforms
- 4.2.3 Long-Term Supply Agreements Favoring 12-Hi Qualification
- 4.2.4 Hybrid Bonding and Thermal Design Improvements Enabling Higher Stacks
- 4.2.5 Packaging Capacity Expansion at TSMC and OSAT Partners
- 4.2.6 Inference Server Density Upgrades Increasing HBM Content Per System
- 4.3 Market Restraints
- 4.3.1 TSV Yield Losses Above 12-Layer Stacks
- 4.3.2 Limited CoWoS and SoIC Advanced-Packaging Capacity
- 4.3.3 Thermal Throttling In High-Bandwidth Devices
- 4.3.4 Qualification Concentration Risk Tied To A Small Number Of Buyers
- 4.4 Supply Chain Analysis
- 4.5 Regulatory Landscape
- 4.6 Technological Outlook
- 4.7 Porter's Five Forces Analysis
- 4.7.1 Threat Of New Entrants
- 4.7.2 Bargaining Power Of Suppliers
- 4.7.3 Bargaining Power Of Buyers
- 4.7.4 Threat Of Substitutes
- 4.7.5 Intensity Of Competitive Rivalry
5 MARKET SIZE AND GROWTH FORECASTS (VALUE)
- 5.1 By Application
- 5.1.1 Servers
- 5.1.2 Networking
- 5.1.3 High-Performance Computing
- 5.1.4 Consumer Electronics
- 5.1.5 Automotive and Transportation
- 5.2 By Technology
- 5.2.1 HBM2
- 5.2.2 HBM2E
- 5.2.3 HBM3
- 5.2.4 HBM3E
- 5.2.5 HBM4
- 5.3 By Memory Capacity Per Stack
- 5.3.1 Up to 8 GB
- 5.3.2 16 GB
- 5.3.3 24 GB
- 5.3.4 36 GB
- 5.3.5 Above 36 GB
- 5.4 By Processor Interface
- 5.4.1 GPU
- 5.4.2 CPU
- 5.4.3 AI Accelerator and ASIC
- 5.4.4 FPGA
- 5.4.5 Other Processor Interfaces
- 5.5 By Geography
- 5.5.1 North America
- 5.5.1.1 United States
- 5.5.1.2 Canada
- 5.5.1.3 Mexico
- 5.5.2 Europe
- 5.5.2.1 Germany
- 5.5.2.2 United Kingdom
- 5.5.2.3 France
- 5.5.2.4 Italy
- 5.5.2.5 Rest of Europe
- 5.5.3 Asia-Pacific
- 5.5.3.1 China
- 5.5.3.2 Japan
- 5.5.3.3 South Korea
- 5.5.3.4 Taiwan
- 5.5.3.5 India
- 5.5.3.6 Rest of Asia-Pacific
- 5.5.4 South America
- 5.5.5 Middle East and Africa
- 5.5.1 North America
6 COMPETITIVE LANDSCAPE
- 6.1 Market Concentration
- 6.2 Strategic Moves
- 6.3 Market Share Analysis
- 6.4 Company Profiles (includes Global Level Overview, Market Level Overview, Core Segments, Financials as available, Strategic Information, Market Rank/Share, Products and Services, Recent Developments)
- 6.4.1 SK hynix Inc.
- 6.4.2 Samsung Electronics Co., Ltd.
- 6.4.3 Micron Technology, Inc.
- 6.4.4 Taiwan Semiconductor Manufacturing Company Limited
- 6.4.5 ASE Technology Holding Co., Ltd.
- 6.4.6 Amkor Technology, Inc.
- 6.4.7 Powertech Technology Inc.
- 6.4.8 United Microelectronics Corporation
- 6.4.9 GlobalFoundries Inc.
- 6.4.10 Applied Materials, Inc.
- 6.4.11 Marvell Technology, Inc.
- 6.4.12 Rambus Inc.
- 6.4.13 Cadence Design Systems, Inc.
- 6.4.14 Synopsys, Inc.
- 6.4.15 Siliconware Precision Industries Co., Ltd.
- 6.4.16 JCET Group Co., Ltd.
- 6.4.17 Chipbond Technology Corporation
- 6.4.18 Broadcom Inc.
- 6.4.19 Intel Corporation
- 6.4.20 NVIDIA Corporation
7 MARKET OPPORTUNITIES AND FUTURE OUTLOOK
- 7.1 White-Space and Unmet-Need Assessment


