

|
시장보고서
상품코드
2099890
농구 스트리밍 시장 : 시장 점유율 분석, 업계 동향 및 통계, 성장 예측(2026-2031년)Basketball Streaming - Market Share Analysis, Industry Trends & Statistics, Growth Forecasts (2026 - 2031) |
||||||
 Mordor Intelligence
Mordor Intelligence에 의하면, 농구 스트리밍 시장 규모는 2025년에 43억 5,000만 달러로 평가되었고, 2026-2031년 CAGR 13.64%로 확대될 것으로 전망되며, 2031년에는 95억 7,000만 달러에 이를 것으로 예측됩니다.
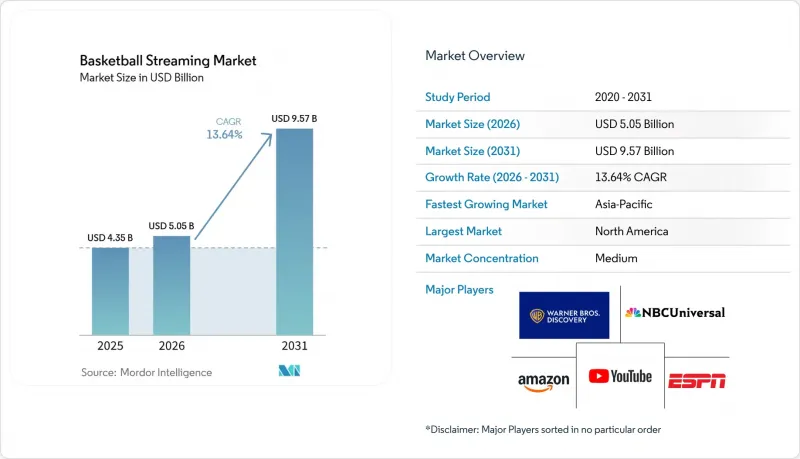
본 보고서는 기기 유형별(스마트폰·태블릿, 스마트 TV, 노트북·데스크톱 PC), 컨텐츠 유형별(국제 경기, 국내 경기), 스트리밍 유형별(라이브 스트리밍, 온디맨드 스트리밍) 및 지역별(북미, 남미, 유럽, 아시아태평양, 중동 및 아프리카)로 분류되어 있습니다. 시장 전망은 금액(달러) 기준으로 제시되어 있습니다.
세계의 농구 스트리밍 시장 동향 및 인사이트
D2C(Direct-to-Consumer)형 리그 패스 생태계의 확대
2024년 7월에 체결된 NBA의 미디어 계약에 따라, Prime Video 및 Peacock이 ABC나 ESPN과 어깨를 나란히 하게 되었으며, 이를 통해 프리미엄 농구는 스트리밍이 전국적인 접근의 ‘부수적인 요소’가 아닌 ‘중심’이 되는 지속 가능한 하이브리드 시스템으로 전환되었습니다. 이번 시즌 정규 시즌이 끝날 때까지 미국 내 총 시청자 수는 상당한 수준에 달할 것으로 예상되는 한편, 전 세계 생중계 규모도 대폭 확대될 것으로 전망됩니다. 이러한 동향은 디지털 스트리밍을 통해 프리미엄 중계권의 가치를 훼손하지 않으면서도 시청자 규모를 확대할 수 있음을 보여줍니다. NBA 앱의 사용자 1인당 시청 시간도 대폭 증가할 것으로 예상되며, 이는 리그가 독자적으로 운영하는 플랫폼이 방송 파트너의 보조적 역할에 그치지 않고, 시청자의 참여도와 충성도를 높이는 중요한 채널로 자리 잡고 있음을 보여줍니다. 이 모델을 통해 권리 보유자는 가격 책정, 패키지 구성, 그리고 자사의 시청자 행동에 대해 보다 직접적인 통제권을 행사할 수 있게 됩니다. 이는 가입자의 의사결정을 구매나 갱신 시점에 더 가까운 단계에서 추적할 수 있게 되었기 때문에 중요한 의미를 지닙니다. 농구 스트리밍 시장에서 이를 통해 배포 관리, 고객 데이터, 컨텐츠 가치가 시간이 지남에 따라 서로를 강화해 주는 보다 지속 가능한 수익 사이클이 형성됩니다.
커넥티드 스크린에서 라이브 스포츠 광고 슬롯의 프리미엄 가격 상승
농구 생중계는 여전히 대규모의 ‘예약 시청’을 창출하고 있으며, 커넥티드 스크린에서 프리미엄 광고를 안정적으로 뒷받침할 수 있는 몇 안 되는 스트리밍 컨텐츠 중 하나입니다. 일반적인 라이브 스포츠 CTV 광고 슬롯은 일반적으로 높은 CPM(노출당 비용)을 자랑하지만, 인터랙티브형이나 이벤트 연동형 광고 유닛은 그 수준을 상회하기도 하여, 프리미엄 경기 광고 슬롯을 보유한 플랫폼의 수익 상한선을 끌어올리고 있습니다. 프리미온(Premion)사의 보고서에 따르면, 이미 라이브 스포츠 CTV에서 광고를 전개하고 있는 광고주 중 다수가 향후 12개월 동안 지출을 늘릴 계획인 반면, 지금까지 광고를 구매하지 않았던 많은 광고주들도 이 분야에 진출할 전망입니다. 농구는 주로 소수의 주요 이벤트에 의존하는 다른 스포츠와 달리, 정규 시즌 동안 많은 밤에 걸쳐 플랫폼에 대량의 프리미엄 광고 슬롯을 제공하기 때문에 특히 유리한 입장에 있습니다. 농구 스트리밍 시장에서 이러한 광고의 깊이는 중요합니다. 구독 수익과 프리미엄 광고가 모두 중계권 수익 창출에 기여하는 ‘두 개의 엔진’ 모델을 뒷받침하고 있기 때문입니다.
리그, 팀, 지역에 걸친 권리 소유의 분산
농구 컨텐츠는 국내 리그 패키지, 지역 팀 패키지, 그리고 지역별 국제 계약으로 나뉘어 있기 때문에 권리의 분산은 여전히 규모 확대에 있어 가장 명백한 구조적 제약 중 하나입니다. FIBA의 스트리밍 체계는 이를 여실히 보여주며, 전 세계적으로 통일된 디지털 접근 모델이 아닌 독일이나 중국 등 시장별로 개별적인 합의가 이루어지고 있습니다. NBA에서 진행 중인 지역별 중계권 전환은 이 문제에 더욱 복잡성을 더하고 있습니다. 팬들은 팀의 소재지, 국내 패키지, 대회 유형에 따라 여전히 서로 다른 서비스를 이용해야 할 가능성이 있기 때문입니다. 시청자가 경기가 어디에서 중계되는지 예측할 수 없다면, 컨텐츠를 찾는 데 드는 부담이 커지고 개별 구독의 가치는 떨어집니다. 농구 스트리밍 시장의 경우, 이는 팬들의 잠재적 수요 상당 부분이 여전히 안정적이고 지속적인 수익으로 원활하게 전환되지 않고 있음을 의미합니다.
부문 분석
2025년, 스마트폰 및 태블릿은 농구 스트리밍 시장 점유율의 55.23%를 차지했으며, 이로 인해 모바일은 지역을 불문하고 생중계 시청 및 단편 농구 컨텐츠 소비 모두에서 주요 접속 수단이 되었습니다. 이러한 우위는 단순한 편의성 때문만은 아닙니다. 리그 앱, 지역별 서비스, 국제적인 농구 컨텐츠는 사용자가 처음 접하는 순간부터 신속한 로그인, 짧은 형식의 컨텐츠 발견, 그리고 이동 중 시청 행동을 염두에 두고 설계되고 있기 때문입니다. 디즈니 애드버타이징은 2025년, 젊은 스포츠 시청자들이 이미 시청 시간의 대부분을 TV 이외의 기기에서 보내고 있다고 보고했으며, 이는 농구가 모바일 환경과 이토록 잘 어울리는 이유를 설명해 줍니다. WSC 스포츠 역시 Z세대와 밀레니얼 세대 팬들 사이에서 스트리밍에 대한 강한 선호도가 나타나고 있음을 밝혔으며, 이는 농구 스트리밍 업계의 팬층과 모바일 네이티브 행동 간의 연관성을 뒷받침합니다.
또한, 팬들은 한 번에 장시간 연속 시청에 집중하기보다는 경기 중에 여러 번 접속하는 경향이 있어, 모바일 주도적인 추세는 농구 시청의 리듬과도 잘 부합합니다. NBA 2026년 정규 시즌 결과에 따르면, ‘Tap to Watch’를 통한 생중계 스트리밍 재생 횟수는 2,000만 회에 육박했으며, 이는 신속하고 장벽이 적은 모바일 접근이 현재 참여도 확대의 핵심이 되고 있다는 관점을 뒷받침합니다. 스마트 TV는 2031년까지 연평균 성장률(CAGR) 13.86%를 나타낼 것으로 예측되며, 이는 각 가정이 커넥티드 홈 엔터테인먼트 환경 내에서 프리미엄 스포츠를 시청하기를 기대함에 따라 거실에서의 스트리밍이 점점 더 중요해지고 있음을 보여줍니다. 이러한 변화는 수익 창출을 촉진합니다. 커넥티드 TV를 통한 프리미엄 라이브 스포츠 중계권은 오픈 웹 동영상보다 훨씬 높은 가격에 거래되며, 스크린 타임이 상위 기기로 이동함에 따라 권리 보유자에게 더 유리한 수익 구조를 가져다주기 때문입니다. 노트북, 데스크톱 PC, 게임기, 그리고 새롭게 등장하는 인터랙티브 기기는 수익 면에서는 여전히 규모가 작지만, 농구 스트리밍 시장에서는 단일 지배적 기기가 아닌 모든 화면 유형에 걸친 유연한 접근이 점점 더 중요시되고 있기 때문에 여전히 중요한 역할을 하고 있습니다.
지역별 분석
2025년, 북미는 농구 스트리밍 시장 규모의 56.66%를 차지했으며, 수익화된 농구 시청 부문에서 이 지역은 다른 모든 지역을 크게 앞질렀습니다. 이러한 선두 위상은 NBA의 탄탄한 미디어 인프라와 2025-26 시즌 중계권 재편에 기인한 것으로, 이를 통해 ABC, ESPN, Peacock, Prime Video, NBA TV가 보다 광범위한 전국적 스트리밍 사이클에 통합되었습니다. 2026년 6월, NBA는 정규 시즌 동안 미국 내 총 시청자 수가 1억 7,000만 명에 달했으며, 전 세계 생중계 시간이 13억 시간을 넘어섰다고 발표했습니다. 이는 북미 생태계의 규모적 우위를 여실히 보여줍니다. 캐나다 역시 강력한 스포츠 전문 네트워크를 통한 방송과 소비자에 대한 직접적인 접근을 통해 유사한 길을 걷고 있으며, 번들형 및 단독형 서비스 모두에서 농구를 항상 시청할 수 있는 상태를 유지하고 있습니다. 남미는 수익 면에서는 여전히 규모가 작지만, 지역 플랫폼 및 해외 리그의 패키지 제공을 통해 국경을 초월한 경기 접근성이 확대됨에 따라 농구 스트리밍 시장이 성장세를 보이고 있습니다.
유럽은 단일하고 통합된 농구권이라기보다는 여전히 중계권이 모자이크 형태로 분산된 상태이며, 국가별로 서로 다른 방송사와 스트리밍 사업자가 FIBA, 유로리그 및 국내 리그에 대한 접근을 관리하고 있습니다. Movistar Plus+와 유로리그는 2030-31 시즌까지 스페인 내 파트너십을 연장했습니다. 이는 확립된 유럽 시장에서 기존 구독 플랫폼이 여전히 중요한 역할을 하고 있음을 보여줍니다. 이러한 구조는 지속적인 수익을 뒷받침하는 한편, 많은 시청자가 이미 광범위한 유료 TV나 멀티스포츠 번들 서비스를 통해 농구를 시청하고 있기 때문에 새로운 DTC(Direct-to-Consumer) 확장을 지연시키는 요인이 되기도 합니다. 아시아태평양은 2031년까지 연평균 성장률(CAGR) 14.23%를 나타낼 것으로 예측되며, 농구 스트리밍 시장에서 가장 빠르게 성장하는 지역이 될 전망입니다. 중국에서 FIBA와 Migu 간의 독점적인 디지털 제휴, 그리고 아시아태평양 주요 전역에서 NBA 시청자 수가 강력한 성장세를 보이고 있는 점을 고려할 때, 이 지역에서는 프리미엄 시청과 모바일 주도형 시청 모두에서 장기적인 성장 여지가 기대됩니다.
아프리카에서는 시청 환경이 제한적이었던 상황에서 다층적인 접근 체계로 전환되고 있으며, 2025년 11월에는 NBA가 SuperSport 채널로 복귀함과 동시에 사하라 이남 50개국 이상에서 Showmax를 통해 처음으로 방송될 예정입니다. 2026년 5월, ESPN 아프리카는 사하라 이남 아프리카 전역에서 NBA 파이널의 유료 TV 독점 중계권을 획득했으며, 이를 통해 지역 스트리밍 모델에 프리미엄 계층이 추가되었습니다. 중동에서는 스포츠 전문 서비스와 통신 사업자의 제휴를 통한 스트리밍이 확대되고 있으며, 이를 통해 시청자들은 익숙한 결제 시스템을 통해 프리미엄 농구 컨텐츠를 시청할 수 있게 되었습니다. 두 지역 모두에서 농구 스트리밍 시장의 가장 큰 성장 기회는 여전히 현지 결제 수단, 현지 언어로 된 실황 해설, 그리고 충실한 온디맨드 검색 기능을 결합한 통합형 직접 플랫폼의 구축에 있습니다.
기타 혜택 :
- 엑셀 형식 시장 예측(ME) 시트
- 3개월간의 애널리스트 지원
자주 묻는 질문
목차
제1장 서론
제2장 조사 방법
제3장 주요 요약
제4장 시장 구도
제5장 시장 규모 및 성장 예측
제6장 경쟁 구도
제7장 시장 기회 및 향후 전망
AJY 26.08.11According to Mordor Intelligence, the basketball streaming market size stood at USD 4.35 billion in 2025 and is projected to reach USD 9.57 billion by 2031, at a CAGR of 13.64% from 2026 to 2031.
This report is Segmented by Device Type (Smartphones and Tablets, Smart TVs, and Laptops and Desktops), Content Type (International Matches, and Domestic Matches), Streaming Type (Live Streaming, and On-Demand Streaming), and Geography (North America, South America, Europe, Asia-Pacific, Middle East, and Africa). The Market Forecasts are Provided in Terms of Value (USD).
Global Basketball Streaming Market Trends and Insights
Expansion of Direct-to-Consumer League Pass Ecosystems
The NBA's July 2024 media agreement placed Prime Video and Peacock beside ABC and ESPN, which shifted premium basketball into a lasting hybrid system where streaming sits at the center of national access rather than beside it. By the close of the upcoming regular season, total U.S. viewership is expected to reach a significant level, while global live coverage is projected to expand substantially. This trend shows that digital distribution can expand audience scale without diluting the value of premium rights. Watch hours per user on the NBA App are also expected to increase meaningfully, indicating that owned league platforms are becoming meaningful audience engagement and retention channels rather than support layers for broadcast partners. This model gives rights holders greater direct control over pricing, packaging, and first-party audience behavior, which is important as subscriber decisions can now be tracked closer to the point of purchase and renewal. For the basketball streaming market, this creates a more durable revenue loop in which distribution control, customer data, and content value reinforce each other over time.
Rising Live-Sports Ad Inventory Premiums on Connected Screens
Live basketball continues to deliver appointment viewing at scale, making it one of the few streaming content types that can consistently support premium connected-screen advertising. Standard live sports CTV placements commonly command high CPMs, while interactive or event-triggered units can exceed that range, raising the revenue ceiling for platforms with premium game inventory. Premion reported that most advertisers already active in live sports CTV planned to increase spending over the next 12 months, while many nonbuyers also expected to enter the category. Basketball is particularly well-positioned because the regular season provides platforms with a large volume of premium inventory across many nights, unlike sports that rely primarily on a few tentpole events. In the basketball streaming market, this advertising depth matters because it supports a two-engine model in which subscription revenue and premium advertising both contribute to rights monetization.
Fragmented Rights Ownership Across Leagues, Teams, and Territories
Rights fragmentation remains one of the clearest structural limits on scale because basketball content is divided across national league packages, local team packages, and territory-specific international agreements. FIBA's distribution setup shows this clearly, with separate arrangements across markets such as Germany and China rather than one unified worldwide digital access model. The NBA's ongoing local rights transition adds another layer because fans may still need different services depending on team location, national package, and competition type. When viewers cannot predict where a game will appear, the discovery burden rises, and the value of each individual subscription weakens. For the basketball streaming market, that means a large share of underlying fan demand still does not convert cleanly into stable recurring revenue.
Other drivers and restraints analyzed in the detailed report include:
- Mobile-First Consumption Among Younger Basketball Fans
- Subscription Bundling with Telecom and Pay-TV Offers
- High Sports Rights Inflation Compresses Margins
For complete list of drivers and restraints, kindly check the Table Of Contents.
Segment Analysis
Smartphones and tablets held 55.23% of the basketball streaming market share in 2025, which made mobile the leading access point for both live viewing and short-form basketball consumption across regions. That lead reflects more than convenience because league apps, regional services, and international basketball products are increasingly designed around fast sign-in, short-form discovery, and portable viewing behavior from the first user touchpoint. Disney Advertising reported in 2025 that younger sports audiences already spent most of their viewing time on devices other than television, which helps explain why basketball aligns so well with the mobile environment. WSC Sports also found strong streaming preference among Gen Z and Millennial fans, which reinforces the link between basketball fandom and mobile-native behavior in the basketball streaming industry.
Mobile leadership also fits the rhythm of basketball viewing because fans often check in repeatedly across a game rather than committing only to a single uninterrupted long session. The NBA's 2026 regular-season results showed nearly 20 million live game streams from Tap to Watch, which supports the view that fast, low-friction mobile access is now central to engagement growth. Smart TVs are projected to grow at a 13.86% CAGR through 2031, which shows that living-room streaming is becoming more important as households expect premium sports inside connected home entertainment setups. This shift improves monetization because premium live sports inventory on connected televisions is priced well above open web video, giving rights holders a better revenue mix as screen time migrates upward. Laptops, desktops, consoles, and emerging interactive devices remain smaller in revenue terms, but they still matter because the basketball streaming market increasingly rewards flexible access across every screen type rather than a single dominant device.
Complete Report Scope:
- By Device Type
- Smartphones and Tablets
- Smart TVs
- Laptops and Desktops
- Other Device Type
- By Content Type
- International Matches
- Domestic Matches
- Other Content Type
- By Streaming Type
- Live Streaming
- On-demand Streaming
- Other Streaming Type
- By Geography
- North America
- United States
- Canada
- Mexico
- South America
- Brazil
- Argentina
- Chile
- Rest of South America
- Europe
- Germany
- United Kingdom
- France
- Italy
- Spain
- Rest of Europe
- Asia-Pacific
- China
- Japan
- India
- South Korea
- Australia
- Rest of Asia-Pacific
- Middle East
- Saudi Arabia
- United Arab Emirates
- Qatar
- Rest of Middle East
- Africa
- South Africa
- Egypt
- Nigeria
- Rest of Africa
- North America
Geography Analysis
North America held 56.66% of the basketball streaming market size in 2025, which kept the region far ahead of every other geography in monetized basketball viewing. The lead rests on the NBA's deep media infrastructure and on the 2025-26 rights reset that placed ABC and ESPN, Peacock, Prime Video, and NBA TV inside one broader national streaming cycle. In June 2026, the NBA said the regular season reached 170 million total U.S. viewers and more than 1.3 billion hours of global live coverage, which underlined the scale advantage of the North American ecosystem. Canada followed a similar path through strong sports network distribution and direct-to-consumer access, which kept basketball discoverable across both bundled and stand-alone products. South America remains smaller in revenue terms, but the basketball streaming market is broadening there as regional platforms and imported league packages extend access to more cross-border competitions.
Europe remains a rights mosaic rather than a single unified basketball zone, with different broadcasters and streamers controlling FIBA, EuroLeague, and domestic league access by country. Movistar Plus+ and EuroLeague extended their Spanish partnership through the 2030-31 season, which shows how incumbent subscription platforms still matter in established European markets. This setup supports recurring revenue, but it also slows greenfield direct-to-consumer expansion because many viewers already receive basketball inside broader pay television or multi-sport bundles. Asia-Pacific is projected to grow at a 14.23% CAGR through 2031, making it the fastest-growing region in the basketball streaming market. FIBA's exclusive digital partnership with Migu in China and strong NBA audience momentum across key Asia-Pacific territories give the region a long runway for both premium and mobile-led viewing.
Africa is moving from limited availability toward multi-tier access, with the NBA returning to SuperSport channels and debuting on Showmax across more than 50 sub-Saharan countries in November 2025. In May 2026, ESPN Africa secured exclusive pay television rights to the NBA Finals across sub-Saharan Africa, which added a premium layer to the regional distribution model. The Middle East is advancing through a mix of dedicated sports services and telecom-linked distribution, which helps premium basketball content reach viewers through familiar billing relationship. Across both regions, the biggest opening in the basketball streaming market is still a unified direct platform that combines local payments, localized commentary, and strong on-demand discovery.
- ESPN
- Warner Bros. Discovery, Inc.
- Amazon.com, Inc.
- NBCUniversal Media, LLC
- YouTube, LLC
- Paramount Global
- DAZN Limited
- fuboTV Inc.
- NBA Media Ventures, LLC
- Turner Broadcasting System, Inc.
- Eleven Sports Network
- Tencent Holdings Limited
- Viaplay Group AB
- Sky Group Limited
- Walt Disney Company
- Apple Inc.
- Rakuten Group, Inc.
- Sony Group Corporation
- Hudl
- Sportradar Group AG
Additional Benefits:
- The market estimate (ME) sheet in Excel format
- 3 months of analyst support
TABLE OF CONTENTS
1 INTRODUCTION
- 1.1 Study Assumptions and Market Definition
- 1.2 Scope Of The Study
2 RESEARCH METHODOLOGY
3 EXECUTIVE SUMMARY
4 MARKET LANDSCAPE
- 4.1 Market Overview
- 4.2 Market Drivers
- 4.2.1 Expansion of Direct-To-Consumer League Pass Ecosystems
- 4.2.2 Rising Live-Sports Ad Inventory Premiums on Connected Screens
- 4.2.3 Mobile-First Consumption Among Younger Basketball Fans
- 4.2.4 Subscription Bundling With Telecom and Pay-TV Offers
- 4.2.5 AI-Powered Personalization and Highlights Improve Retention
- 4.2.6 Monetization of Youth, College, and International Basketball Rights
- 4.3 Market Restraints
- 4.3.1 Fragmented Rights Ownership Across Leagues, Teams, and Territories
- 4.3.2 High Sports Rights Inflation Compresses Margins
- 4.3.3 Piracy and Unauthorized Restreaming Reduce Monetizable Reach
- 4.3.4 Variable Broadband Quality and Latency Hurts Premium Live Viewing
- 4.4 Industry Value Chain Analysis
- 4.5 Impact Of Macroeconomic Factors On The Market
- 4.6 Regulatory Landscape
- 4.7 Technological Outlook
- 4.8 Porter's Five Forces Analysis
- 4.8.1 Bargaining Power Of Suppliers
- 4.8.2 Bargaining Power Of Buyers
- 4.8.3 Threat Of New Entrants
- 4.8.4 Threat Of Substitutes
- 4.8.5 Competitive Rivalry
5 MARKET SIZE AND GROWTH FORECASTS (VALUE)
- 5.1 By Device Type
- 5.1.1 Smartphones and Tablets
- 5.1.2 Smart TVs
- 5.1.3 Laptops and Desktops
- 5.1.4 Other Device Type
- 5.2 By Content Type
- 5.2.1 International Matches
- 5.2.2 Domestic Matches
- 5.2.3 Other Content Type
- 5.3 By Streaming Type
- 5.3.1 Live Streaming
- 5.3.2 On-demand Streaming
- 5.3.3 Other Streaming Type
- 5.4 By Geography
- 5.4.1 North America
- 5.4.1.1 United States
- 5.4.1.2 Canada
- 5.4.1.3 Mexico
- 5.4.2 South America
- 5.4.2.1 Brazil
- 5.4.2.2 Argentina
- 5.4.2.3 Chile
- 5.4.2.4 Rest of South America
- 5.4.3 Europe
- 5.4.3.1 Germany
- 5.4.3.2 United Kingdom
- 5.4.3.3 France
- 5.4.3.4 Italy
- 5.4.3.5 Spain
- 5.4.3.6 Rest of Europe
- 5.4.4 Asia-Pacific
- 5.4.4.1 China
- 5.4.4.2 Japan
- 5.4.4.3 India
- 5.4.4.4 South Korea
- 5.4.4.5 Australia
- 5.4.4.6 Rest of Asia-Pacific
- 5.4.5 Middle East
- 5.4.5.1 Saudi Arabia
- 5.4.5.2 United Arab Emirates
- 5.4.5.3 Qatar
- 5.4.5.4 Rest of Middle East
- 5.4.6 Africa
- 5.4.6.1 South Africa
- 5.4.6.2 Egypt
- 5.4.6.3 Nigeria
- 5.4.6.4 Rest of Africa
- 5.4.1 North America
6 COMPETITIVE LANDSCAPE
- 6.1 Market Concentration
- 6.2 Strategic Moves
- 6.3 Vendor Positioning Analysis
- 6.4 Company Profiles (includes Global Level Overview, Market Level Overview, Core Segments, Financials as available, Strategic Information, Market Rank/Share, Products and Services, Recent Developments)
- 6.4.1 ESPN
- 6.4.2 Warner Bros. Discovery, Inc.
- 6.4.3 Amazon.com, Inc.
- 6.4.4 NBCUniversal Media, LLC
- 6.4.5 YouTube, LLC
- 6.4.6 Paramount Global
- 6.4.7 DAZN Limited
- 6.4.8 fuboTV Inc.
- 6.4.9 NBA Media Ventures, LLC
- 6.4.10 Turner Broadcasting System, Inc.
- 6.4.11 Eleven Sports Network
- 6.4.12 Tencent Holdings Limited
- 6.4.13 Viaplay Group AB
- 6.4.14 Sky Group Limited
- 6.4.15 Walt Disney Company
- 6.4.16 Apple Inc.
- 6.4.17 Rakuten Group, Inc.
- 6.4.18 Sony Group Corporation
- 6.4.19 Hudl
- 6.4.20 Sportradar Group AG
7 MARKET OPPORTUNITIES AND FUTURE OUTLOOK
- 7.1 White-Space And Unmet-Need Assessment


