|
시장보고서
상품코드
2118964
OTT용 엣지 스트리밍 인프라 : 시장 점유율 분석, 업계 동향 및 통계, 성장 예측(2026-2031년)Edge Streaming Infrastructure For OTT - Market Share Analysis, Industry Trends & Statistics, Growth Forecasts (2026 - 2031) |
||||||
 Mordor Intelligence
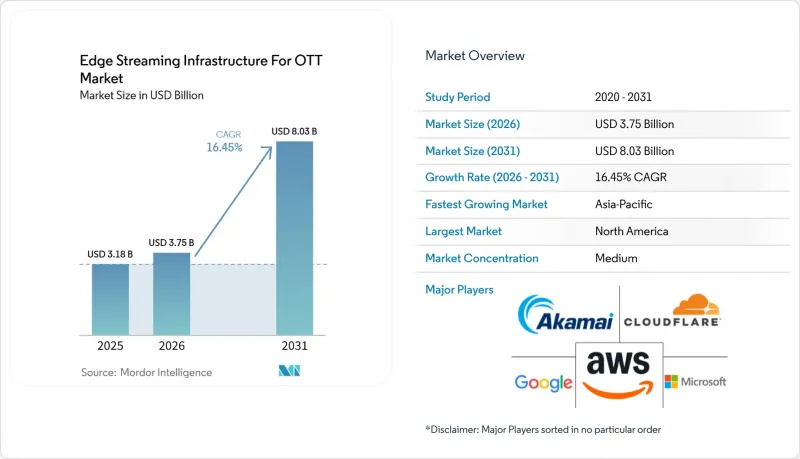
OTT용 엣지 스트리밍 인프라 시장 규모는 2025년 31억 8,000만 달러로 평가되었습니다. 2026년에는 37억 5,000만 달러로 확대되어 2031년까지 80억 3,000만 달러에 이를 것으로 예상되고 2026년부터 2031년에 걸쳐 CAGR 16.45%로 성장할 전망입니다.
본 보고서는 구성 요소(솔루션 및 서비스), 스트리밍 유형(라이브 이벤트 스트리밍, 리니어 및 FAST 스트리밍 등), 최종 사용자(방송사, TV 네트워크, FAST 사업자, 통신 사업자, 유료 TV 및 인터넷 서비스 제공업체,스포츠 저작권 보유자 및 라이브 이벤트 주최자 등) 및 지역별로 분류되어 있습니다. 시장 전망은 금액(달러) 기준으로 제시되어 있습니다.
OTT용 엣지 스트리밍 인프라 시장 동향 및 인사이트
OTT 동영상 트래픽 및 4K/8K의 보급
OTT용 엣지 스트리밍 인프라 시장은 동영상 화질의 향상에 따라 시청 세션당 필요한 대역폭이 증가함에 따라 혜택을 받게 됩니다. 고화질 4K 스트리밍에는 최소 20 Mbps의 지속적인 비트레이트가 필요하며, 8K 전송에는 세션당 60-90 Mbps가 필요합니다. 많은 시청자가 동시에 이러한 스트림을 요청할 경우, 중앙 집중형 오리진에서는 비용이 증가하고 확장성이 어려워질 수 있습니다. Amazon Prime Video는 2026년 1월, 에피소드당 33개의 분기점이 있고 평균 세션 시간이 94분인 최초의 진정한 8K 인터랙티브 시리즈를 스트리밍하기 시작했습니다. 이는 디스플레이가 널리 보급되기 전에 주요 플랫폼들이 8K 제작 및 스트리밍 워크플로우를 준비하고 있음을 보여줍니다. 노키아의 보고서에 따르면, 동영상 스트리밍은 전체 소비자 모바일 트래픽의 73%를 차지하고 있으며, 이것이 바로 통신사들이 동영상의 지속적인 성장을 예상하여 엣지 용량을 구축하고 있는 이유입니다.
메트로 엣지 노드에 저장된 4K 스트림은 1080p 스트림에 비해 오리진 대역폭을 4-5배 절약합니다. 이러한 차이로 인해 동영상 포맷의 해상도가 높아질수록 캐시 배치의 가치가 커집니다. 또한, 커넥티드 TV 단말기에서는 많은 모바일 세션보다 더 높은 비트레이트의 스트림으로 주문형 비디오(VOD)를 시청하는 경향이 있습니다. 성숙한 시장에서 고해상도의 보급과 신흥 경제국에서의 광대역 성장이 맞물려 분산형 용량에 대한 수요를 뒷받침하고 있습니다. 엣지 네트워크는 빈번하게 요청되는 부문을 시청자 근처에 보관함으로써 중앙 오리진에 가해지는 부하를 줄일 수 있습니다. 이로 인해 OTT 시장을 위한 엣지 스트리밍 인프라는 기존의 구독 서비스와 새로운 스트리밍 플랫폼 모두에게 중요한 요소가 되고 있습니다.
라이브 스포츠 및 인터랙티브 스트리밍에는 낮은 지연 시간이 필수적
스포츠 생중계에서는 일반적인 주문형 비디오(VOD) 전송 시스템으로는 관리하기 어려운 급격하고 예측 가능한 트래픽 피크가 발생합니다. 경기 중 시청자가 인플레이 베팅, 소셜 기능, 세컨드 스크린 앱을 이용하면 지연 현상이 더욱 두드러집니다. Tubi사의 보고에 따르면, 2025년 2월 슈퍼볼 LIX 방송에서는 동시 시청자 수가 1,550만 명에 달했으며, 4K 화질로 2,400만 명 이상의 고유 시청자에게 전송되었습니다. 이 회사는 이 이벤트를 1초 미만의 지연으로 전송했다고 밝혔으며, 이는 주요 무료 시청 이벤트에 요구되는 운영 기준을 보여줍니다. 결승전 중 발생하는 스트리밍 장애는 방송사의 브랜드 이미지를 훼손하고 계약상 의무 이행을 위태롭게 할 우려가 있습니다. 이러한 요구 사항으로 인해 여러 컨텐츠 전송 네트워크, 자동 장애 조치 및 로컬 용량에 대한 관심이 높아지고 있습니다.
저지연 HLS 및 청크화된 CMAF는 인코딩이 완료되기 전에 기업이 부분적인 부문을 요청할 수 있도록 함으로써 주요 스포츠 중계의 지연을 2-5초로 단축할 수 있습니다. ETSI의 다중 액세스 엣지 컴퓨팅(MAEC) 프레임워크는 처리 및 전송 기능을 사용자에게 더 가까운 곳에 배치하는 것을 지원합니다. 로컬 처리를 통해 트래픽이 급증할 때 발생하는 첫 프레임 지연 및 리버퍼링을 완화할 수 있습니다. 따라서 스포츠 관련 계약은 제공업체가 엣지 노드 및 용량 여유를 어떻게 설계할지에 영향을 미칩니다. OTT 시장을 위한 엣지 스트리밍 인프라는 콘서트, 뉴스, 인터랙티브 프로그램 및 기타 라이브 형식도 지원할 수 있습니다. 이를 통해 스포츠 전용 워크로드에 국한되지 않는 OTT 시장을 위한 엣지 스트리밍 인프라의 새로운 기회가 창출됩니다.
CDN의 상품화와 멀티 CDN에 따른 가격 하락
주요 제공업체들이 전송 서비스를 보다 광범위한 클라우드 서비스와 패키지로 묶어 제공할 수 있게 됨에 따라, 컨텐츠 전송 가격 책정은 압박을 받고 있습니다. 아카마이(Akamai)의 전송 부문은 2025년에 전년 대비 5%의 매출 감소를 겪었지만, 반면 보안 및 클라우드 컴퓨팅이 해당 회사의 수익의 70% 가까이를 차지했습니다. 이러한 변화는 회사가 대역폭 판매에만 의존하던 방식에서 벗어나고 있음을 반영합니다. 주요 OTT 서비스들은 기존 4-6개사였던 멀티 CDN 공급업체 수를 2-3개사로 줄이고 있습니다. 트래픽 할당은 국가 단위나 개별 인터넷 서비스 제공업체 단위로 이루어지는 사례가 늘고 있습니다. 이로 인해 기존 CDN 가격 책정의 기반이 되어 온 트래픽 양에 대한 약정이 약화될 가능성이 있습니다.
아카마이는 하드웨어 및 전력 비용에 대응하기 위해 2026년 2분기에월3%의 고객 추가 요금을 도입했습니다. 이 변경은 현재 가격 수준에서는 전송 단독의 이익률을 유지하는 것이 여전히 어렵다는 점을 보여줍니다. 또한, 남미 및 일부 아시아태평양 시장에서는 인터넷 서비스 제공업체(ISP) 요금이 북미의 벤치마크를 상회하고 있어 현지 전송 비용에도 편차가 나타나고 있습니다. 따라서 제공업체는 현지 네트워크 요금이 높은 지역에서도 용량을 확보하면서 가격 압박에 대처해야 합니다. 스트리밍이 ‘대체 가능한 서비스’로 간주되는 한, OTT 시장을 위한 엣지 스트리밍 인프라는 여전히 취약한 상태에 있습니다. 스트리밍에 보안, 처리, 운영 지원을 결합한 제공업체일수록 수익을 지킬 여지가 더 넓어집니다.
부문별 분석
2025년 기준으로 솔루션은 OTT용 엣지 스트리밍 인프라 시장 점유율의 40.45%를 차지했으며, 2031년까지 연평균 성장률(CAGR) 17.01%로 확대될 것으로 예측됩니다. 이 카테고리에는 엣지 전송 및 캐싱, 미디어 처리, 트래픽 관리, 보안, 경험 품질(QoE) 도구가 포함됩니다. 사업자들은 단순히 전송만 수행하는 시스템에서 이러한 기능 중 일부를 통합적으로 관리할 수 있는 플랫폼으로 전환하고 있습니다. 이를 통해 트래픽이 집중되는 이벤트 발생 시 개별 도구를 조정해야 할 필요성이 줄어듭니다. 아카마이는 2026년 3월, 4,400곳의 엣지 거점에서 ‘AI Grid Intelligent Orchestration’ 서비스를 제공하기 시작했습니다. 이 회사에 따르면, 이번 도입을 통해 실시간 트랜스코딩, 더빙, 개인화된 전송 등의 처리 과정에서 50밀리초 미만의 분산 추론이 가능해진다고 합니다. 이 사례는 전송 네트워크가 단순한 컨텐츠 전송 이상의 용도로 활용되고 있음을 보여줍니다.
솔루션 투자에 있어 스트리밍의 가시성과 품질 경험(QoE) 분석이 점점 더 주목받고 있습니다. 특히 스포츠 중계 등에서 서비스 수준 계약(SLA)이 적용되는 경우, 사업자는 버퍼링, 재버퍼링, 재생 장애, 지연에 대해 실시간 가시성을 확보해야 합니다. 이러한 도구는 문제가 인코딩, 네트워크, 디바이스, 또는 전송 경로 중 어디에서 기인하는지 파악하는 데 도움이 됩니다. 또한, 프리미엄 라이브 컨텐츠가 불법 복제 피해를 유발함에 따라 보안 및 접근 제어의 중요성도 높아지고 있습니다. 통합 플랫폼을 통해 이러한 기능을 동일한 운영 환경에 집약할 수 있습니다. 이를 통해 사업자가 전송 관련 서비스를 확충함에 따라 OTT 시장 내 엣지 스트리밍 인프라에 대한 지속적인 수요가 뒷받침됩니다. 또한 공급업체 입장에서는 단순한 대역폭 판매에서 벗어나는 길도 열립니다.
서비스는 나머지 수익원을 차지하고 있으며, 엣지 구축을 위한 사내 엔지니어링 팀을 보유하지 않은 사업자에게 중요합니다. 관리형 전송, 전문 서비스 및 도입 지원은 방송 사업자가 기존 방송 워크플로우에서 OTT 전송으로 전환할 수 있도록 돕습니다. 아시아태평양, 중동, 남미에서는 IP 전송 프로젝트의 신규 도입 및 확장이 다수 관찰됩니다. 이러한 시장에서는 공급업체가 설계, 튜닝, 보안 설정 및 지속적인 운영을 지원하는 경우가 많습니다. 통신 사업자 주도의 OTT 서비스 개시 또한 현지 도입 지원에 대한 수요를 창출하고 있습니다. 프로바이더가 새로운 전송 인프라를 관리하는 경우, 해당 업무는 수년에 걸친 협력 관계로 이어질 가능성이 있습니다. 따라서 이러한 서비스는 솔루션 수익을 보완하며, OTT 산업을 위한 엣지 스트리밍 인프라를 제공하는 프로바이더 기반을 확대합니다.
지역별 분석
2025년, 북미는 OTT용 엣지 스트리밍 인프라 시장 점유율의 37.40%를 차지했습니다. 이 지역에는 주요 구독형 플랫폼, 스포츠 방송사, 그리고 최대 규모의 FAST 채널 생태계가 존재합니다. 이 지역에서는 다른 지역에 비해 독자적인 전송 네트워크가 더 일반적입니다. 넷플릭스, 유튜브, 틱톡, 그리고 점점 더 아마존도 자사의 전송 인프라 상당 부분을 내부에서 운영하고 있습니다. 그 결과, 상업적 수요는 지역 서비스, 방송사, 스포츠 저작권 보유자에게 집중되어 있습니다. 캐나다와 멕시코에서는 통신 사업자의 엣지 구축과 미국 내 스페인어 OTT의 성장을 통해 수요가 확대되고 있습니다.
‘인프라 투자 및 고용법’에 근거한 연방통신위원회(FCC)의 광대역 자금 지원은 농촌 지역의 라스트 마일 접속 확대를 지원하고 있습니다. 접속이 확대되면 스트리밍 서비스의 잠재 시청자층도 넓어질 가능성이 있습니다. 유럽은 AVMSD(시청각 미디어 서비스 지침), 일반 데이터 보호 규정(GDPR(EU 개인정보보호규정)), 그리고 AI법에 의해 형성되고 있습니다. 이러한 규제는 데이터 저장 장소, 시청자 타겟팅, 그리고 알고리즘 투명성에 대한 고려를 촉진하고 있습니다. 영국, 독일, 프랑스는 중요한 수익원으로 자리 잡고 있습니다. BBC, TF1, ProSiebenSat.1은 선형 시청이 감소하는 가운데 IP 전송을 확대되고 있습니다. 유럽 내 5G MEC의 구축 또한 통신 사업자의 엣지 환경에서 저지연 스트리밍을 뒷받침하고 있습니다.
아시아태평양은 2031년까지 16.81%라는 지역별 최고 연평균 성장률(CAGR)을 보일 것으로 예측됩니다. 인도의 스트리밍 수요는 가입자 수와 국내의 치열한 경쟁에 의해 견인되고 있습니다. 일본의 성장은 사용자 1인당 수익, 스포츠 컨텐츠의 차별화, 그리고 광고 지원형 동영상과 더 밀접한 관련이 있습니다. 한국과 호주는 사용자 1인당 인프라 구축 수준이 매우 높은 성숙한 시장입니다. 남미, 중동 및 아프리카는 여전히 규모는 작지만 계속해서 확대되고 있습니다. 브라질에서는 통신 사업자와 제휴한 OTT 서비스를 통해 FAST 채널의 제공이 확대되고 있으며, 중동에서는 스포츠 및 문화 행사를 위한 용량 확충이 진행되고 있습니다. 아프리카에서는 라스트 마일 대역폭 및 전력 공급 제약으로 인해 단기적인 규모 확대가 제한되고 있으며, 남아프리카공화국, 나이지리아, 이집트 등의 주요 도시권에 도입이 집중되고 있습니다.
기타 혜택 :
- 엑셀 형식 시장 예측(ME) 시트
- 3개월간의 애널리스트 지원
자주 묻는 질문
목차
제1장 서론
제2장 조사 방법
제3장 주요 요약
제4장 시장 구도
제5장 시장 규모 및 성장 예측
제6장 경쟁 구도
제7장 시장 기회 및 향후 전망
KTH 26.09.04According to Mordor Intelligence, the edge streaming infrastructure for OTT market size is expected to increase from USD 3.18 billion in 2025 to USD 3.75 billion in 2026 and reach USD 8.03 billion by 2031, growing at a CAGR of 16.45% over 2026-2031.
This report is Segmented by Component (Solutions, and Services), Streaming Type (Live Event Streaming, Linear and FAST Streaming, and More), End User (Broadcasters, Television Networks, and FAST Operators, Telecom, Pay-TV, and Internet Service Providers, Sports Rights Holders and Live-Event Organizations, and More), and Geography. The Market Forecasts are Provided in Terms of Value (USD).
Global Edge Streaming Infrastructure For OTT Market Trends and Insights
OTT Video Traffic and 4K/8K Adoption
The edge streaming infrastructure for OTT market benefits when higher video quality raises the bandwidth needed for every viewing session. Good-quality 4K streaming requires at least 20 Mbps of sustained bitrate, while 8K delivery requires 60-90 Mbps per session. A centralized origin can become costly and difficult to scale when large audiences request these streams at the same time. Amazon Prime Video launched its first true 8K interactive series in January 2026, with 33 decision points per episode and an average session time of 94 minutes. This indicates that leading platforms are preparing 8K production and delivery workflows before displays become widely adopted. Nokia reported that video streaming accounted for 73% of total consumer mobile traffic, showing why providers are building edge capacity for continued video growth.
A 4K stream stored at a metro edge node avoids 4-5 times more origin bandwidth than a 1080p stream. That difference makes cache placement more valuable as the video format becomes heavier. Connected television devices also shift video-on-demand viewing toward higher-bitrate streams than many mobile sessions. The combination of higher resolution in mature markets and broadband growth in emerging economies supports demand for distributed capacity. Edge networks can keep frequently requested segments close to viewers and reduce pressure on central origins. This makes the edge streaming infrastructure for OTT market relevant to both established subscription services and newer streaming platforms.
Live Sports and Interactive Streaming Require Lower Latency
Live sports delivery creates sharp and predictable peaks that are difficult to manage through ordinary video-on-demand delivery systems. A delay becomes more visible when viewers use in-play betting, social features, or second-screen applications during a match. Tubi reported that its February 2025 Super Bowl LIX broadcast reached 15.5 million concurrent viewers and served more than 24 million unique viewers in 4K. The company stated that it delivered the event with sub-second latency, which shows the operating standard expected for major free-to-view events. A delivery failure during a final can damage a broadcaster's brand and put contractual obligations at risk. These requirements increase interest in multiple content delivery networks, automated failover, and local capacity.
Low-Latency HLS and chunked CMAF can reduce mainstream sports latency to 2-5 seconds by allowing players to request partial segments before encoding is complete. The ETSI Multi-access Edge Computing framework supports moving processing and delivery functions closer to users. Local processing can reduce first-frame delay and rebuffering when traffic increases rapidly. Sports agreements therefore influence how providers design edge locations and capacity reserves. The edge streaming infrastructure for OTT market can also support concerts, news, interactive programs, and other live formats. This creates an opportunity for the edge streaming infrastructure for OTT market beyond sports-only workloads.
CDN Commoditization and Multi-CDN Price Erosion
Content delivery pricing is under pressure because large providers can package delivery with broader cloud services. Akamai's delivery segment faced a 5% year-over-year decline in 2025, while security and cloud compute represented nearly 70% of its revenue. This change reflects the company's move away from dependence on bandwidth-only sales. Large OTT services are reducing their typical multi-CDN stacks from 4-6 suppliers to 2-3 suppliers. Traffic is increasingly allocated at the country or individual internet service provider level. This can weaken the volume commitments on which traditional CDN pricing depends.
Akamai introduced a 3% monthly client surcharge in the second quarter of 2026 to help address hardware and power costs. The change shows that standalone delivery margins remain difficult at current prices. Local delivery costs are also uneven because internet service provider charges in South America and some Asia-Pacific markets exceed North American benchmarks. Providers must therefore manage price pressure while keeping capacity where local network fees are high. The edge streaming infrastructure for OTT market remains exposed when delivery is viewed as an interchangeable service. Providers that combine delivery with security, processing, and operational support have more room to protect revenue.
Other drivers and restraints analyzed in the detailed report include:
- 5G and Telecom-Edge Expansion
- Edge-Assisted Dynamic Ad Insertion and Personalization
- Large OTT Platforms In-Sourcing Delivery Capacity
For complete list of drivers and restraints, kindly check the Table Of Contents.
Segment Analysis
Solutions accounted for 40.45% of the edge streaming infrastructure for OTT market share in 2025 and are projected to advance at a 17.01% CAGR through 2031. The category includes edge delivery and caching, media processing, traffic management, security, and quality-of-experience tools. Operators are replacing delivery-only systems with platforms that can manage several of these functions together. This reduces the need to coordinate separate tools during high-traffic events. Akamai launched AI Grid Intelligent Orchestration across 4,400 edge locations in March 2026. The company stated that the deployment supports distributed inference below 50 milliseconds for work such as real-time transcoding, dubbing, and personalized delivery. The example shows that delivery networks are being used for more than content transfer.
Streaming observability and quality-of-experience analytics are receiving more attention within solutions spending. Operators need real-time visibility into buffering, rebuffering, playback failures, and latency, especially when service-level commitments apply to sports. These tools can help teams locate whether an issue originated in encoding, the network, a device, or a delivery route. Security and access control also become more valuable as premium live content attracts piracy. Integrated platforms can bring these functions into the same operating environment. This supports recurring demand for the edge streaming infrastructure for OTT market as operators add services around delivery. It also gives suppliers a path away from selling bandwidth alone.
Services represented the remaining component revenue and are important for operators that do not have internal engineering teams for edge deployment. Managed delivery, professional services, and implementation support can help a broadcaster move from broadcast workflows to OTT delivery. Asia-Pacific, the Middle East, and South America contain many first-time or expanding IP-delivery projects. In these markets, suppliers often support design, tuning, security configuration, and ongoing operations. Telco-led OTT launches also create demand for local implementation support. The work can form a multi-year relationship when a provider manages new distribution infrastructure. Services thus complement solutions revenue and broaden the provider base serving the edge streaming infrastructure for OTT industry.
Complete Report Scope:
- By Component
- Solutions
- Edge Content Delivery and Caching Infrastructure
- Edge Compute and Media Processing
- Traffic Management and Delivery Orchestration
- Edge Security and Access Control
- Streaming Observability and Quality-of-Experience Analytics
- Services
- Solutions
- By Streaming Type
- Live Event Streaming
- Linear and FAST Streaming
- Video on Demand
- By End User
- OTT Streaming Platforms
- Broadcasters, Television Networks, and FAST Operators
- Telecom, Pay-TV, and Internet Service Providers
- Sports Rights Holders and Live-Event Organizations
- Content Owners and Digital Media Publishers
- Enterprises and Institutions
- By Geography
- North America
- United States
- Canada
- Mexico
- South America
- Brazil
- Argentina
- Rest of South America
- Europe
- United Kingdom
- Germany
- France
- Russia
- Rest of Europe
- Asia-Pacific
- China
- India
- Japan
- South Korea
- Australia
- Rest of Asia-Pacific
- Middle East
- United Arab Emirates
- Saudi Arabia
- Israel
- Turkey
- Rest of Middle East
- Africa
- South Africa
- Nigeria
- Egypt
- Rest of Africa
- North America
Geography Analysis
North America held 37.40% of the edge streaming infrastructure for OTT market share in 2025. The region contains major subscription platforms, sports broadcasters, and the largest FAST channel ecosystem. Proprietary delivery networks are more common here than in other regions. Netflix, YouTube, TikTok, and increasingly Amazon operate more of their delivery infrastructure internally. Commercial demand is therefore concentrated among regional services, broadcasters, and sports rights holders. Canada and Mexico add demand through telecom-edge deployment and Spanish-language OTT growth in the United States.
Federal Communications Commission broadband funding under the Infrastructure Investment and Jobs Act supports wider last-mile access in rural communities. Greater access can expand the addressable audience for streaming services. Europe is shaped by the AVMSD, the General Data Protection Regulation, and the AI Act. These rules encourage attention to data location, audience targeting, and algorithmic transparency. The United Kingdom, Germany, and France are important revenue contributors. BBC, TF1, and ProSiebenSat.1 are expanding IP delivery as linear viewing declines. Europe's 5G MEC rollout also supports lower-latency streaming at the carrier edge.
Asia-Pacific is expected to record the fastest regional CAGR at 16.81% through 2031. India's streaming demand is driven by subscriber volume and strong domestic competition. Japan's growth is more closely linked to revenue per user, sports differentiation, and advertising-supported video. South Korea and Australia are mature markets with high infrastructure intensity per user. South America, the Middle East, and Africa remain smaller but are expanding. Brazil is adding FAST channel delivery through telecom-bundled OTT services, while the Middle East is adding capacity for sports and cultural events. Last-mile bandwidth and power constraints limit near-term scale in Africa, concentrating deployments in major urban centers such as those in South Africa, Nigeria, and Egypt.
- Akamai Technologies, Inc.
- Amazon Web Services, Inc.
- Cloudflare, Inc.
- Google LLC
- Microsoft Corporation
- Fastly, Inc.
- Edgio, Inc.
- CDNetworks Co., Ltd.
- Tencent Cloud Computing (Beijing) Co., Ltd.
- Alibaba Cloud Computing Ltd.
- Tata Communications Limited
- Verizon Communications Inc.
- AT&T Inc.
- Deutsche Telekom AG
- Lumen Technologies, Inc.
- G-Core Labs S.A.
- Huawei Technologies Co., Ltd.
- Broadpeak S.A.S.
- Qwilt, Inc.
- BunnyWay d.o.o.
Additional Benefits:
- The market estimate (ME) sheet in Excel format
- 3 months of analyst support
TABLE OF CONTENTS
1 INTRODUCTION
- 1.1 Study Assumptions and Market Definition
- 1.2 Scope of the Study
2 RESEARCH METHODOLOGY
3 EXECUTIVE SUMMARY
4 MARKET LANDSCAPE
- 4.1 Market Overview
- 4.2 Impact of Macroeconomic Factors on the Market
- 4.3 Market Drivers
- 4.3.1 Explosion of OTT Video Traffic and 4K/8K Adoption
- 4.3.2 Live Sports and Interactive Streaming Require Lower Latency
- 4.3.3 Edge-Native Traffic Steering and Origin Offload
- 4.3.4 Integrated Security and Delivery Bundles
- 4.3.5 5G and Telecom-Edge Expansion
- 4.3.6 Edge-Assisted Dynamic Ad Insertion and Personalization
- 4.4 Market Restraints
- 4.4.1 CDN Commoditization and Multi-CDN Price Erosion
- 4.4.2 Large OTT Platforms In-Sourcing Delivery Capacity
- 4.4.3 Last-Mile Bandwidth and Power Constraints in Underserved Markets
- 4.4.4 Fragmented Low-Latency Ad-Insertion and Measurement Standards
- 4.5 Industry Value Chain Analysis
- 4.6 Regulatory Landscape
- 4.7 Technological Outlook
- 4.8 Porter's Five Forces Analysis
- 4.8.1 Competitive Rivalry
- 4.8.2 Bargaining Power of Suppliers
- 4.8.3 Bargaining Power of Buyers
- 4.8.4 Threat of New Entrants
- 4.8.5 Threat of Substitutes
5 MARKET SIZE AND GROWTH FORECASTS (VALUE)
- 5.1 By Component
- 5.1.1 Solutions
- 5.1.1.1 Edge Content Delivery and Caching Infrastructure
- 5.1.1.2 Edge Compute and Media Processing
- 5.1.1.3 Traffic Management and Delivery Orchestration
- 5.1.1.4 Edge Security and Access Control
- 5.1.1.5 Streaming Observability and Quality-of-Experience Analytics
- 5.1.2 Services
- 5.1.1 Solutions
- 5.2 By Streaming Type
- 5.2.1 Live Event Streaming
- 5.2.2 Linear and FAST Streaming
- 5.2.3 Video on Demand
- 5.3 By End User
- 5.3.1 OTT Streaming Platforms
- 5.3.2 Broadcasters, Television Networks, and FAST Operators
- 5.3.3 Telecom, Pay-TV, and Internet Service Providers
- 5.3.4 Sports Rights Holders and Live-Event Organizations
- 5.3.5 Content Owners and Digital Media Publishers
- 5.3.6 Enterprises and Institutions
- 5.4 By Geography
- 5.4.1 North America
- 5.4.1.1 United States
- 5.4.1.2 Canada
- 5.4.1.3 Mexico
- 5.4.2 South America
- 5.4.2.1 Brazil
- 5.4.2.2 Argentina
- 5.4.2.3 Rest of South America
- 5.4.3 Europe
- 5.4.3.1 United Kingdom
- 5.4.3.2 Germany
- 5.4.3.3 France
- 5.4.3.4 Russia
- 5.4.3.5 Rest of Europe
- 5.4.4 Asia-Pacific
- 5.4.4.1 China
- 5.4.4.2 India
- 5.4.4.3 Japan
- 5.4.4.4 South Korea
- 5.4.4.5 Australia
- 5.4.4.6 Rest of Asia-Pacific
- 5.4.5 Middle East
- 5.4.5.1 United Arab Emirates
- 5.4.5.2 Saudi Arabia
- 5.4.5.3 Israel
- 5.4.5.4 Turkey
- 5.4.5.5 Rest of Middle East
- 5.4.6 Africa
- 5.4.6.1 South Africa
- 5.4.6.2 Nigeria
- 5.4.6.3 Egypt
- 5.4.6.4 Rest of Africa
- 5.4.1 North America
6 COMPETITIVE LANDSCAPE
- 6.1 Market Concentration
- 6.2 Strategic Moves
- 6.3 Market Positioning Analysis
- 6.4 Company Profiles (includes Global Level Overview, Market Level Overview, Core Segments, Financials as available, Strategic Information, Market Rank/Share, Products and Services, Recent Developments)
- 6.4.1 Akamai Technologies, Inc.
- 6.4.2 Amazon Web Services, Inc.
- 6.4.3 Cloudflare, Inc.
- 6.4.4 Google LLC
- 6.4.5 Microsoft Corporation
- 6.4.6 Fastly, Inc.
- 6.4.7 Edgio, Inc.
- 6.4.8 CDNetworks Co., Ltd.
- 6.4.9 Tencent Cloud Computing (Beijing) Co., Ltd.
- 6.4.10 Alibaba Cloud Computing Ltd.
- 6.4.11 Tata Communications Limited
- 6.4.12 Verizon Communications Inc.
- 6.4.13 AT&T Inc.
- 6.4.14 Deutsche Telekom AG
- 6.4.15 Lumen Technologies, Inc.
- 6.4.16 G-Core Labs S.A.
- 6.4.17 Huawei Technologies Co., Ltd.
- 6.4.18 Broadpeak S.A.S.
- 6.4.19 Qwilt, Inc.
- 6.4.20 BunnyWay d.o.o.
7 MARKET OPPORTUNITIES AND FUTURE OUTLOOK
- 7.1 White-Space and Unmet-Need Assessment