

|
시장보고서
상품코드
2100506
아시아태평양의 스마트 제조 시장 : 시장 점유율 분석, 업계 동향 및 통계, 성장 예측(2026-2031년)Asia Pacific Smart Manufacturing - Market Share Analysis, Industry Trends & Statistics, Growth Forecasts (2026 - 2031) |
||||||
 Mordor Intelligence
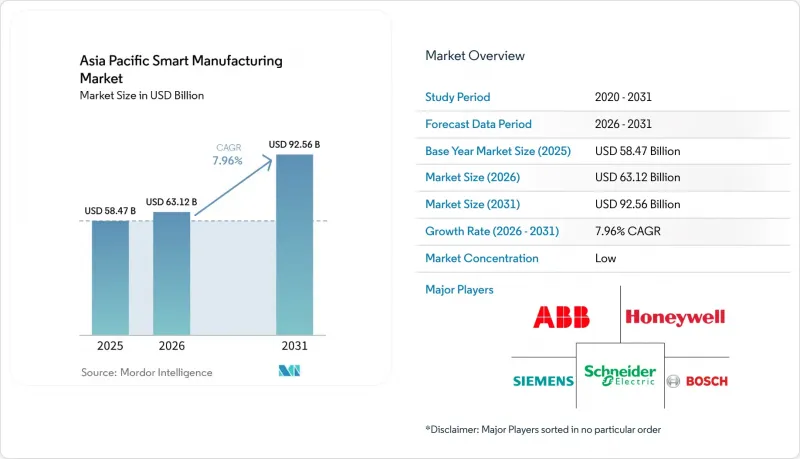
Mordor Intelligence에 의하면, 아시아태평양의 스마트 제조 시장 규모는 2025년에 584억 7,000만 달러로 평가되었고, 2026년 631억 2,000만 달러에서 2031년까지 925억 6,000만 달러에 이를 것으로 예측되며, 예측 기간(2026-2031년) CAGR은 7.96%를 나타낼 전망입니다.
본 보고서는 기반 기술별(산업용 제어 시스템, 산업용 로봇 등), 컴포넌트별(하드웨어, 소프트웨어 등), 도입 형태별(온프레미스, 클라우드 등), 최종 사용자 산업별(자동차, 반도체 및 전자 등), 기업 규모별(중소기업 등) 및 지역별로 분류되어 있습니다. 시장 전망은 금액(달러) 기준으로 제시되어 있습니다.
아시아태평양의 스마트 제조 시장 동향 및 인사이트
정부 주도의 디지털 전환 지원책
말레이시아의 'Industry4WRD' 기금, 싱가포르의 '디지털 전환 지원 파일럿 프로그램', 일본의 '아시아 디지털 전환' 이니셔티브, 그리고 인도의 ‘SAMARTH Udyog Bharat 4.0’은 아시아태평양의 디지털 전환 노력을 가속화하기 위해 설비, 교육, 그리고 국경을 초월한 연구 개발(R&D) 협력에 대해 전반적으로 보조금을 지원하고 있습니다. 말레이시아의 매칭 보조금 제도를 통해 이미 299개 중소기업에 1억 920만 링깃이 지급되어, 자동화 도입 장벽이 낮아졌습니다. 싱가포르에서는 9개월 이내에 도입 가능한 사전 승인된 솔루션에 대해 중소기업 1곳당 5만 홍콩 달러를 지급하고 있습니다. 일본 경제산업성(METI)은 일본의 시스템 통합사업자와 동남아시아 제조업체를 연결하여 이용 사례를 공동 개발하는 협력 프로젝트를 지원하고 있습니다. 인도의 실증 센터에서는 9,800명을 교육하고, 자원이 제한된 공장에 적합한 플러그 앤 플레이 키트를 검증했습니다. 이러한 정책들은 종합적으로 투자 위험을 경감하고, 학습 곡선을 단축하며, 규모 확대까지 걸리는 시간을 단축함으로써 아시아태평양의 스마트 제조 시장을 지속적인 두 자릿수 성장으로 이끌고 있습니다.
인건비 급등과 숙련공 부족
중국 제조업의 평균 임금은 2015-2024년 2배 이상 상승하여 기존의 비용 우위가 사라졌고, 기업들은 무인 생산 라인으로의 전환을 강요받고 있습니다. 일본에서는 정밀 가공 분야의 노동력이 20년 동안 약 10만 명 감소함에 따라, 프로그래밍 시간을 수 시간에서 수 분으로 단축하는 AI 탑재 CAM 소프트웨어 개발이 촉진되고 있습니다. 싱가포르에서는 노동력 부족이 심화되고 있어, 현지 2,700개 정밀 공학 기업은 가동률을 유지하기 위해 협동 로봇과 인간 작업자를 병행하여 사용할 수밖에 없는 상황입니다. 시스코 네트워킹 아카데미는 이미 2,000만 명의 학습자를 양성해 왔으며, 자동화 프로젝트의 걸림돌이 되고 있는 디지털 기술 격차 해소에 기여하고 있습니다. 따라서 인건비 급등과 인구 통계학적 압박이 맞물리면서, 아시아태평양의 스마트 제조 시장 전반에서 설비 투자가 인력에서 스마트 기기로 재분배되는 움직임이 가속화되고 있습니다.
고액의 초기 설비 투자와 ROI의 불확실성
본격적인 스마트 팩토리 전환에는 중규모 사업장 1곳당 200만-500만 달러가 필요한 경우가 많으며, 이는 가족 경영 공방이나 수탁 조립 업체에게 장벽이 되고 있습니다. 텔스트라(Telstra)의 조사에 따르면, 응답자의 67%가 비용에 대한 우려로 인해 IoT 프로젝트를 연기하고 있다고 답했습니다. 이점은 에너지, 품질, 물류 등 다양한 분야에 걸쳐 발생하기 때문에 단일 지표로 ROI를 승인하기는 어렵습니다. 하네웰의 데이터에 따르면, 경영진의 45%는 재무 모델로는 가동 중단 시간 감축에 따른 기여도를 개별적으로 산출할 수 없기 때문에 예측 유지보수 도입을 미루고 있습니다. 정부 보조금은 총 예산의 극히 일부만을 충당할 수 있을 뿐이며, 많은 프로그램에서 엄격한 자격 기준이 설정되어 있어 중소기업은 자금을 자체 자금으로 조달할 수밖에 없으며, 투자 회수에는 3년에서 5년이 소요될 수 있습니다. 자금 조달 모델이 성숙해지기 전까지는 이러한 제약으로 인해 아시아태평양의 스마트 제조 시장의 단기적인 성장이 둔화될 것입니다.
부문 분석
2025년, 산업용 제어 시스템은 아시아태평양 스마트 제조 시장 점유율의 40.62%를 차지했으며, 수천 개에 달하는 이산형 및 공정형 플랜트의 실시간 핵심으로서 그 역할을 두드러지게 하고 있습니다. PLC와 SCADA는 가혹한 현장 환경에서도 결정론적 작동을 보장하기 때문에 여전히 조달의 주류를 이루고 있습니다. 그러나 제조업체들은 OEE(종합 설비 효율), 에너지, 품질의 KPI를 통합하는 클라우드 대시보드를 이러한 제어 시스템에 중첩하여 도입하는 경향이 강해지고 있습니다. 그 결과, 아시아태평양의 스마트 제조 시장에서는 엣지 게이트웨이가 암호화된 데이터를 AI 엔진으로 스트리밍하여, 경보가 작동하기 훨씬 전에 이상을 감지하는 하이브리드 아키텍처가 보급되고 있습니다.
기업들이 고립된 히스토리안에서 예기치 못한 가동 중단 시간을 최대 20%까지 줄여주는 예측 유지보수 모델로 전환함에 따라, 클라우드, 애널리틱스, 플랫폼 시장은 연평균 성장률(CAGR) 9.76%로 성장하고 있습니다. 한때 단일 카메라를 통한 검사에 국한되었던 머신 비전 시스템도 현재는 딥러닝 라이브러리를 통합하여 반도체 분야의 서브미크론 수준 결함을 감지할 수 있게 되었습니다. 산업용 로봇의 도입은 자동차 도장 라인에 그치지 않고 의료기기 등 소량 다품종 생산 분야로 확대되고 있습니다. 타임 센시티브 네트워킹에서 Wi-Fi 6E에 이르는 연결 스택이 이러한 지능 계층을 뒷받침하고 있습니다. 제어, 분석, 사이버 보안을 구독 플랜으로 패키지화한 벤더들은 아시아태평양의 스마트 제조 시장에서 대상 예산 규모를 확대되고 있습니다.
2025년 아시아태평양 스마트 제조 시장 규모 중 하드웨어가 53.78%를 차지했으며, 이는 반복 작업을 자동화하는 로봇, 센서, 컨트롤러에 대한 수요를 반영합니다. 그럼에도 불구하고 기존 공장(브라운필드)에서는 자체 도입보다 턴키 방식의 업그레이드가 요구되기 때문에 서비스 부문은 연평균 성장률(CAGR) 10.91%라는 빠른 속도로 확대되고 있습니다. 시스템 통합사업자들은 현재 컨설팅, 시운전, 관리형 보안 운영을 다년 계약에 묶어 제공하고 있으며, 이로 인해 지출이 자본 지출(CAPEX)에서 운영 비용(OPEX)으로 전환되고 있습니다.
소프트웨어의 중요성은 계속해서 높아지고 있습니다. 이는 협동 로봇을 위한 적응형 경로 계획과 같은 알고리즘을 통한 차별화가, 하드웨어의 미세 조정만으로는 불가능한 생산성 향상을 가져오기 때문입니다. 엣지부터 클라우드에 이르는 서비스 계약을 통해 중소기업은 전체 스택을 소유하지 않고도 기능을 시범 도입할 수 있게 되었으며, 아시아태평양의 스마트 제조 시장 전반에서 보급이 가속화되고 있습니다. 소프트웨어 및 서비스의 경계가 모호해지고 있기 때문에 벤더는 갱신율을 높게 유지하기 위해 단순한 버전 업그레이드뿐만 아니라 지속적인 개선 로드맵을 유지해야 합니다.
기타 혜택 :
- 엑셀 형식 시장 예측(ME) 시트
- 3개월간의 애널리스트 지원
자주 묻는 질문
목차
제1장 서론
제2장 조사 방법
제3장 주요 요약
제4장 시장 구도
제5장 시장 규모 및 성장 예측
제6장 경쟁 구도
제7장 시장 기회 및 향후 전망
AJY 26.08.07According to Mordor Intelligence, the Asia-Pacific smart manufacturing market size was valued at USD 58.47 billion in 2025 and estimated to grow from USD 63.12 billion in 2026 to reach USD 92.56 billion by 2031, at a CAGR of 7.96% during the forecast period (2026-2031).
This report is Segmented by Enabling Technology (Industrial Control Systems, Industrial Robotics, and More), Component (Hardware, Software, and More), Deployment Mode (On-Premise, Cloud, and More), End-User Industry (Automotive, Semiconductor and Electronics, and More), Enterprise Size (Small Enterprises, and More), and Geography. The Market Forecasts are Provided in Terms of Value (USD).
Asia Pacific Smart Manufacturing Market Trends and Insights
Government-backed digital transformation incentives
Malaysia's Industry4WRD fund, Singapore's Digital Transformation Support Pilot Programme, Japan's Asia Digital Transformation initiative, and India's SAMARTH Udyog Bharat 4.0 collectively subsidize equipment, training, and cross-border R&D collaborations to accelerate Asia Pacific Digital Transformation initiatives. Matching grants in Malaysia have already disbursed RM 109.2 million to 299 SMEs, lowering automation entry barriers. Singapore offers HKD 50,000 per SME for pre-approved solutions that can be installed within nine months. METI sponsors joint projects that link Japanese system integrators with Southeast Asian manufacturers to co-develop use cases. India's demonstration centers have trained 9,800 individuals and validated plug-and-play kits suitable for resource-constrained factories. Collectively, these policies de-risk investments, compress learning curves, and shorten time to scale, driving the Asia-Pacific smart manufacturing market toward sustained double-digit expansion.
Labor cost inflation and skill shortages
Average Chinese manufacturing wages more than doubled between 2015 and 2024, eroding the historical cost advantage and pushing firms toward lights-out production lines. Japan's precision-machining workforce shrank by roughly 100,000 over two decades, spurring AI-enabled CAM software that slashes programming time from hours to minutes. Singapore's tight labour pool forces its 2,700 precision-engineering firms to blend collaborative robots with human operators to keep uptime high. Cisco Networking Academy has already trained 20 million learners, helping bridge digital-skills gaps that slow automation projects. Rising personnel costs, coupled with demographic pressures, are therefore accelerating capex reallocation from headcount to smart equipment across the Asia-Pacific smart manufacturing market.
High upfront CAPEX and ROI uncertainty
Full-scale smart factory conversions often require USD 2-5 million per mid-sized site, deterring family-owned workshops and contract assemblers. Telstra surveys found 67% of respondents delay IoT projects due to cost concerns. Benefits accrue across energy, quality, and logistics, making single-metric ROI approvals challenging. Honeywell data show 45% of executives postpone predictive-maintenance rollouts because financial models cannot isolate the contribution of downtime reduction. Government grants offset only a fraction of total budgets, and many programs apply strict eligibility filters, leaving smaller firms to self-fund investments that may take three to five years to break even. Until financing models mature, this restraint will shave near-term growth off the Asia-Pacific smart manufacturing market.
Other drivers and restraints analyzed in the detailed report include:
- Post-COVID reshoring and supply-chain resilience
- Rapid 5G private-network rollouts in factories
- Cybersecurity vulnerabilities in OT-IT convergence
For complete list of drivers and restraints, kindly check the Table Of Contents.
Segment Analysis
Industrial control systems generated 40.62 % of the Asia-Pacific smart manufacturing market share in 2025, underscoring their role as the real-time backbone for thousands of discrete and process plants. PLCs and SCADA remain procurement mainstays because they guarantee deterministic operation under harsh shop-floor conditions. Manufacturers, however, increasingly overlay these controls with cloud dashboards that unify OEE, energy, and quality KPIs. The Asia-Pacific smart manufacturing market is consequently witnessing hybrid architectures where edge gateways stream encrypted data to AI engines that detect anomalies well before alarms fire.
Cloud, analytics and platforms are growing at a 9.76 % CAGR as firms migrate from isolated historians to predictive-maintenance models that cut unplanned downtime by up to 20 %. Machine-vision systems, once limited to single-camera checks, now integrate deep-learning libraries that flag sub-micron defects in semiconductors. Industrial robotics adoption is moving beyond automotive paint lines into low-volume high-mix sectors such as medical devices. Connectivity stacks ranging from Time-Sensitive Networking to Wi-Fi 6E sustain these intelligence layers. Vendors that package controls, analytics, and cybersecurity into subscription tiers are broadening addressable budgets within the Asia-Pacific smart manufacturing market.
Hardware accounted for 53.78 % of the Asia-Pacific smart manufacturing market size in 2025, reflecting demand for robots, sensors, and controllers that automate repetitive tasks. Nevertheless, services are scaling faster at 10.91 % CAGR as brownfield plants seek turnkey upgrades rather than do-it-yourself rollouts. System integrators now bundle consulting, commissioning, and managed-security operations in multiyear contracts that shift spending from capex to opex.
Software stakes continue rising because algorithmic differentiation such as adaptive path planning for collaborative robots delivers productivity boosts impossible with hardware tweaks alone. Edge-to-cloud service engagements let SMEs pilot features without owning entire stacks, accelerating democratization across the Asia-Pacific smart manufacturing market. The blurring line between software and services means vendors must maintain continuous improvement roadmaps, not just versioned releases, to keep renewal rates high.
Complete Report Scope:
- By Enabling Technology
- Industrial Control Systems
- Programmable Logic Controller (PLC)
- Supervisory Control and Data Acquisition (SCADA)
- Distributed Control System (DCS)
- Human Machine Interface (HMI)
- Manufacturing Execution System (MES)
- Product Lifecycle Management (PLM)
- Industrial Robotics
- Machine Vision Systems
- Cloud, Analytics and Platforms
- Cybersecurity
- Sensors and Transmitters
- Connectivity and Communication
- Other Field, Control and Safety Solutions
- Industrial Control Systems
- By Component
- Hardware
- Software
- Services
- By Deployment Mode
- On-premise
- Cloud
- Hybrid
- Edge-to-Cloud
- By End-user Industry
- Automotive
- Semiconductor and Electronics
- Oil and Gas
- Chemical and Petrochemical
- Pharmaceutical and Biotechnology
- Aerospace and Defense
- Food and Beverages
- Metals and Mining
- Logistics and Warehousing
- Other End-User Industries
- By Enterprise Size
- Small Enterprises
- Medium Enterprises
- Large Enterprises
- By Country
- China
- India
- Japan
- South Korea
- Taiwan
- Singapore
- Thailand
- Vietnam
- Australia
- Rest of Asia-Pacific
List of Companies Covered in this Report:
- ABB Ltd.
- Honeywell International Inc.
- Fanuc Corporation
- Mitsubishi Electric Corporation
- Emerson Electric Company
- Rockwell Automation Inc.
- Schneider Electric SE
- Robert Bosch GmbH
- Siemens AG
- Yokogawa Electric Corporation
- Cisco Systems Inc.
- Keyence Corporation
- Delta Electronics Inc.
- Omron Corporation
- Panasonic Corporation
- Advantech Co., Ltd.
- Fuji Electric Co., Ltd.
- Beckhoff Automation GmbH and Co. KG
- Huawei Technologies Co., Ltd.
- Hitachi, Ltd.
Additional Benefits:
- The market estimate (ME) sheet in Excel format
- 3 months of analyst support
TABLE OF CONTENTS
1 INTRODUCTION
- 1.1 Study Assumptions and Market Definition
- 1.2 Scope of the Study
2 RESEARCH METHODOLOGY
3 EXECUTIVE SUMMARY
4 MARKET LANDSCAPE
- 4.1 Market Overview
- 4.2 Market Drivers
- 4.2.1 Government-backed digital transformation incentives
- 4.2.2 Labor cost inflation and skill shortages
- 4.2.3 Post-COVID reshoring and supply-chain resilience
- 4.2.4 Rapid 5G private-network rollouts in factories
- 4.2.5 Semiconductor capacity race driving automation
- 4.2.6 Carbon-neutrality mandates pushing energy-efficient operations
- 4.3 Market Restraints
- 4.3.1 High upfront CAPEX and ROI uncertainty
- 4.3.2 Fragmented vendor ecosystem and integration complexity
- 4.3.3 Cybersecurity vulnerabilities in OT-IT convergence
- 4.3.4 Legacy equipment interoperability gaps
- 4.4 Industry Value-Chain Analysis
- 4.5 Regulatory Landscape
- 4.6 Technological Outlook
- 4.7 Impact of Macroeconomic Factors
- 4.8 Porter's Five Forces Analysis
- 4.8.1 Threat of New Entrants
- 4.8.2 Bargaining Power of Suppliers
- 4.8.3 Bargaining Power of Consumers
- 4.8.4 Threat of Substitute Products
- 4.8.5 Intensity of Competitive Rivalry
5 MARKET SIZE AND GROWTH FORECASTS (VALUE)
- 5.1 By Enabling Technology
- 5.1.1 Industrial Control Systems
- 5.1.1.1 Programmable Logic Controller (PLC)
- 5.1.1.2 Supervisory Control and Data Acquisition (SCADA)
- 5.1.1.3 Distributed Control System (DCS)
- 5.1.1.4 Human Machine Interface (HMI)
- 5.1.1.5 Manufacturing Execution System (MES)
- 5.1.1.6 Product Lifecycle Management (PLM)
- 5.1.2 Industrial Robotics
- 5.1.3 Machine Vision Systems
- 5.1.4 Cloud, Analytics and Platforms
- 5.1.5 Cybersecurity
- 5.1.6 Sensors and Transmitters
- 5.1.7 Connectivity and Communication
- 5.1.8 Other Field, Control and Safety Solutions
- 5.1.1 Industrial Control Systems
- 5.2 By Component
- 5.2.1 Hardware
- 5.2.2 Software
- 5.2.3 Services
- 5.3 By Deployment Mode
- 5.3.1 On-premise
- 5.3.2 Cloud
- 5.3.3 Hybrid
- 5.3.4 Edge-to-Cloud
- 5.4 By End-user Industry
- 5.4.1 Automotive
- 5.4.2 Semiconductor and Electronics
- 5.4.3 Oil and Gas
- 5.4.4 Chemical and Petrochemical
- 5.4.5 Pharmaceutical and Biotechnology
- 5.4.6 Aerospace and Defense
- 5.4.7 Food and Beverages
- 5.4.8 Metals and Mining
- 5.4.9 Logistics and Warehousing
- 5.4.10 Other End-User Industries
- 5.5 By Enterprise Size
- 5.5.1 Small Enterprises
- 5.5.2 Medium Enterprises
- 5.5.3 Large Enterprises
- 5.6 By Country
- 5.6.1 China
- 5.6.2 India
- 5.6.3 Japan
- 5.6.4 South Korea
- 5.6.5 Taiwan
- 5.6.6 Singapore
- 5.6.7 Thailand
- 5.6.8 Vietnam
- 5.6.9 Australia
- 5.6.10 Rest of Asia-Pacific
6 COMPETITIVE LANDSCAPE
- 6.1 Market Concentration
- 6.2 Strategic Moves
- 6.3 Market Share Analysis
- 6.4 Company Profiles (includes Global level Overview, Market level overview, Core Segments, Financials as available, Strategic Information, Market Rank/Share for key companies, Products and Services, and Recent Developments)
- 6.4.1 ABB Ltd.
- 6.4.2 Honeywell International Inc.
- 6.4.3 Fanuc Corporation
- 6.4.4 Mitsubishi Electric Corporation
- 6.4.5 Emerson Electric Company
- 6.4.6 Rockwell Automation Inc.
- 6.4.7 Schneider Electric SE
- 6.4.8 Robert Bosch GmbH
- 6.4.9 Siemens AG
- 6.4.10 Yokogawa Electric Corporation
- 6.4.11 Cisco Systems Inc.
- 6.4.12 Keyence Corporation
- 6.4.13 Delta Electronics Inc.
- 6.4.14 Omron Corporation
- 6.4.15 Panasonic Corporation
- 6.4.16 Advantech Co., Ltd.
- 6.4.17 Fuji Electric Co., Ltd.
- 6.4.18 Beckhoff Automation GmbH and Co. KG
- 6.4.19 Huawei Technologies Co., Ltd.
- 6.4.20 Hitachi, Ltd.
7 MARKET OPPORTUNITIES AND FUTURE OUTLOOK
- 7.1 White-space and Unmet-need Assessment


