

|
시장보고서
상품코드
2113191
베트남의 전력 EPC : 시장 점유율 분석, 업계 동향과 통계, 성장 예측(2026-2031년)Vietnam Power EPC - Market Share Analysis, Industry Trends & Statistics, Growth Forecasts (2026 - 2031) |
||||||
 Mordor Intelligence
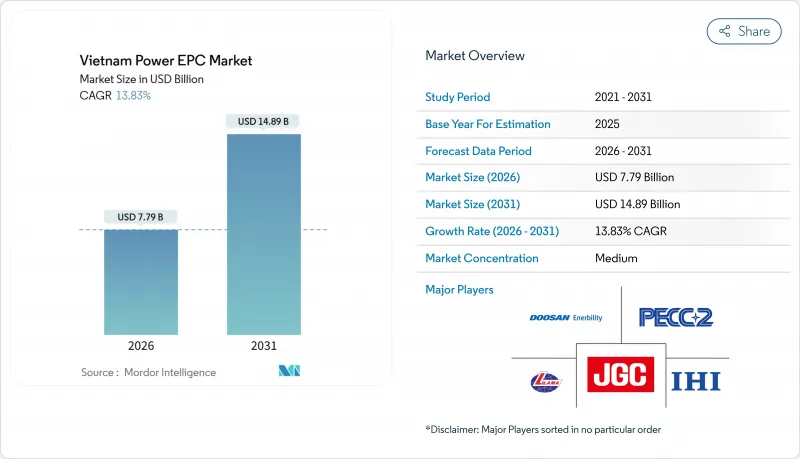
Mordor Intelligence에 의하면, 베트남의 전력 EPC 시장 규모는 2026년에 77억 9,000만 달러로 추정며, 예측 기간(2026-2031년)에 CAGR 13.83%로 확대되어 2031년에는 148억 9,000만 달러에 이를 전망입니다.
본 보고서는 발전 EPC(기술(화력, 원자력, 재생에너지), 용량대(100MW 이하, 100-499MW, 500MW 이상),및 최종 사용자(규제 대상 전력 사업자, 독립 발전 사업자, 산업용 자가 발전, 공공 부문 및 국영 기업)), 그리고 송배전(T&D) EPC로 분류되어 있습니다. 시장 규모 및 전망은 금액(달러) 기준으로 제시되어 있습니다.
베트남의 전력 EPC 시장 동향 및 인사이트
산업용 및 주거용 전력 수요의 급속한 증가
베트남의 전력 소비량은 2024년 257 TWh에서 2025년에는 280 TWh로 증가했습니다. 북부 여러 성에서 새로운 제조 공장 및 데이터센터가 가동을 시작한 데 따라, 증가분 수요의 58%를 산업용 사용자가 차지했습니다. 하노이와 호치민시의 에어컨 보급률이 70%를 넘어섰고, 전기 이륜차로 인한 야간 피크 시간대 충전 부하가 1.2 GW에 달함에 따라 주거용 수요는 6.2% 확대되었습니다. 수요의 지속적인 증가로 인해,전력 회사와 독립 발전 사업자(IPP)는 베이스로드 발전 설비의 증설을 서둘러야 하는 상황에 놓여 있지만, 송전망의 제약으로 인해 산업 단지는 자가 발전으로 전환하고 있으며, 이로 인해 베트남의 전력 EPC 시장은 유틸리티 규모 부문과 계량기 후방 부문으로 분할되어 있습니다. 박닌 및 하이퐁의 수출가공구에서는 2025년에 47건의 예기치 못한 정전이 발생함에 따라, 다국적 기업들은 임대 계약에 부지 내 예비 발전 용량 확보를 명시하기 시작했습니다. 정부는 2027년까지 모든 농촌 가구에 전력 공급을 실현할 계획이며, 이에 따라 3.5GW 규모의 배전망 업그레이드가 이루어져 저전압 설비를 위한 보조적인 EPC 수요가 창출될 것입니다.
개정판 ‘전력 개발 계획(PDP) 8’: 발전·송배전 설비에 대한 설비 투자 계획 확대
2024년에 승인된 ‘제8차 전력개발계획(PDP 8)’ 최종판에서는 2030년 설비 용량 목표가 초안보다 30 GW 증가한 150 GW로 상향 조정되었으며,중남부 연안에서 홍하 삼각주로 해상 풍력발전을 송전하는 500 kV 송전선에 180억 달러가 배정되었습니다. 이 정책에 따라 2030년까지 8.6GW 규모의 아임계 석탄 화력 발전소를 폐쇄하고 15GW 규모의 LNG 목표를 설정함에 따라, 보다 청정한 화력 자산에 대한 EPC 수요는 두 자릿수 성장세를 유지할 전망입니다. 해상 풍력 할당량은 6GW에서 10GW로 증가했는데, 이는 송전망 비용이 사회화되면 얕은 해역에서의 균등화 발전 비용이 낮아진다는 점을 반영한 것입니다. 새로운 ‘그리드 퍼스트(Grid First)’ 규칙에 따라, EVN이 변전소의 가용성을 확인할 때까지 발전 프로젝트는 금융 마감을 완료할 수 없게 되며, 이로 인해 송배전(T&D) EPC 계약이 앞당겨지고 발전 프로젝트 일정이 장기화될 것입니다. 2025년에 체결된 아시아개발은행(ADB)의 25억 달러 규모 양허성 대출 패키지 덕분에 500 kV 프로젝트의 가중평균자본비용은 7.2%로 낮아져, 시공사들은 보다 적극적으로 입찰에 참여할 수 있게 되었습니다.
송전망 혼잡과 출력 억제 위험이 프로젝트의 IRR을 끌어올리고 있다.
2025년 상반기, 남부 각 성의 태양광 및 풍력 발전 출력 억제율은 평균 18%에 달했으며, 500 kV 송전선이 정격 용량을 초과하여 가동된 결과 1,240 GWh의 발전량이 손실되었습니다. 투안남-푸옥롱 송전선 개보수 공사의 지연으로 인해 사업자는 87일 동안 2.1 GW의 태양광 발전을 제한할 수밖에 없었으며, 이로 인해 발전 사업자의 수익에서 3,100만 달러가 손실되었습니다. 개발 사업자는 현재 PPA 가격 책정 시 12-15%의 출력 억제를 가정하고 있으며, 이로 인해 LCOE가 MWh당 6-8달러 상승하여 자기자본 IRR이 지역 벤치마크를 밑도는 상황이 되었습니다. 여유 용량이 있는 변전소 주변 토지는 혼잡 지역에 위치한 구획에 비해 40-60% 높은 가격에 거래되고 있어, 이로 인해 개발 파이프라인이 소규모 프로젝트로 분할되고 있습니다. EVN이 계획 중인 62억 달러 규모의 남부 송전망 계획은 2028년부터 2029년까지 혼잡을 해소하지 못할 것으로 예상되므로, 그 기간 동안 연간 EPC 수주액은 제한될 전망입니다.
부문별 분석
2025년, 베트남 발전 EPC 시장 점유율의 68.5%를 재생에너지가 차지하고 있으며, 총액 136억 달러에 달하는 3.5GW 규모의 라간(La Gan) 및 2.1GW 규모의 하이롱(Hai Long) 블록을 필두로, 해상 풍력 발전이 조사 단계에서 실행 단계로 전환됨에 따라 2031년까지 연평균 성장률(CAGR) 15.3%를 기록할 전망입니다. 화력 발전(주로 LNG 연소 CCGT)은 나머지 31.5%를 차지하고 있지만, 논차크 3호 및 4호에서 64%의 효율을 발휘하는 9HA.02 터빈 덕분에 여전히 베이스로드의 핵심 역할을 하고 있습니다.
해상 풍력 발전의 설계상 복잡성, 수심 25-40미터의 모노파일 기초,및 80-120킬로미터에 이르는 220kV 해저 송전선 등으로 인해 EPC 비용은 1kW당 3,200-3,800달러에 머물러 있으며, 이는 1kW당 650-750달러인 유틸리티 규모의 태양광 발전 비용을 훨씬 상회합니다. 금융 기관들이 석탄 사업에서 철수함에 따라 화력 발전의 EPC 점유율은 감소하고 있습니다. 2024년부터 2025년에 걸쳐 전 세계 17개 은행이 석탄 배제 정책을 채택함에 따라, 600 MW 규모의 콴 트랙 I 발전소 개보수 계획에서는 설계 도중 석탄에서 LNG로 전환할 수밖에 없었습니다. 그러나 PDP 8에서는 송전망의 안정성을 확보하기 위해 2030년까지 재생에너지 도입률을 47%로 제한하고 있어, 이로 인해 2031년까지 화력 발전 EPC가 베트남 발전 EPC 시장 가치의 최소 4분의 1을 계속 차지할 것으로 확실시되고 있습니다.
기타 혜택:
- 엑셀 형식 시장 예측(ME) 시트
- 3개월간 애널리스트 지원
자주 묻는 질문
목차
제1장 서론
제2장 조사 방법
제3장 주요 요약
제4장 시장 구도
제5장 시장 규모와 성장 예측
제6장 경쟁 구도
제7장 시장 기회와 향후 전망
LSH 26.08.24According to Mordor Intelligence, the Vietnam power EPC market size is estimated at USD 7.79 billion in 2026, and is expected to reach USD 14.89 billion by 2031, at a CAGR of 13.83% during the forecast period (2026-2031).
This report is Segmented by Power Generation EPC [Technology (Thermal, Nuclear, and Renewables), Capacity Band (Up To 100 MW, 100 To 499 MW, and Above 500 MW), and End-User (Regulated Utilities, Independent Power Producers, Industrial Captive Power, and Public Sector and SOE)], and Power Transmission and Distribution (T&D) EPC. The Market Sizes and Forecasts are Provided in Terms of Value (USD).
Vietnam Power EPC Market Trends and Insights
Rapid Industrial & Residential Load Growth
Vietnam's electricity consumption climbed to 280 TWh in 2025, up from 257 TWh in 2024, with industrial users supplying 58% of incremental demand as new fabrication plants and data centers came online in northern provinces. Residential demand expanded 6.2% on air-conditioning penetration topping 70% in Hanoi and Ho Chi Minh City, and on 1.2 GW of evening-peak charging load from electric two-wheelers. Sustained load growth forces utilities and IPPs to fast-track baseload additions, yet transmission constraints push industrial parks toward captive generation, fragmenting the Vietnam power EPC market into utility-scale and behind-the-meter segments. Export-processing zones in Bac Ninh and Hai Phong logged 47 unplanned outages in 2025, prompting multinationals to stipulate on-site backup capacity in lease contracts. The government plans to electrify all rural households by 2027, adding 3.5 GW of distribution upgrades, creating auxiliary EPC demand for low-voltage equipment.
Revised PDP 8 Upsizing Generation & Grid CAPEX Pipeline
The final Power Development Plan 8, approved in 2024, lifts the 2030 installed-capacity target to 150 GW, 30 GW more than the draft, and earmarks USD 18 billion for 500 kV corridors that will move offshore wind from the south-central coast to the Red River Delta. The policy retires 8.6 GW of subcritical coal by 2030 and sets a 15 GW LNG target, sustaining a double-digit EPC trajectory for cleaner thermal assets. Offshore wind allocation climbs from 6 GW to 10 GW, reflecting lower levelized costs in shallow-water sites once grid costs are socialized. A new "grid-first" rule means generation projects cannot reach financial close until EVN confirms substation availability, front-loading T&D EPC awards, and lengthening generation timelines. An Asian Development Bank USD 2.5 billion concessional loan package, signed in 2025, lowers weighted-average capital costs for 500 kV projects to 7.2%, allowing contractors to bid more aggressively.
Grid Congestion & Curtailment Risk Inflating Project IRRs
Solar and wind curtailment averaged 18% in southern provinces during H1 2025, equal to 1,240 GWh of lost output as 500 kV lines operated above rated capacity. Delays to the Thuan Nam-Phuoc Long upgrade forced operators to trim 2.1 GW of solar on 87 days, wiping USD 31 million from generator revenues. Developers now model 12-15% curtailment when pricing PPAs, pushing LCOE up USD 6-8 per MWh and squeezing equity IRRs below regional benchmarks. Land near spare-capacity substations trades 40-60% higher than parcels in congested zones, fragmenting the pipeline into smaller deals. EVN's USD 6.2 billion southern transmission plan will not relieve congestion until 2028-2029, suppressing annual EPC awards in the interim.
Other drivers and restraints analyzed in the detailed report include:
- Surge in LNG-to-Power Projects Unlocking Gas EPC Backlog
- DPPA Framework Catalyzing C&I Renewable Build-Outs
- Retroactive FIT Revisions Eroding Investor Confidence
For complete list of drivers and restraints, kindly check the Table Of Contents.
Segment Analysis
Renewables commanded 68.5% of Vietnam's power generation EPC market share in 2025 and are set to expand at a 15.3% CAGR through 2031 as offshore wind shifts from study to execution, led by the 3.5 GW La Gan and 2.1 GW Hai Long blocks valued at USD 13.6 billion. Thermal capacity, primarily LNG-fired CCGT, occupied the remaining 31.5% but still anchors baseload with 9HA.02 turbines delivering 64% efficiency at Nhon Trach 3 & 4.
Offshore wind's engineering complexity, monopile foundations in 25-40 meter depths, and 220 kV subsea links of 80-120 kilometers, keep EPC costs at USD 3,200-3,800 per kW, far above utility-scale solar at USD 650-750 per kW. Thermal EPC share slips as financiers exit coal; 17 global banks adopted coal-exclusion policies during 2024-2025, forcing the 600 MW Quang Trach I upgrade to convert from coal to LNG mid-design. Still, PDP 8 caps renewable penetration at 47% by 2030 for grid stability, ensuring thermal EPC holds at least one-quarter of Vietnam's power generation EPC market value through 2031.
Complete Report Scope:
- Power Generation EPC
- By Technology
- Thermal
- Nuclear
- Renewables
- By Capacity Band
- Up to 100 MW (DER, micro-grid)
- 100 to 499 MW
- Above 500 MW
- By End-User
- Regulated Utilities
- Independent Power Producers
- Industrial Captive Power
- Public Sector and SOE
- By Technology
- Power Transmission and Distribution (T&D) EPC
List of Companies Covered in this Report:
- JGC Vietnam Co. Ltd.
- IHI Infrastructure Systems Co. Ltd.
- Lilama Corporation
- Doosan Enerbility Co. Ltd.
- Toshiba Corporation
- AES Corporation
- CTCI Corporation
- PALMA Group Vietnam
- Power Engineering Consulting JSC 2 (PECC2)
- Vietnam Electricity Construction JSC (VNECO)
- Siemens Energy AG
- GE Vernova
- PetroVietnam Power Corporation (PV Power)
- PetroVietnam Gas JSC (PV Gas)
- Samsung C&T Corp.
- Vestas Wind Systems A/S
- PC1 Group JSC
- Mitsubishi Power Ltd.
- Orsted A/S
- Copenhagen Infrastructure Partners
Additional Benefits:
- The market estimate (ME) sheet in Excel format
- 3 months of analyst support
TABLE OF CONTENTS
1 Introduction
- 1.1 Study Assumptions & Market Definition
- 1.2 Scope of the Study
2 Research Methodology
3 Executive Summary
4 Market Landscape
- 4.1 Market Overview
- 4.2 Market Drivers
- 4.2.1 Rapid industrial & residential load growth
- 4.2.2 Revised PDP 8 upsizing generation & grid CAPEX pipeline
- 4.2.3 Surge in LNG-to-power projects unlocking gas EPC backlog
- 4.2.4 DPPA framework catalysing C&I renewable build-outs
- 4.2.5 Mandatory storage add-ons (above 10 % / 2 -h) boosting BESS EPC scope
- 4.2.6 Local content incentives for wind/solar equipment & EPC services
- 4.3 Market Restraints
- 4.3.1 Grid congestion & curtailment risk inflating project IRRs
- 4.3.2 Retroactive FIT revisions eroding investor confidence
- 4.3.3 Skilled EPC labour shortages for high-voltage & offshore works
- 4.3.4 EVN credit-risk overhang on long-term PPAs
- 4.4 Supply-Chain Analysis
- 4.5 Regulatory Landscape
- 4.6 Technological Outlook
- 4.7 Porter's Five Forces
- 4.7.1 Threat of New Entrants
- 4.7.2 Bargaining Power of Suppliers
- 4.7.3 Bargaining Power of Buyers
- 4.7.4 Threat of Substitutes
- 4.7.5 Competitive Rivalry
- 4.8 PESTLE Analysis
5 Market Size & Growth Forecasts
- 5.1 Power Generation EPC
- 5.1.1 By Technology
- 5.1.1.1 Thermal
- 5.1.1.2 Nuclear
- 5.1.1.3 Renewables
- 5.1.2 By Capacity Band
- 5.1.2.1 Up to 100 MW (DER, micro-grid)
- 5.1.2.2 100 to 499 MW
- 5.1.2.3 Above 500 MW
- 5.1.3 By End-User
- 5.1.3.1 Regulated Utilities
- 5.1.3.2 Independent Power Producers
- 5.1.3.3 Industrial Captive Power
- 5.1.3.4 Public Sector and SOE
- 5.1.1 By Technology
- 5.2 Power Transmission and Distribution (T&D) EPC
6 Competitive Landscape
- 6.1 Market Concentration
- 6.2 Strategic Moves (M&A, Partnerships, PPAs)
- 6.3 Market Share Analysis (Market Rank/Share for key companies)
- 6.4 Company Profiles (includes Global level Overview, Market level overview, Core Segments, Financials as available, Strategic Information, Products & Services, and Recent Developments)
- 6.4.1 JGC Vietnam Co. Ltd.
- 6.4.2 IHI Infrastructure Systems Co. Ltd.
- 6.4.3 Lilama Corporation
- 6.4.4 Doosan Enerbility Co. Ltd.
- 6.4.5 Toshiba Corporation
- 6.4.6 AES Corporation
- 6.4.7 CTCI Corporation
- 6.4.8 PALMA Group Vietnam
- 6.4.9 Power Engineering Consulting JSC 2 (PECC2)
- 6.4.10 Vietnam Electricity Construction JSC (VNECO)
- 6.4.11 Siemens Energy AG
- 6.4.12 GE Vernova
- 6.4.13 PetroVietnam Power Corporation (PV Power)
- 6.4.14 PetroVietnam Gas JSC (PV Gas)
- 6.4.15 Samsung C&T Corp.
- 6.4.16 Vestas Wind Systems A/S
- 6.4.17 PC1 Group JSC
- 6.4.18 Mitsubishi Power Ltd.
- 6.4.19 Orsted A/S
- 6.4.20 Copenhagen Infrastructure Partners
7 Market Opportunities & Future Outlook
- 7.1 White-space & Unmet-Need Assessment


