

|
시장보고서
상품코드
2113659
미국의 전력 EPC : 시장 점유율 분석, 업계 동향 및 통계, 성장 예측(2026-2031년)United States Power EPC - Market Share Analysis, Industry Trends & Statistics, Growth Forecasts (2026 - 2031) |
||||||
 Mordor Intelligence
Mordor Intelligence에 의하면, 미국의 전력 EPC 시장 규모는 2025년 1,065억 3,000만 달러로 평가되었습니다. 2026년 1,101억 4,000만 달러에서 2031년까지 1,267억 6,000만 달러로 확대되고 2026년부터 2031년까지 연평균 복합 성장률(CAGR)은 2.85%를 나타낼 전망입니다.
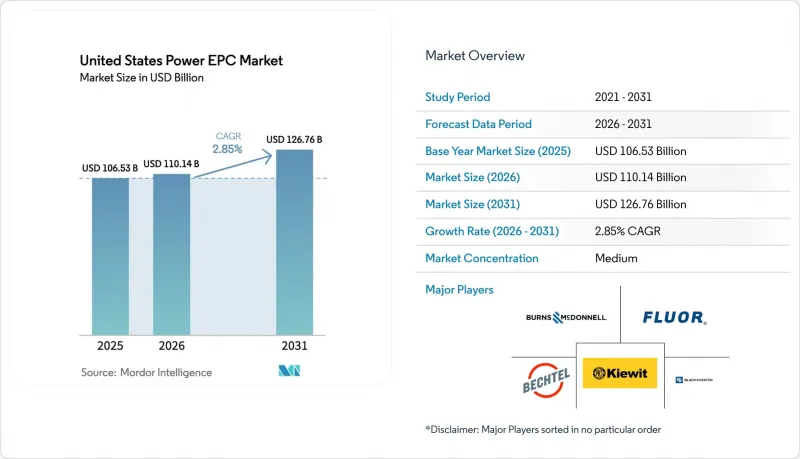
본 보고서는 전력 EPC(기술(화력, 원자력, 재생에너지), 용량대(100 MW 이하, 100-499 MW, 500 MW 이상),및 최종 사용자(규제 대상 유틸리티, 독립발전 사업자, 산업용 자가발전, 공공 부문 및 국영 기업)), 그리고 송배전(T&D) EPC로 분류되어 있습니다. 시장 규모 및 전망은 금액(미 달러) 단위로 표시되어 있습니다.
미국의 전력 EPC 시장 동향과 인사이트
‘인플레이션 억제법’에 따른 청정 에너지 설비 투자(CAPEX)의 급증으로 프로젝트 파이낸싱의 양상이 급변하고 있습니다.
2024년부터 2025년에 걸쳐 발표된 총 890억 달러 규모의 청정 에너지 관련 프로젝트로 인해 조달 주기가 12-15개월로 단축되었으며, 미국의 전력 EPC 시장에서 활동하는 EPC 기업들은 부채 조달 완료 전에 인버터나 변압기를 발주해야 하는 상황에 직면해 있습니다. 상업 운전이라는 마일스톤에 연동된 위약금 보증으로 인해, 일정 리스크는 현재 시공사 대차대조표에 직접적인 부담으로 계상되고 있습니다. 국내 조달 인센티브로 인해 플루어(Fleur)나 키위트(Kiwit)와 같은 공급업체들은 미국산 모듈을 확보하도록 장려받고 있으며, 이로 인해 공급업체 선택의 폭이 좁아지면서 장기 구매 계약을 체결한 기업들이 유리한 입장에 서게 되었습니다. 현장 작업과 공장 생산을 병행하는 모듈식 건설은 최종 단계의 납기 지연을 완화하기 위해 주목받고 있습니다. 이러한 동향으로 인해 가격을 보장하면서 확실한 시공 실적을 보상하는 턴키(turnkey) 방식로의 전환이 전미 전력 EPC 시장에서 더욱 강화되고 있습니다.
수 GW 규모의 데이터센터 및 청정 수소에 의한 수요 증가가 계량기 후단 EPC를 견인
하이퍼스케일 사업자들은 2025년에 15GW를 초과하는 PPA를 체결하고, 전력 회사의 대기 목록에 오르는 것을 피하기 위해 인접한 구역에 200-500MW 규모의 태양광 발전 및 에너지 저장 시스템을 병설하는 사례가 빈번히 나타나고 있습니다. EPC 도급업체는 20년간공급 보증을 포함한 설계·건설·운영(DBO) 패키지형 서비스를 전개하고 있으며, 12-15%의 이익률을 창출하고 있는데, 이는 일반적인 유틸리티 규모 프로젝트의 2배 수준입니다. 그린 수소 프로젝트도 이 모델을 따르고 있으며, 2025년에는 전해조 증설 용량이 2.5GW에 달했습니다. 현재 턴키 계약 범위에는 파워 아일랜드 설계에 더해 압축, 저장, 파이프라인 연결이 패키지로 포함되어 있습니다. 벡텔, 자클리, 맥더모트 등 석유화학 및 재생에너지 두 분야를 모두 아우르는 기업들은 급속히 확대되는 미국의 전력 EPC 시장에서 실행 면에서 우위를 점하고 있습니다.
EPC 인력과 기술 감독자 부족이 이익률을 압박
2020년부터 2025년에 걸쳐 전력 건설 종사자 수가 12% 감소함에 따라, 전기 기술자, 배관공, 운영자의 임금은 연간 8-10% 상승했습니다. 시공사는 임금 리스크를 발주처 측으로 전가하기 위해 비용 상환형 계약으로의 전환을 가속화하고 있지만, 그럼에도 불구하고 이익률은 150-200 베이시스 포인트 축소되었습니다. 번즈 앤 맥도넬(Barnes & McDonnell)사의 캔자스시티에 위치한 200,000 ft² 규모의 공장을 대표로 하는 조립식 시설은 현장 노동 집약도를 25-30% 낮추고, 현장 공사 기간을 12-15개월로 단축하기 때문에모듈화는 미국의 전력 EPC 시장에서의 경쟁력 핵심 요소로 자리 잡고 있습니다.
부문별 분석
2025년에는 재생에너지가 전력 EPC 시장 총 가치의 80.8%를 차지했으며, 이 점유율은 2031년까지 연평균 성장률(CAGR) 5.8%로 확대될 것으로 전망되어, 미국의 전력 EPC 시장 규모에서 가장 큰 비중을 차지하는 기반이 되고 있습니다. IRA(인플레이션 억제법)에 따른 인센티브로 인해 태양광 및 풍력의 LCOE(균등화 발전 원가)는 25-35달러/MWh까지 하락하여 복합 사이클 가스 발전의 수익성을 압박하고 있습니다. 배터리 저장 분야는 2025년에 독립형 BESS가 8GW에 도달하면서 가장 빠르게 성장하는 하위 부문이 되었으며, NFPA 855 준수에 정통한 계약업체에 대한 수요를 창출하고 있습니다. 해상 풍력은 존스법(Jones Act)을 준수하는 선박이 취항하는 2027년 이후에 확대될 전망이지만, 단기적인 수익은 여전히 소규모에 그칠 것입니다. 지열 및 SMR(소형 모듈형 원자로)과 같은 틈새 분야는 다양성을 더해주지만, 2030년까지는 소규모로 남아 있을 것입니다.
화력 발전은 2025년 지출의 15%를 차지했으나, 석탄에서 가스로의 전환이 대체로 완료되었기 때문에 연평균 성장률(CAGR)은 1.2%에 그칠 전망입니다. 한편, 원자력 발전은 4.2%의 점유율을 차지하고 있지만, 그 성장은 주로 소형 모듈형 원자로(SMR)의 실증 및 운전 허가 연장에 의존하고 있습니다. 모듈형 원자력 발전소 건설 및 고온 가스 터빈 개조에 정통한 시공업체들은 부가가치를 창출할 수 있을 것으로 보이지만, 미국 전력 EPC 시장 전체 성장에서 차지하는 비중은 미미할 것으로 보입니다.
기타 혜택 :
- 엑셀 형식 시장 예측(ME) 시트
- 3개월간의 애널리스트 지원
자주 묻는 질문
목차
제1장 서론
제2장 조사 방법
제3장 주요 요약
제4장 시장 구도
제5장 시장 규모 및 성장 예측
제6장 경쟁 구도
제7장 시장 기회 및 향후 전망
KTH 26.08.26According to Mordor Intelligence, the United States power EPC market size is projected to expand from USD 106.53 billion in 2025 and USD 110.14 billion in 2026 to USD 126.76 billion by 2031, registering a CAGR of 2.85% between 2026 to 2031.
This report is Segmented by Power Generation EPC [Technology (Thermal, Nuclear, and Renewables), Capacity Band (Up To 100 MW, 100 To 499 MW, and Above 500 MW), and End-User (Regulated Utilities, Independent Power Producers, Industrial Captive Power, and Public Sector and SOE)], and Power Transmission and Distribution (T&D) EPC. The Market Sizes and Forecasts are Provided in Terms of Value (USD).
United States Power EPC Market Trends and Insights
Inflation Reduction Act-Linked Clean-Energy CAPEX Boom Reshapes Project Finance
A cumulative USD 89 billion in clean-energy announcements during 2024-2025 compressed procurement cycles to 12-15 months, requiring EPC firms active in the US power EPC market to order inverters and transformers before debt close. Liquidated-damages bonds linked to commercial-operation milestones now place schedule risk squarely on contractor balance sheets. Domestic-content bonuses encourage suppliers such as Fluor and Kiewit to lock in U.S.-made modules, narrowing vendor pools and favoring firms with long-term purchase agreements. Modular construction that parallelizes site work with factory fabrication is gaining prominence because it mitigates late-stage delivery slippage. These dynamics reinforce a shift toward lump-sum turnkey structures that guarantee price but reward execution certainty across the US power EPC market.
Multi-GW Data-Center and Green-Hydrogen Load Additions Drive Behind-the-Meter EPC
Hyperscale operators signed more than 15 GW of PPAs in 2025, frequently co-locating 200-500 MW solar-plus-storage systems on adjacent parcels to bypass utility queues. EPC contractors are packaging design-build-operate offerings with 20-year availability guarantees, generating 12-15% margins, double typical utility-scale levels. Green-hydrogen projects mirror this model; electrolyzer additions reached 2.5 GW in 2025, and turnkey scopes now bundle power-island design with compression, storage, and pipeline tie-ins. Firms with combined petrochemical and renewable portfolios, such as Bechtel, Zachry, and McDermott, hold an execution advantage in the rapidly expanding US power EPC market.
Scarcity of EPC Labor and Craft Supervision Compresses Margins
The power-construction workforce shrank 12% between 2020 and 2025, triggering 8-10% annual wage inflation for electricians, pipefitters, and operators. Contractors increasingly pivot to cost-reimbursable structures to pass wage risk to owners, yet margin compression still hits 150-200 basis points. Prefabrication facilities, exemplified by Burns & McDonnell's 200,000 ft2 Kansas City plant, lower field-labor intensity by 25-30% and cut onsite schedules to 12-15 months, making modularization central to competitiveness in the US power EPC market.
Other drivers and restraints analyzed in the detailed report include:
- Replacement Wave for Coal Fleet Over 40 Years Old Accelerates Renewable Conversions
- Utility Decarbonization Mandates Beyond RPS Targets Create Captive Demand
- Supply-Chain Bottlenecks for HV Equipment Extend Project Schedules
For complete list of drivers and restraints, kindly check the Table Of Contents.
Segment Analysis
Renewables captured 80.8% of Power Generation EPC value in 2025, and this share is forecast to widen on a 5.8% CAGR through 2031, underpinning the largest slice of the US power generation EPC market size for generation. IRA incentives lower solar and wind LCOE to USD 25-35/MWh, squeezing combined-cycle gas economics. Battery storage turned into the fastest-growing sub-segment as standalone BESS reached 8 GW in 2025, creating a need for contractors versed in NFPA 855 compliance. Offshore wind will expand after 2027 once Jones Act-compliant vessels enter service, although near-term revenue remains modest. Geothermal and SMR niches add diversity but stay sub-scale before 2030.
Thermal generation accounted for 15% of 2025 spend and will inch forward at only 1.2% CAGR because coal-to-gas switching has largely played out, while nuclear sits at 4.2% share and relies mainly on SMR demonstrations and license extensions. Contractors that master modular nuclear construction and high-temperature gas-turbine retrofits stand to capture incremental value but will contribute a smaller fraction to overall US power generation EPC market share growth.
Complete Report Scope:
- Power Generation EPC
- By Technology
- Thermal
- Nuclear
- Renewables
- By Capacity Band
- Up to 100 MW (DER, micro-grid)
- 100 to 499 MW
- Above 500 MW
- By End-User
- Regulated Utilities
- Independent Power Producers
- Industrial Captive Power
- Public Sector and SOE
- By Technology
- Power Transmission and Distribution (T&D) EPC
List of Companies Covered in this Report:
- Fluor Corporation
- Bechtel Corporation
- Kiewit Corporation
- Black & Veatch Holdings
- Burns & McDonnell
- Jacobs Engineering Group
- AECOM
- Zachry Group
- McDermott International
- Mortenson Construction
- Gemma Power Systems
- JGC Corporation
- Siemens Energy Inc.
- John Wood Group PLC
- Mitsubishi Power Americas
- Worley
- SNC-Lavalin (AtkinsRealis)
- HDR Inc.
- Skanska USA
- IHI Power Services
Additional Benefits:
- The market estimate (ME) sheet in Excel format
- 3 months of analyst support
TABLE OF CONTENTS
1 Introduction
- 1.1 Study Assumptions & Market Definition
- 1.2 Scope of the Study
2 Research Methodology
3 Executive Summary
4 Market Landscape
- 4.1 Market Overview
- 4.2 Installed Capacity Outlook
- 4.3 Primary-Energy Consumption Snapshot
- 4.4 Market Drivers
- 4.4.1 Inflation Reduction Act-linked clean-energy CAPEX boom
- 4.4.2 Multi-GW data-center and green-hydrogen load additions
- 4.4.3 Replacement wave for >40-yr coal fleet
- 4.4.4 Utility decarbonization mandates beyond RPS targets
- 4.4.5 SMR-ready balance-of-plant standardization
- 4.4.6 Green-steel OEM turnkey contracting emergence
- 4.5 Market Restraints
- 4.5.1 Scarcity of EPC labor & craft supervision
- 4.5.2 Supply-chain bottlenecks for HV equipment
- 4.5.3 ERCOT queue curtailments & interconnection delays
- 4.5.4 Surety-bond tightening post-megaproject overruns
- 4.6 Supply-Chain Analysis
- 4.7 Regulatory Landscape
- 4.8 Technological Outlook
- 4.9 Porter's Five Forces
- 4.9.1 Bargaining Power of Buyers
- 4.9.2 Bargaining Power of Suppliers
- 4.9.3 Threat of New Entrants
- 4.9.4 Threat of Substitutes
- 4.9.5 Competitive Rivalry
- 4.10 PESTLE Analysis
5 Market Size & Growth Forecasts
- 5.1 Power Generation EPC
- 5.1.1 By Technology
- 5.1.1.1 Thermal
- 5.1.1.2 Nuclear
- 5.1.1.3 Renewables
- 5.1.2 By Capacity Band
- 5.1.2.1 Up to 100 MW (DER, micro-grid)
- 5.1.2.2 100 to 499 MW
- 5.1.2.3 Above 500 MW
- 5.1.3 By End-User
- 5.1.3.1 Regulated Utilities
- 5.1.3.2 Independent Power Producers
- 5.1.3.3 Industrial Captive Power
- 5.1.3.4 Public Sector and SOE
- 5.1.1 By Technology
- 5.2 Power Transmission and Distribution (T&D) EPC
6 Competitive Landscape
- 6.1 Market Concentration
- 6.2 Strategic Moves (M&A, Partnerships, PPAs)
- 6.3 Market Share Analysis (Market Rank/Share for key companies)
- 6.4 Company Profiles (includes Global level Overview, Market level overview, Core Segments, Financials as available, Strategic Information, Products & Services, and Recent Developments)
- 6.4.1 Fluor Corporation
- 6.4.2 Bechtel Corporation
- 6.4.3 Kiewit Corporation
- 6.4.4 Black & Veatch Holdings
- 6.4.5 Burns & McDonnell
- 6.4.6 Jacobs Engineering Group
- 6.4.7 AECOM
- 6.4.8 Zachry Group
- 6.4.9 McDermott International
- 6.4.10 Mortenson Construction
- 6.4.11 Gemma Power Systems
- 6.4.12 JGC Corporation
- 6.4.13 Siemens Energy Inc.
- 6.4.14 John Wood Group PLC
- 6.4.15 Mitsubishi Power Americas
- 6.4.16 Worley
- 6.4.17 SNC-Lavalin (AtkinsRealis)
- 6.4.18 HDR Inc.
- 6.4.19 Skanska USA
- 6.4.20 IHI Power Services
7 Market Opportunities & Future Outlook
- 7.1 White-space & Unmet-Need Assessment


