

|
시장보고서
상품코드
2113704
헬스케어 BI : 시장 점유율 분석, 업계 동향 및 통계, 성장 예측(2026-2031년)Healthcare BI - Market Share Analysis, Industry Trends & Statistics, Growth Forecasts (2026 - 2031) |
||||||
 Mordor Intelligence
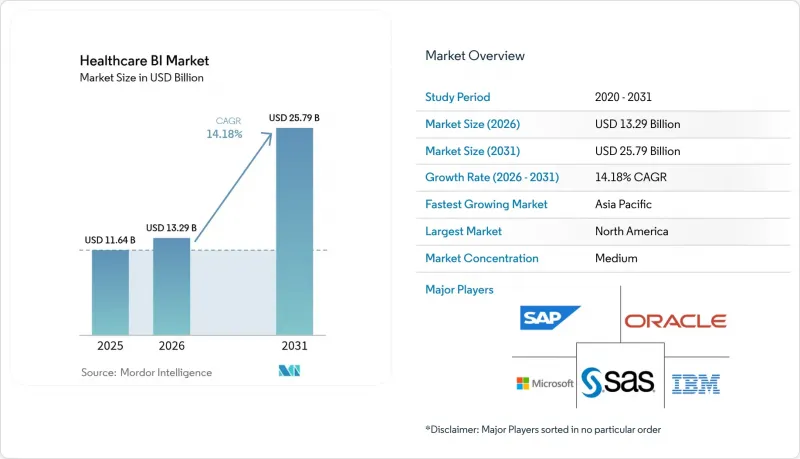
Mordor Intelligence에 의하면, 2026년 헬스케어 BI 시장 규모는 132억 9,000만 달러로 추정되고 2025년 116억 4,000만 달러에서 확대해, 2031년에는 257억 9,000만 달러에 이를 것으로 예측됩니다.
2026년부터 2031년까지의 연평균 성장률(CAGR)은 14.18%를 나타낼 전망입니다.
본 보고서에서는 업계를 구성 요소별(소프트웨어, 서비스), 제공 형태별(On-Premise형, 하이브리드형, 클라우드 기반), 용도별(재무 분석, 임상 데이터 분석 등), 최종 사용자별(보험사, 의료 제공업체, 기타 최종 사용자), 지역별(북미, 유럽 등)로 분류하고 있습니다. 시장 예측은 금액(달러)으로 표시되어 있습니다.
세계의 헬스케어 BI 시장 동향 및 인사이트
성과 기반 상환을 위한 규제적 추진
지급을 성과와 연계하는 정책은 이제 주류가 되었습니다. 메디케어·메디케이드 서비스 센터(CMS)는 2030년까지 모든 메디케어 수급자를 책임 의료(Accountable Care) 체계 하에 두는 것을 목표로 하고 있으며, 이 목표는 민간 보험사에도 파급되고 있습니다. 조직은 고위험 환자 집단을 관리하고 복잡한 계약 하에서의 성과를 예측하기 위해 임상 데이터, 재무 데이터, 사회적 결정 요인 데이터를 통합하는 거의 실시간에 가까운 분석이 필요합니다. Carle Health와 같은 의료 시스템은 BI 스택에 청구 데이터, 전자건강기록(EHR), 사회적 위험 데이터를 통합함으로써 피할 수 있는 비용을 절감하는 동시에 품질을 향상시키고 있습니다. 모든 지불 모델에는 내재된 위험이 있으므로, 지속적인 측정과 예측 모델링이 가능한 플랫폼에 대한 수요는 더욱 높아질 것입니다.
EHR 데이터 양 증가와 상호운용성 의무화
Epic사의 Cosmos는 현재 2억 4,600만 명의 개인으로부터 수집된 익명화된 기록을 집계하고 있으며, 이는 의료 데이터가 전례 없는 규모에 도달했음을 보여줍니다. ‘21세기 치료법(21st Century Cures Act)’ 및 TEFCA는 의료 제공업체에게 정보 공유를 의무화하고 있지만, 데이터의 파편화로 인해 의사 결정에 활용되는 가용 데이터는 60% 미만에 그치고 있습니다. FHIR(Fast Healthcare Interoperability Resources)의 도입으로 데이터가 거의 실시간으로 흐르게 되었으며, 고도화된 분석을 위한 기술적 기반이 마련되었습니다. 데이터 양이 급증하는 가운데, 데이터 품질, 표준화, 거버넌스에 대한 노력은 여전히 필수적입니다.
데이터 사일로화와 레거시 시스템으로 인한 상호운용성 격차
FHIR 및 ‘21세기 치료법(21st Century Cures Act)’의 의무화에도 불구하고, 상호 연결되지 않은 시스템은 의료 서비스 지연과 비용 증가를 초래하고 있습니다. 많은 병원에서는 여전히 독자적인 데이터 형식이나 노후화된 아키텍처로 인해 어려움을 겪고 있으며, 이는 전사적 분석을 저해하는 요인이 되고 있습니다. 경쟁상의 우려와 개인정보 보호 규정 또한 조직 간 데이터 공유를 더욱 지연시키고 있습니다. 데이터 사일로를 극복하기 위해서는 통합 엔진, 마스터 데이터 관리, 그리고 문화적 변화에 대한 지속적인 투자가 필요합니다.
부문 분석
2025년 의료 비즈니스 인텔리전스 시장에서 소프트웨어는 35.02%라는 최대 점유율을 차지했습니다. 이는 분석 제품군, 시각화 대시보드, 내장형 AI 서비스가 주도한 결과입니다. 그러나 통합, 교육, 관리형 분석을 아우르는 서비스는 연평균 성장률(CAGR) 14.52%로 확대되며 플랫폼 판매를 앞질렀습니다. 이러한 격차는 가치가 단순히 도구를 소유하는 데 있는 것이 아니라, 복잡한 임상 워크플로우 속에서 이를 운영하는 데에 있다는 점을 보여줍니다.
조직들은 레거시 데이터 마이그레이션, 대시보드 맞춤 설정, 사용자 교육을 위해 외부 전문가에 의존하고 있습니다. 데이터 리터러시를 갖춘 임상의의 심각한 부족이 서비스 수요를 뒷받침하고 있습니다. 에픽(Epic)이 기업 자원 계획(ERP) 분야에 진출한 것은 주요 플랫폼 벤더들이 도입을 가속화하기 위해 컨설팅을 패키지로 묶고 있음을 여실히 보여줍니다. 시스템이 성숙해짐에 따라 서비스 파트너는 지속적인 데이터 거버넌스, 성능 튜닝, 알고리즘 검증을 관리하게 되며, 분석 투자 수익률(ROI)을 실현하기 위한 중요한 추진자로서의 역할을 강화해 나갈 것입니다.
OLAP 및 시각화는 2025년 매출의 40.88%를 차지하며, 재무, 품질, 규정 준수에 걸친 일상적인 모니터링을 위한 직관적인 대시보드를 제공했습니다. 그러나 의료 서비스 제공업체들이 예방적 진료를 추구함에 따라, 고급 분석 및 예측 분석은 연평균 15.01%의 성장률을 보일 것으로 예측됩니다.
Health Catalyst의 고객들은 조기 발견 알고리즘과 위험 계층화 모델을 통해 수백만 달러의 비용 절감을 실현하고 있습니다. 생성형 AI는 특징량 엔지니어링과 시나리오 테스트를 자동화함으로써, 고급 모델링의 진입 장벽을 더욱 낮춥니다. 마이크로소프트의 AI 관련 매출이 130억 달러에 달한다는 사실은 머신러닝을 분석 기반에 통합한 패키지형 프레임워크에 대한 수요가 높음을 보여줍니다. 알고리즘이 성숙해짐에 따라, 조직들은 집단 보건 및 정밀의료 분야에서 사후 보고 작성에서 미래를 내다보는 개입 계획으로 전환해 나갈 것입니다.
지역별 분석
2025년 헬스케어 비즈니스 인텔리전스 시장에서 북미는 45.97%의 점유율로 1위를 차지했습니다. 이는 전자의무기록(EHR)의 보급 확대, 상호운용성 의무화, 그리고 가치 기반 의료의 조기 도입에 힘입은 결과입니다. Epic사가 보유한 3억 2,500만 건 이상의 환자 기록은 지역 데이터 흐름에 대한 해당 기업의 영향력을 확고히 하고 있습니다. 법규의 명확화와 견고한 클라우드 인프라가 맞물려 기업용 분석 도구 도입이 가속화되고 있습니다. 향후 예상되는 비즈니스 지원 정책으로 인해 사모펀드(PE) 활동이 활발해지면서, BI 도구 분야의 경쟁과 혁신이 격화될 가능성이 있습니다.
아시아태평양은 2031년까지 연평균 성장률(CAGR)이 16.61%로 가장 빠르게 성장하고 있으며, 이는 각국의 적극적인 디지털 헬스 계획과 의료비 증가를 반영한 것입니다. 인도의 보험 자금 기반 모델에서는 전체 인구의 건강 상태에 대한 인사이트가 요구되는 반면, 싱가포르에서는 예방적 모니터링을 위해 IoT 기기가 통합되고 있습니다. 중국, 호주, 태국 정부는 고령화 사회에서 만성 질환의 부담을 관리하기 위해 AI 시범 사업에 자금을 지원하고 있습니다. 개발도상국 시장조차 클라우드 네이티브 플랫폼을 채택함으로써 레거시 시스템을 뛰어넘고 있으며, 이는 확장 가능한 BI 벤더에게 매우 큰 기회를 창출하고 있습니다.
유럽에서는 GDPR(EU 개인정보보호규정)을 계기로 규정 준수에 부합하는 데이터 거버넌스와 국경을 초월한 상호 운용성에 대한 투자가 진행되며 꾸준한 확대세를 보이고 있습니다. ‘유럽 헬스 데이터 스페이스(European Health Data Space)’와 같은 프로그램은 회원국 전체에서 표준화된 분석을 촉진하여 벤더들에게 비즈니스 기회를 확대되고 있습니다. 중동 및 아프리카는 기반은 미약하지만, 특히 걸프협력회의(GCC) 회원국에서 전자건강기록(EHR) 및 원격의료에 막대한 투자를 하고 있습니다. 현대화 노력은 의료 품질 성과에 대한 벤치마킹 필요성과 부합하며, 비즈니스 인텔리전스(BI) 보급률이 점차 상승할 것으로 예측됩니다.
기타 혜택 :
- 엑셀 형식 시장 예측(ME) 시트
- 3개월간의 애널리스트 지원
자주 묻는 질문
목차
제1장 서론
제2장 조사 방법
제3장 주요 요약
제4장 시장 구도
제5장 시장 규모 및 성장 예측
제6장 경쟁 구도
제7장 시장 기회 및 향후 전망
KTH 26.08.26According to Mordor Intelligence, Healthcare business intelligence market size in 2026 is estimated at USD 13.29 billion, growing from 2025 value of USD 11.64 billion with 2031 projections showing USD 25.79 billion, growing at 14.18% CAGR over 2026-2031.
This report Segments the Industry Into by Component (Software, Services), by Mode of Delivery (On-Premise Model, Hybrid Model, Cloud-Based Model), by Application (Financial Analysis, Clinical Data Analysis and More), by End User (Payers, Healthcare Providers, Other End Users), and Geography (North America, Europe, and More). The Market Forecasts are Provided in Terms of Value (USD).
Global Healthcare BI Market Trends and Insights
Regulatory Push for Value-Based Reimbursement
Policies linking payments to outcomes are now mainstream. The Centers for Medicare & Medicaid Services intends to place all Medicare beneficiaries in accountable care relationships by 2030, a goal echoing across commercial payers. Organizations require near real-time analytics that synthesize clinical, financial, and social-determinant data to manage at-risk populations and predict performance under complex contracts. Health systems such as Carle Health have cut avoidable costs while boosting quality by integrating claims, EHR, and social-risk data in their BI stack. As every payment model embeds risk, demand for platforms capable of continuous measurement and predictive modeling will intensify.
Rising EHR Data Volume & Interoperability Mandates
Epic's Cosmos now aggregates de-identified records from 246 million individuals, illustrating the unprecedented scale of healthcare data. The 21st Century Cures Act and TEFCA oblige providers to share information, yet less than 60% of available data informs decision-making because of fragmentation. Adoption of Fast Healthcare Interoperability Resources (FHIR) streams data in near real time, laying a technical foundation for advanced analytics. Tackling data quality, standardization, and governance remains essential as volumes soar.
Data Silos & Legacy Interoperability Gaps
Disconnected systems delay care and inflate costs despite FHIR and Cures Act mandates. Many hospitals still grapple with proprietary data formats and aging architectures that block enterprise-wide analytics. Competitive concerns and privacy rules further slow data-sharing outside organizational walls. Overcoming silos will require continued investment in integration engines, master-data management, and cultural change.
Other drivers and restraints analyzed in the detailed report include:
- Cloud Cost-Efficiencies Enabling Analytics at Scale
- AI-Led Automated Insight Generation (Gen-AI)
- High Total Cost of Ownership for Enterprise BI
For complete list of drivers and restraints, kindly check the Table Of Contents.
Segment Analysis
Software held the largest 35.02% share of the healthcare business intelligence market in 2025, anchored by analytics suites, visualization dashboards, and embedded AI services. However, services-covering integration, training, and managed analytics-are expanding at a 14.52% CAGR, outpacing platform sales. This divergence signals that value lies not just in owning tools but in operationalizing them within complex clinical workflows.
Organizations rely on external experts to migrate legacy data, customize dashboards, and coach users. The acute shortage of data-literate clinicians sustains services demand. Epic's move into enterprise resource planning underscores that large platform vendors now package consulting to accelerate adoption. As systems mature, services partners will manage ongoing data governance, performance tuning, and algorithm validation, reinforcing their role as critical enablers of analytic ROI.
OLAP & visualization accounted for 40.88% of 2025 revenue, offering intuitive dashboards for day-to-day monitoring across finance, quality, and compliance. Yet advanced & predictive analytics is projected to grow 15.01% annually as providers pursue proactive care.
Health Catalyst clients have saved millions through early detection algorithms and risk stratification models. Generative AI further lowers the barrier to sophisticated modeling by automating feature engineering and scenario testing. Microsoft's USD 13 billion AI run rate illustrates demand for packaged frameworks that embed machine learning into the analytic fabric. As algorithms mature, organizations will transition from retrospective reporting toward prospective intervention planning in population health and precision medicine.
Complete Report Scope:
- By Component
- Platforms
- Software
- Services
- By Function
- OLAP & Visualisation
- Performance Management
- Query & Reporting
- Advanced & Predictive Analytics
- By Application
- Clinical Analytics
- Population Health Management
- Precision Medicine Support
- Quality & Outcome Improvement
- Financial Analytics
- Revenue Cycle Management
- Fraud Detection & Risk Adjustment
- Operational Analytics
- Supply-Chain & Inventory Optimisation
- Staffing & Workflow Optimisation
- Strategic Planning & Benchmarking
- Clinical Analytics
- By End User
- Healthcare Providers
- Hospitals & Health Systems
- Ambulatory Surgical Centres
- Specialty Clinics
- Payers
- Public Payers
- Private Payers
- Life-Science Companies
- Government & Public-Health Agencies
- Other End Users (ACOs, CROs)
- Healthcare Providers
- By Region
- North America
- United States
- Canada
- Mexico
- South America
- Brazil
- Argentina
- Rest of South America
- Europe
- Germany
- United Kingdom
- France
- Italy
- Spain
- Russia
- Rest of Europe
- Asia-Pacific
- China
- Japan
- India
- South Korea
- Australia
- Rest of Asia-Pacific
- Middle East and Africa
- GCC
- South Africa
- Rest of Middel East and Africa
- North America
Geography Analysis
North America led with a 45.97% share of the healthcare business intelligence market in 2025, fueled by mature EHR penetration, mandated interoperability, and early adoption of value-based care. Epic's base of more than 325 million patient records entrenches its influence on regional data flows. Legislative clarity, coupled with robust cloud infrastructure, speeds enterprise analytics rollouts. Anticipated pro-business policies may accelerate private-equity activity, intensifying competition and innovation in BI tooling.
Asia-Pacific is the fastest-growing region at a 16.61% CAGR to 2031, reflecting aggressive national digital-health plans and rising healthcare spending. India's insurance-funded models demand population-health insights, while Singapore integrates IoT devices for preventive monitoring. Governments in China, Australia, and Thailand fund AI pilots to manage chronic-disease burdens amid aging populations. Even developing markets are leapfrogging legacy systems by adopting cloud-native platforms, creating outsized opportunities for scalable BI vendors.
Europe shows steady expansion as GDPR drives investment in compliant data governance and cross-border interoperability. Programs like the European Health Data Space encourage standardized analytics across member states, boosting vendor opportunities. Middle East and Africa, though starting from lower bases, invest heavily in EHRs and telemedicine, especially in Gulf Cooperation Council nations. Modernization initiatives align with the need to benchmark quality outcomes, suggesting a gradual rise in BI penetration.
- Microsoft
- IBM
- Oracle (incl. Cerner)
- SAP
- Optum
- Qlik
- Salesforce (Tableau)
- SAS Institute
- Health Catalyst
- Dimensional Insight
- Mckesson
- Epic Systems
- Inovalon
- MedeAnalytics
- Veradigm (Allscripts)
- IQVIA
- AWS (HealthLake)
- Google Cloud Healthcare
- Snowflake
- Innovaccer
- Clarify Health
- Arcadia
Additional Benefits:
- The market estimate (ME) sheet in Excel format
- 3 months of analyst support
TABLE OF CONTENTS
1 Introduction
- 1.1 Study Assumptions & Market Definition
- 1.2 Scope of the Study
2 Research Methodology
3 Executive Summary
4 Market Landscape
- 4.1 Market Overview
- 4.2 Market Drivers
- 4.2.1 Regulatory push for value-based reimbursement
- 4.2.2 Rising EHR data volume & interoperability mandates
- 4.2.3 Cloud cost-efficiencies enabling analytics at scale
- 4.2.4 AI-led automated insight generation (Gen-AI)
- 4.2.5 FHIR-based real-time data streaming adoption
- 4.2.6 Availability of synthetic healthcare data sets
- 4.3 Market Restraints
- 4.3.1 Data silos & legacy interoperability gaps
- 4.3.2 High total cost of ownership for enterprise BI
- 4.3.3 Shortage of data-literate clinical staff
- 4.3.4 Cross-border data-transfer & AI-governance risks
- 4.4 Regulatory Landscape
- 4.5 Technological Outlook
- 4.6 Porter's Five Forces
- 4.6.1 Threat of New Entrants
- 4.6.2 Bargaining Power of Suppliers
- 4.6.3 Bargaining Power of Buyers
- 4.6.4 Threat of Substitutes
- 4.6.5 Competitive Rivalry
5 Market Size & Growth Forecasts (Value, USD Billion)
- 5.1 By Component
- 5.1.1 Platforms
- 5.1.2 Software
- 5.1.3 Services
- 5.2 By Function
- 5.2.1 OLAP & Visualisation
- 5.2.2 Performance Management
- 5.2.3 Query & Reporting
- 5.2.4 Advanced & Predictive Analytics
- 5.3 By Application
- 5.3.1 Clinical Analytics
- 5.3.1.1 Population Health Management
- 5.3.1.2 Precision Medicine Support
- 5.3.1.3 Quality & Outcome Improvement
- 5.3.2 Financial Analytics
- 5.3.2.1 Revenue Cycle Management
- 5.3.2.2 Fraud Detection & Risk Adjustment
- 5.3.3 Operational Analytics
- 5.3.3.1 Supply-Chain & Inventory Optimisation
- 5.3.3.2 Staffing & Workflow Optimisation
- 5.3.4 Strategic Planning & Benchmarking
- 5.3.1 Clinical Analytics
- 5.4 By End User
- 5.4.1 Healthcare Providers
- 5.4.1.1 Hospitals & Health Systems
- 5.4.1.2 Ambulatory Surgical Centres
- 5.4.1.3 Specialty Clinics
- 5.4.2 Payers
- 5.4.2.1 Public Payers
- 5.4.2.2 Private Payers
- 5.4.3 Life-Science Companies
- 5.4.4 Government & Public-Health Agencies
- 5.4.5 Other End Users (ACOs, CROs)
- 5.4.1 Healthcare Providers
- 5.5 By Region
- 5.5.1 North America
- 5.5.1.1 United States
- 5.5.1.2 Canada
- 5.5.1.3 Mexico
- 5.5.2 South America
- 5.5.2.1 Brazil
- 5.5.2.2 Argentina
- 5.5.2.3 Rest of South America
- 5.5.3 Europe
- 5.5.3.1 Germany
- 5.5.3.2 United Kingdom
- 5.5.3.3 France
- 5.5.3.4 Italy
- 5.5.3.5 Spain
- 5.5.3.6 Russia
- 5.5.3.7 Rest of Europe
- 5.5.4 Asia-Pacific
- 5.5.4.1 China
- 5.5.4.2 Japan
- 5.5.4.3 India
- 5.5.4.4 South Korea
- 5.5.4.5 Australia
- 5.5.4.6 Rest of Asia-Pacific
- 5.5.5 Middle East and Africa
- 5.5.5.1 GCC
- 5.5.5.2 South Africa
- 5.5.5.3 Rest of Middel East and Africa
- 5.5.1 North America
6 Competitive Landscape
- 6.1 Market Concentration
- 6.2 Competitive Benchmarking
- 6.3 Market Share Analysis
- 6.4 Company Profiles (includes Global level Overview, Market level overview, Core Segments, Financials as available, Strategic Information, Market Rank/Share for key companies, Products & Services, and Recent Developments)
- 6.4.1 Microsoft
- 6.4.2 IBM
- 6.4.3 Oracle (incl. Cerner)
- 6.4.4 SAP SE
- 6.4.5 Optum
- 6.4.6 Qlik
- 6.4.7 Salesforce (Tableau)
- 6.4.8 SAS Institute
- 6.4.9 Health Catalyst
- 6.4.10 Dimensional Insight
- 6.4.11 McKesson
- 6.4.12 Epic Systems
- 6.4.13 Inovalon
- 6.4.14 MedeAnalytics
- 6.4.15 Veradigm (Allscripts)
- 6.4.16 IQVIA
- 6.4.17 AWS (HealthLake)
- 6.4.18 Google Cloud Healthcare
- 6.4.19 Snowflake
- 6.4.20 Innovaccer
- 6.4.21 Clarify Health
- 6.4.22 Arcadia
7 Market Opportunities & Future Outlook
- 7.1 White-Space & Unmet-Need Assessment


