

|
시장보고서
상품코드
2114270
유럽의 바이오 비료 시장 : 시장 점유율 분석, 업계 동향 통계, 성장 예측(2026-2031년)Europe Biofertilizers - Market Share Analysis, Industry Trends & Statistics, Growth Forecasts (2026 - 2031) |
||||||
 Mordor Intelligence
Mordor Intelligence에 의하면, 유럽의 바이오 비료 시장 규모는 2025년 11억 4,000만 달러로 평가되었고, 2026년에는 12억 2,000만 달러로 추정되고, 2026-2031년 CAGR 6.6%로 성장을 지속할 전망이며, 2031년에는 16억 7,000만 달러에 이를 것으로 예측됩니다.
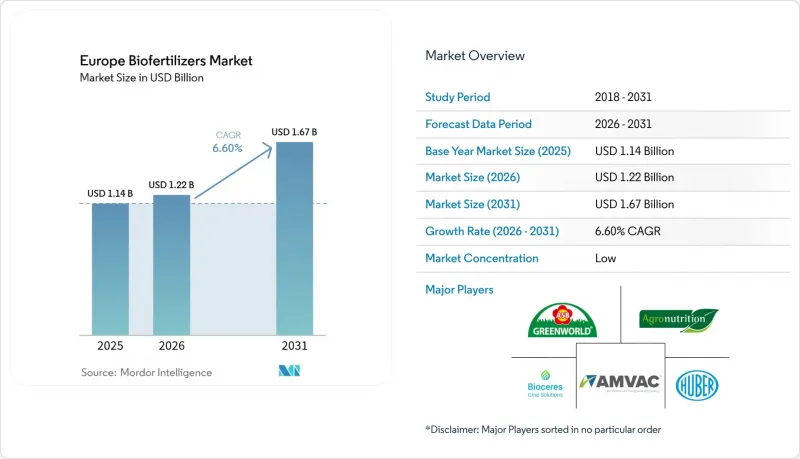
본 보고서는 형태별(리조비움, 아조스피릴룸, 아조토박터, 균근, 인산 용해균 및 기타 바이오 비료), 작물 유형별(밭작물, 원예작물 및 현금작물), 지역별(독일, 영국, 프랑스,스페인, 러시아, 이탈리아, 네덜란드, 튀르키예 및 기타 유럽 국가)별로 분류되어 있습니다. 시장 예측은 금액(달러) 및 수량(미터톤) 단위로 제시되어 있습니다.
유럽의 바이오 비료 시장 동향 및 인사이트
EU의 ‘팜 투 포크(Farm to Fork)’ 정책에 따른 유기농 경지 확대 의무화
‘팜 투 포크’ 정책에 따라 농지의 25%를 유기농지로 전환한다는 목표에 따라, 약 1,700만 헥타르가 새롭게 유기농법으로 전환될 것입니다. 이러한 확대에 따라 질소 고정 및 인 동원을 위한 미생물 제제가 그 어느 때보다 대량으로 필요하게 될 것입니다. 독일과 프랑스 등 각국 정부는 이 의무를 국가 전략에 반영하여, 유통업체와 협동조합의 조달 계획을 수립할 명확한 일정을 마련하고 있습니다. 이 의무화와 관련된 자금원은 농가 교육, 시범 농장, 성과 검증을 포괄하며, 이를 통해 도입에 수반되는 학습 곡선이 단축되고 있습니다. 많은 생산자가 수십 년에 걸친 화학 비료 의존을 겪은 후 급격한 학습 곡선에 직면하고 있기 때문에 농업 기술 서비스와 자재 판매를 결합한 공급업체들은 조기에 고객의 충성도를 확보하고 있습니다. 시장 정보에 따르면, 생산자들이 봄철 시비 성수기에 앞서 공급을 확보하기 위해 미생물 제품의 시즌 전 예약이 증가하고 있으며, 이러한 추세는 이 의무화가 유럽의 바이오 비료 시장에 미치는 견인 효과를 여실히 보여주고 있습니다.
EU의 엄격한 탄소 및 영양염 규제
헥타르당 170kg N이라는 질산염 상한 규제와 CO2 환산 1톤당 26.5-31.8달러의 새로운 탄소 부과금은 농가의 예산 계산을 실시간으로 변화시키고 있습니다. 가장 엄격한 질산염 취약 지역에서 농사를 짓는 덴마크와 네덜란드의 농가들은 잔류 인을 방출하는 인산 용해 박테리아를 활용함으로써 2019년 이후 비료 사용량을 40-50% 줄일 수 있었습니다고 보고하고 있습니다. 규제 당국이 탄소세를 EU 배출권 거래 제도(EU ETS)와 연동하고 있어 합성 암모니아의 비용 상승이 널리 예상되고 있으며, 곡물 및 유채 생산자들은 처벌이 더욱 엄격해지기 전에 영양원의 다각화를 추진하고 있습니다. 질소 시비 기록을 보조금 수령 자격과 연계하는 지속적인 모니터링 요건은 환경 부하가 낮은 생물 제제로의 전환을 더욱 촉진하고 있습니다. 이 두 가지 정책으로 인해 미생물 제제 공급업체들은 제3자에 의한 포장 시험을 통해 탄소 및 영양소 효율성에 대한 주장을 입증해야 하는 압박을 받고 있으며, 이러한 움직임이 경쟁적 차별화를 더욱 뚜렷하게 만들고 있습니다.
포장 내 성능의 편차
여러 지점에서 실시된 시험에서는 수확량 반응에 15-40%의 편차가 나타났습니다. 이는 미생물의 생존이 pH, 토양의 입도, 수분 프로파일에 좌우되기 때문이며, 지중해성 로움 토양과 북유럽의 점토질 토양에서는 이러한 조건이 현저하게 다르기 때문입니다. 폴란드와 헝가리의 사질 토양에서는 여름철 급속한 건조로 인해 미생물의 지속성이 저하되어, 곡물 생산자들에게 불안정한 수익을 초래하고 있습니다. 프랑스 북부에서는 초봄의 한파로 인해 균근균의 정착이 최대 절반까지 감소하여, 식물이 인을 가장 필요로 하는 시기에 그 흡수가 억제되고 있습니다. 이러한 변동성으로 인해 농가들은 자신의 농장에서 스트립 시험을 실시할 수밖에 없으며, 그 결과 밭 전체로의 도입이 지연되고 주문량도 정체되고 있습니다. 현재 공급업체들은 신뢰를 쌓기 위해 토양 검사 키트와 자문 서비스를 세트로 판매하고 있지만, 서비스의 확장성에는 여전히 과제가 남아 있습니다.
부문 분석
2025년, 균근균은 유럽 바이오 비료 시장에서 62.30%라는 압도적인 점유율을 차지했으며, 인을 동원하고 토양 구조를 강화하는 입증된 능력을 바탕으로 이 부문은 2031년까지 주도적인 위치를 유지할 것으로 예측됩니다. 리조비움은 시작 규모는 작지만, CAP(공통농업정책)의 친환경 지원 제도가 생물학적 질소 고정에 의존하는 콩과 작물의 윤작 확대를 촉진하고, 유기농으로 전환을 목표로 하는 농장의 합성비료 투입 비용을 절감함에 따라 7.12%라는 가장 높은 연평균 성장률(CAGR)을 나타낼 전망입니다. 이 두 범주는 회원국 전체의 영양소 배출 및 지속가능성 요건을 모두 충족함으로써 유럽 바이오 비료 시장 규모 확대를 주도하고 있습니다.
아조스피릴룸은 여전히 큰 점유율을 유지하며 안정적인 성장 궤도를 타고 있습니다. 성장 촉진 특성으로 인해 뿌리 구조와 양분 흡수가 개선되므로 곡물 농장에서 선호되고 있습니다. 바실러스 계열 및 기타 다균주 혼합제는 특수 채소 생산자들이 광범위한 효과를 발휘하는 솔루션을 추구하는 가운데, 꾸준한 성장과 함께 큰 시장 점유율을 차지하고 있습니다. 아조토박터와 인산 용해성 박테리아는 탄소 고정으로 인한 이점을 바탕으로, 토양 크레딧 시장이 성숙해지면 향후 시장 점유율을 비약적으로 확대할 가능성을 내포하고 있습니다. 이러한 소규모 부문에서의 지속적인 특허 활동은 혁신의 깊이를 입증하고 있으며, 이를 통해 현재 시장을 독점하고 있는 균류계 및 뿌리혹박테리아계 제품을 넘어 유럽의 바이오 비료 시장 점유율이 점차 확대될 것으로 기대됩니다.
기타 혜택 :
- 엑셀 형식 시장 예측(ME) 시트
- 3개월간의 애널리스트 지원
자주 묻는 질문
목차
제1장 서론
제2장 개 보고서의 내용
제3장 주요 요약 및 주요 조사 결과
제4장 주요 업계 동향
제5장 시장 규모 및 성장 예측
제6장 경쟁 구도
제7장 농업용 바이오 제품 기업 CEO를 향한 중요 전략적 과제
AJY 26.08.26According to Mordor Intelligence, the Europe biofertilizer market size is expected to grow from USD 1.14 billion in 2025 to USD 1.22 billion in 2026 and is forecast to reach USD 1.67 billion by 2031 at 6.6% CAGR over 2026-2031.
This report is Segmented by Form (Rhizobium, Azospirillum, Azotobacter, Mycorrhiza, Phosphate-Solubilizing Bacteria, and Other Biofertilizer), Crop Type (Row Crops, Horticultural Crops, and Cash Crops), and Geography (Germany, United Kingdom, France, Spain, Russia, Italy, Netherlands, Turkey, and Rest of Europe). The Market Forecasts are Provided in Terms of Value (USD) and Volume (Metric Tons).
Europe Biofertilizers Market Trends and Insights
EU Farm to Fork Organic-Area Mandate
The 25% organic farmland target under Farm to Fork shifts roughly 17 million additional hectares into biological management, an expansion that requires unprecedented volumes of microbial inoculants for nitrogen fixation and phosphorus mobilization. Governments such as Germany and France have embedded the mandate into national strategies, creating clear timelines that shape procurement planning for distributors and cooperatives. Funding streams tied to the mandate cover farmer training, demonstration plots, and outcome verification which together shorten adoption learning curves. Suppliers that bundle agronomy services with input sales gain early loyalty because many growers face steep learning curves after decades of synthetic fertilizer dependence. Market intelligence points to rising pre-season booking of microbial products as growers secure supply in advance of peak spring applications, a pattern that underscores the mandate's pull effect on the Europe biofertilizer market.
Restrictive EU Carbon and Nutrient Regulations
The nitrate cap of 170 kg N per hectare and emergent carbon fees of USD 26.5-31.8 per ton of CO2 equivalent are altering farm budget math in real time. Danish and Dutch growers, operating in some of the strictest nitrate-vulnerable zones, now document fertilizer savings of 40-50% since 2019 by leaning on phosphate-solubilizing bacteria that unlock residual phosphorus. Because regulators index carbon fees to the EU Emissions Trading System, cost escalators on synthetic ammonia are widely expected, prompting cereal and rapeseed growers to diversify nutrient sources before penalties bite deeper. Continuous monitoring requirements that tie nitrogen application records to subsidy eligibility further reinforce the switch to low-impact biologicals. These twin policies push microbial suppliers to validate carbon and nutrient efficiency claims through third-party field trials, a move that sharpens competitive differentiation.
Field-Performance Variability
Multisite trials show yield responses ranging 15-40% because microbial survival hinges on pH, texture, and moisture profiles that differ sharply from Mediterranean loams to Nordic clays. In sandy soils of Poland and Hungary, rapid desiccation during summer lowers microbial persistence, creating inconsistent returns for cereal growers. Early spring cold snaps cut mycorrhizal colonization by up to half in Northern France, curbing phosphorus uptake exactly when plants need it. This variability compels farmers to conduct on-farm strip trials, a practice that delays full-field uptake and slows order volumes. Suppliers now co-pack soil test kits and advisory services to build trust; however, service scalability remains a bottleneck.
Other drivers and restraints analyzed in the detailed report include:
- Rising Consumer Demand for Organic Produce
- CAP Eco-Scheme Subsidies
- Live-Culture Shelf-Life Logistics
For complete list of drivers and restraints, kindly check the Table Of Contents.
Segment Analysis
Mycorrhizal fungi held a commanding 62.30% of Europe biofertilizer market share in 2025, and the segment is anticipated to maintain leadership through 2031 on the back of its proven ability to mobilize phosphorus and strengthen soil structure. Rhizobium, although starting from a smaller base, is projected to post the fastest 7.12% CAGR as CAP eco-scheme payments encourage wider legume rotations that rely on biological nitrogen fixation, cutting synthetic input costs for organic transition farms. Together, these two categories set the pace for expanding Europe biofertilizer market size by meeting both nutrient release and sustainability requirements across member states.
Azospirillum retains a prominent share and is tracking a stable growth path, favored in cereal fields where its growth-promoting traits improve root architecture and nutrient uptake. Bacillus-based and other multi-strain blends account for significant share with a steady growth as specialty vegetable growers look for broad-spectrum solutions. Azotobacter and phosphate-solubilizing bacteria's carbon-sequestration upside positions them for future jumps once soil-credit markets mature. Continuous patent activity across these smaller segments underscores the innovation depth that will gradually broaden Europe biofertilizer market share beyond today's dominant fungal and rhizobial products.
Complete Report Scope:
- By Form
- Rhizobium
- Azospirillum
- Azotobacter
- Mycorrhiza
- Phosphate-Solubilizing Bacteria
- Other Biofertilizer
- By Crop Type
- Row Crops
- Horticultural Crops
- Cash Crops
- By Country
- Germany
- United Kingdom
- France
- Spain
- Russia
- Italy
- Netherlands
- Turkey
- Rest of Europe
List of Companies Covered in this Report:
- Sustane Natural Fertilizer
- Agronutrition S.A.
- Biolchim S.p.A.
- Koppert Biological Systems B.V.
- Lallemand Inc.
- Novonesis A/S
- Groundwork BioAg Ltd.
- Premier Tech Ltd.
- Andermatt Biocontrol AG
- Corteva, Inc.
- Rizobacter Argentina S.A.
- Valent BioSciences LLC
- UPL Ltd.
- Sikko Industries Ltd.
- Plant Health Care plc
Additional Benefits:
- The market estimate (ME) sheet in Excel format
- 3 months of analyst support
TABLE OF CONTENTS
1 INTRODUCTION
- 1.1 Study Assumptions and Market Definition
- 1.2 Scope of the Study
- 1.3 Research Methodology
2 REPORT OFFERS
3 EXECUTIVE SUMMARY & KEY FINDINGS
4 KEY INDUSTRY TRENDS
- 4.1 Area Under Organic Cultivation
- 4.2 Per Capita Spending On Organic Products
- 4.3 Regulatory Framework
- 4.3.1 Germany
- 4.3.2 United Kingdom
- 4.3.3 France
- 4.3.4 Spain
- 4.3.5 Russia
- 4.3.6 Italy
- 4.3.7 Netherlands
- 4.3.8 Turkey
- 4.4 Value Chain & Distribution Channel Analysis
- 4.5 Market Drivers
- 4.5.1 EU Farm to Fork organic area mandate
- 4.5.2 Restrictive EU carbon & nutrient regulations
- 4.5.3 Rising consumer demand for organic produce
- 4.5.4 CAP eco scheme subsidies
- 4.5.5 Soil carbon credit monetization via microbes
- 4.5.6 Insect frass circular nutrient partnerships
- 4.6 Market Restraints
- 4.6.1 Field performance variability
- 4.6.2 Live culture shelf-life logistics
- 4.6.3 Slow pan EU strain registration process
- 4.6.4 Channel conflict from rapid consolidation
5 MARKET SIZE & GROWTH FORECASTS (VALUE AND VOLUME)
- 5.1 By Form
- 5.1.1 Rhizobium
- 5.1.2 Azospirillum
- 5.1.3 Azotobacter
- 5.1.4 Mycorrhiza
- 5.1.5 Phosphate-Solubilizing Bacteria
- 5.1.6 Other Biofertilizer
- 5.2 By Crop Type
- 5.2.1 Row Crops
- 5.2.2 Horticultural Crops
- 5.2.3 Cash Crops
- 5.3 By Country
- 5.3.1 Germany
- 5.3.2 United Kingdom
- 5.3.3 France
- 5.3.4 Spain
- 5.3.5 Russia
- 5.3.6 Italy
- 5.3.7 Netherlands
- 5.3.8 Turkey
- 5.3.9 Rest of Europe
6 COMPETITIVE LANDSCAPE
- 6.1 Key Strategic Moves
- 6.2 Market Share Analysis
- 6.3 Company Landscape
- 6.4 Company Profiles (Includes Global Level Overview, Market Level Overview, Core Business Segments, Financials, Headcount, Key Information, Market Rank, Market Share, Products and Services, and Analysis of Recent Developments).
- 6.4.1 Sustane Natural Fertilizer
- 6.4.2 Agronutrition S.A.
- 6.4.3 Biolchim S.p.A.
- 6.4.4 Koppert Biological Systems B.V.
- 6.4.5 Lallemand Inc.
- 6.4.6 Novonesis A/S
- 6.4.7 Groundwork BioAg Ltd.
- 6.4.8 Premier Tech Ltd.
- 6.4.9 Andermatt Biocontrol AG
- 6.4.10 Corteva, Inc.
- 6.4.11 Rizobacter Argentina S.A.
- 6.4.12 Valent BioSciences LLC
- 6.4.13 UPL Ltd.
- 6.4.14 Sikko Industries Ltd.
- 6.4.15 Plant Health Care plc


