

|
시장보고서
상품코드
2120415
생물 유래 유기 비료 : 시장 점유율 분석, 업계 동향과 통계, 성장 예측(2026-2031년)Biological Organic Fertilizer - Market Share Analysis, Industry Trends & Statistics, Growth Forecasts (2026 - 2031) |
||||||
 Mordor Intelligence
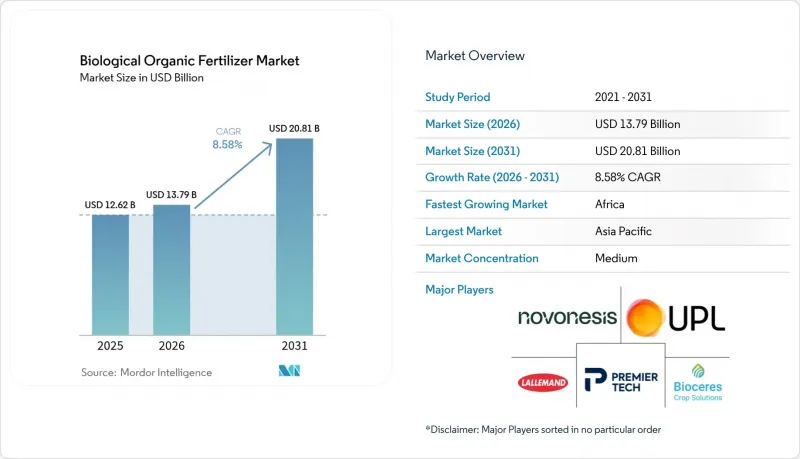
Mordor Intelligence에 따르면 생물 유래 유기 비료 시장 규모는 2025년 126억 2,000만 달러에서 2026년에는 137억 9,000만 달러로 확대되어, 2026년부터 2031년까지 CAGR 8.58%를 기록하며 2031년에는 208억 1,000만 달러에 달할 것으로 예측됩니다.
본 보고서는 유형별(미생물 및 유기 잔여물), 용도별(곡물·시리얼, 콩류·유지종자, 과일·채소, 상업용 작물, 잔디·관상용 식물), 그리고 지역별(북미, 유럽, 아시아태평양, 남미, 중동 및 아프리카)로 분류되어 있습니다. 시장 예측은 금액(달러) 기준으로 제시되어 있습니다.
세계 생물 유래 유기 비료 시장의 동향 및 인사이트
재생 농업에 대한 연방 정부의 장려 정책
주요 농업 지역에서 정부 프로그램을 통해 생물 유래 자재 비용의 상당 부분이 환급되고 있어, 이로 인해 경제적 판단이 미생물 제품에 유리하게 기울고 있습니다. 2025년 12월, 미국 농무부(USDA)는 토양 건강, 수질, 생물 다양성을 향상시키는 관행을 촉진하기 위해 7억 달러 규모의 ‘재생 농업 시범 프로그램’을 시작했습니다. 이 자금은 천연자원보전국(NRCS)을 통해 배분되며, 그중 4억 달러는 환경품질장려프로그램(EQIP)을 통해, 3억 달러는 보전스튜어드십프로그램(CSP)을 통해 제공됩니다. 인도에서는 ‘자본 투자 보조금 제도(CISS)’ 등의 프로그램을 통해 생물 비료 사용을 장려하고 있으며, 이 제도에서는 정부 기관에 최대 100%, 민간 사업자에게는 생산 비용의 25%를 보조하고 있습니다. 또한, 농가들은 ‘판파라가트 크리시 비카스 요자나(PKVY)’를 통한 재정 지원의 혜택을 받고 있으며, ‘PM-PRANAM’ 이니셔티브를 통해 화학 비료 사용 감축에 대한 인센티브도 받고 있습니다. 2023년부터 2027년까지의 ‘공통 농업 정책(CAP)’에 따라, 유럽연합(EU)은 직접 지급 예산의 최소 25%를 기후 및 환경적으로 지속가능한 관행을 지원하는 자발적인 친환경 제도에 할당하도록 의무화하고 있습니다. 이러한 인센티브들이 결합되어 투자 회수 기간이 단축되었으며, 줄 재배 시스템에서도 생물 유래 제품이 경제적으로 매력적인 선택지가 되고 있습니다.
합성 비료에 대한 규제 강화
세계 규제 당국이 허용되는 질소 및 인 부하량에 상한선을 설정하고 있어, 이로 인해 생물 유래 유기 비료 시장에 대한 지속적인 수요가 발생하고 있습니다. 유럽연합(EU)은 ‘농장에서 식탁까지(Farm to Fork)’ 전략의 일환으로, 2030년까지 영양소 손실을 최소 50% 감축한다는 목표를 세우고 합성 비료에 대한 규제를 시행하고 있습니다. 이 이니셔티브는 비료 사용량을 전체적으로 20% 감축하는 것 또한 목표로 하고 있습니다. 새로운 규정(EU 2019/1009)은 환경 기준 강화, 유기 대체재 이용 촉진, 그리고 2026년부터 비료의 폴리머 코팅을 포함한 미세 플라스틱 사용 제한을 목적으로 하고 있습니다. 중국에서는 환경 문제를 해결하기 위해 엄격한 등록 요건, 고독성 제품 금지, 그리고 사용량 제로 성장을 달성하고자 하는 국가 지침을 통해 화학 비료 사용 제한을 시행하고 있습니다. 대형 비료 제조사들조차 사업 방침을 재검토하고 있습니다. 야라 인터내셔널 ASA는 미생물 연구에 할당하는 연구 예산의 비율을 늘렸습니다. 규제의 엄격성은 지역에 따라 다르지만, 선진국 및 신흥 시장 전반에 걸쳐 점진적인 규제가 두드러지게 나타나고 있으며, 생물 유래 자재로 향하는 구조적 전환이 정착되고 있습니다.
고온 기후 하에서의 짧은 저장 기간
미생물은 30°C를 넘는 온도에 노출되면 생존율이 현저히 떨어지기 때문에 열대 지역에서의 사용이 제한됩니다. 적절한 콜드체인 인프라가 갖춰지지 않은 점이 이 문제를 더욱 심각하게 만들고 있습니다. 아프리카 농촌 지역의 유통 거점 중 냉장 시설을 갖춘 곳은 극히 일부에 불과하기 때문입니다. 이러한 제약으로 인해 나이지리아나 케냐 등 온난한 기후를 가진 국가에서는 매년 더운 시기가 되면 제품 반품률이 상당히 높아집니다. 캡슐화는 어느 정도 보호 효과를 가져오지만, 비용을 대폭 증가시키기 때문에 소규모 농가에게는 경제적 부담이 되고 있습니다. 인도의 태양광발전식 마을용 냉장실 도입 등 이 문제를 해결하기 위한 노력은 여전히 초기 단계에 머물러 있으며, 가동중인 설비 수가 아직 제한적이어서 해당 지역에서 온도에 민감한 제품과 관련된 위험을 효과적으로 줄이지는 못하고 있습니다.
부문 분석
미생물 계열은 가장 큰 카테고리로, 2025년에는 생물 유래 유기 비료 시장 점유율의 57.3%를 차지했으며, 2031년까지 연평균 성장률(CAGR) 10.5%로 성장할 것으로 전망되는데, 이는 전체 카테고리 중 가장 높은 수치입니다. 리즈비움은 북미 및 아시아 등지에서 콩과 작물 생산자들이 작물 생산성을 유지하면서 합성 질소에 대한 의존도를 낮추기 위해 접종제 채택을 확대하고 있기 때문에 생물 유래 유기 비료 시장에서 큰 점유율을 차지할 것으로 예상됩니다. 아조스피릴룸은 유사한 질소 사용량 감축을 목표로 하는 대규모 옥수수 재배 사업에서의 채택에 힘입어 급속한 성장을 이루고 있습니다. 인산 용출성 세균 및 균근균의 이용도 꾸준히 확대되고 있으며, 특히 인 결핍이 만연한 지역이나 다년생 작물의 경제적 고려로 인해 고가의 솔루션이 수익성이 있는 지역에서 두드러집니다. 이러한 추세는 커피, 아몬드, 아보카도 등의 작물에서 특히 두드러집니다.
2025년에는 유기 잔여물이 나머지 시장 점유율을 차지했습니다. 이 하위 부문에서는 녹비가 주도적이지만, 노동 집약적인 특성 때문에 기계화가 진행된 곡물 재배 지역에서는 어려움을 겪고 있습니다. 어분과 뼈분은 고부가가치 채소 재배 시스템에서 좋은 성과를 내고 있으며, 그 서방성 인이 엄격한 관개 일정을 보완하고 있습니다. 지역별 보조금을 통해 님이나 피마자유 찌꺼기가 지원되고 있지만, 수출 지향적인 시장에서 확대되는 데에는 중금속 잔류물이나 영양 성분 분석의 편차에 대한 우려가 장벽이 되고 있습니다. 유기 잔재물의 채택은 지역별 농업 관행, 원료의 입수 가능성, 그리고 합성 대체재와 비교한 이러한 투입 자재의 비용 대비 효과에 따라 좌우됩니다. 영양소의 안정성을 향상시키고 오염에 대한 우려를 해소하기 위한 노력은 세계 시장에서의 채택을 촉진하는 데 매우 중요합니다.
지역별 분석
아시아태평양은 최대 시장으로, 2025년에는 생물 유래 유기 비료 시장 점유율의 42.5%를 차지했습니다. 인도와 중국은 관대한 보조금 제도와 영양소 감축 의무화 조치를 통해 성장을 주도하고 있습니다. 인도에서는 인도 농민 비료 협동조합(IFFCO)과 크리샤크 바라티 협동조합(KRIBHCO)이 국내 생물 유래 유기 비료 시장을 지원함으로써 농업의 지속가능성에 기여하고 있는 유력한 비료 협동조합입니다. 이 협동조합들은 주요 화학비료 사업과 병행하여 바이오 비료와 퇴비를 포함한 다양한 친환경 제품을 제조하며 지역 내 공급을 확보하고 있습니다. 중국에서는 합성 비료 재고를 바이오 비료로 전환하는 판매업자에 대해 세금 환급 조치가 시행되고 있어, 산둥성과 허난성에서 유통 경로를 통한 보급이 가속화되고 있습니다.
아프리카에서는 2031년까지 연평균 성장률(CAGR)이 8.8%로 가장 높은 성장세를 기록하고 있습니다. 나이지리아에서는 미생물 제품을 지원하기 위해 소규모 농가를 대상으로 한 바우처에 막대한 예산을 배정하고 있으며, 옥수수를 이용한 초기 시험 재배에서 수확량이 현저히 증가한 것으로 나타났습니다. 남아프리카공화국에서는 웨스턴케이프주의 과수 재배 지역에서 생물 유래 농업 자재에 대한 공동 자금 지원을 통해 합성 질소 비료 사용량이 대폭 감소했습니다. 그러나 콜드체인 인프라의 미비나 제품 보관 기간의 제한과 같은 과제가 이러한 노력의 잠재력을 충분히 발휘하는 데 계속해서 걸림돌이 되고 있습니다. 이러한 장애물에도 불구하고, 미국 국제개발처(USAID) 및 빌 & 멜린다 게이츠 재단 등의 기관이 주도하는 기부자 지원 프로그램을 통해 시범 프로젝트의 범위는 꾸준히 확대되고 있습니다.
북미와 유럽은 상환 프로그램과 엄격한 질산염 규제에 힘입어 꾸준한 연간 성장을 기록하며 2025년 시장 수익에 크게 기여했습니다. 미국에서는 ‘보전 관리 프로그램(Conservation Stewardship Program)’에 따른 지급금이 중서부 지역의 연작 농가 도입률을 매년 크게 끌어올렸습니다. 캐나다의 ‘농업 청정 기술 프로그램(Agricultural Clean Technology Program)’은 농장 내 바이오리액터의 공동 자금 조달을 지원하기 위해 막대한 자금을 제공했으며, 그 결과 생산 비용을 대폭 절감할 수 있었습니다. 유럽에서는 독일, 프랑스, 네덜란드 등 국가들이 엄격한 질소 배출 제한으로 인해 가장 빠른 도입률을 보였으며, 스페인과 이탈리아에서는 도입 속도가 완만했음에도 불구하고 감귤류와 올리브 수출에 힘입어 생물제제의 매출이 현저한 성장을 기록했습니다.
기타 혜택:
- 엑셀 형식의 시장 예측(ME) 시트
- 3개월간의 애널리스트 지원
자주 묻는 질문
목차
제1장 소개
제2장 조사 방법
제3장 주요 요약
제4장 시장 구도
제5장 시장 규모와 성장 예측
제6장 경쟁 구도
제7장 시장 기회와 향후 전망
KSM 26.09.02According to Mordor Intelligence, the biological organic fertilizer market size is projected to grow from USD 12.62 billion in 2025 to USD 13.79 billion in 2026 and is forecast to reach USD 20.81 billion by 2031 at an 8.58% CAGR over 2026-2031.
This report is Segmented by Type (Microorganism and Organic Residues), by Application (Grains and Cereals, Pulses and Oilseeds, Fruits and Vegetables, Commercial Crops, and Turf and Ornamentals), and by Geography (North America, Europe, Asia-Pacific, South America, The Middle East, and Africa). The Market Forecasts are Provided in Terms of Value (USD).
Global Biological Organic Fertilizer Market Trends and Insights
Federal Incentives for Regenerative Farming
Across major farming regions, government programs refund a large share of biological input costs, tilting the economic calculus in favor of microbial products. In December 2025, the United States Department of Agriculture (USDA) launched a USD 700 million Regenerative Pilot Program to promote practices that enhance soil health, water quality, and biodiversity. The funding is allocated through the Natural Resources Conservation Service (NRCS), with USD 400 million provided via the Environmental Quality Incentives Program (EQIP) and USD 300 million through the Conservation Stewardship Program (CSP). India encourages the use of biological fertilizers through subsidies provided under programs such as the Capital Investment Subsidy Scheme (CISS), which offers up to 100% assistance to government agencies and 25% assistance to private units for production. Farmers also benefit from financial support under the Paramparagat Krishi Vikas Yojana (PKVY) and receive incentives to reduce chemical fertilizer use through the PM-PRANAM initiative. Under the Common Agricultural Policy (CAP) 2023-2027, the European Union requires that at least 25% of the direct payments budget be dedicated to voluntary eco-schemes that support climate and environmentally sustainable practices. Together, these incentives shorten payback periods, making biological products economically attractive even in row-crop systems.
Escalating Restrictions on Synthetic Fertilizers
Regulators worldwide are capping allowable nitrogen and phosphorus loads, creating a durable pull for the biological organic fertilizer market. The European Union is implementing restrictions on synthetic fertilizers to achieve a reduction in nutrient losses of at least 50% by 2030, as part of the "Farm to Fork" strategy. This initiative also aims to reduce overall fertilizer use by 20%. New regulations (EU 2019/1009) aim to enhance environmental standards, encourage the use of organic alternatives, and limit the use of microplastics, including polymer coatings on fertilizers, beginning in 2026. China enforces restrictions on chemical fertilizer use through stringent registration requirements, bans on high-toxicity products, and a national directive aimed at achieving zero growth in usage to address environmental concerns. Even fertilizer majors are repositioning. Yara International ASA increased the share of its research budget dedicated to microbes. While enforcement intensity varies by region, progressive restrictions are visible across developed and emerging markets, anchoring a structural shift toward biological inputs.
Short Shelf Life in High-Temperature Climates
Microbial viability declines significantly when exposed to temperatures above 30 °C, limiting its use in tropical regions. The absence of adequate cold-chain infrastructure further intensifies this issue, as only a small proportion of rural distribution points in Africa are equipped with refrigeration facilities. This limitation results in a considerable percentage of product returns in countries with warmer climates, such as Nigeria and Kenya, during the hotter periods of the year. Although encapsulation provides some protection, it also significantly increases costs, creating financial challenges for smallholder farmers. Efforts to address this issue, such as the introduction of solar-powered village cold rooms in India, remain in the early stages, with the number of operational units still too limited to effectively reduce the risks associated with temperature sensitivity in these regions.
Other drivers and restraints analyzed in the detailed report include:
- Rapid Adoption of Microbial Consortia Blends
- Farmer-Led Data Cooperatives Unlocking Localized Soil Health Insights
- Low Farmer Awareness Outside Specialty Crops
For complete list of drivers and restraints, kindly check the Table Of Contents.
Segment Analysis
Microorganisms are the largest type, capturing 57.3% of the biological organic fertilizer market share in 2025 and are forecast to grow at a 10.5% CAGR through 2031, the highest among all categories. Rhizobium is anticipated to hold a significant share of the biological organic fertilizer market, as legume growers across regions such as North America and Asia increasingly adopt inoculants to reduce their reliance on synthetic nitrogen while maintaining crop productivity. Azospirillum is experiencing rapid growth, driven by its adoption in large-scale maize farming operations aiming to achieve similar reductions in nitrogen use. The use of phosphate-solubilizing bacteria and mycorrhizal fungi is also growing steadily, particularly in areas where phosphorus deficiency is prevalent or where the economic considerations of perennial crops make premium-priced solutions viable. This trend is especially notable in crops such as coffee, almonds, and avocados.
Organic residues accounted for the remaining share in 2025. Green manure leads this sub-segment but faces challenges in mechanized grain belts due to its labor-intensive nature. Fish and bone meals perform well in high-value vegetable systems, as their slow-release phosphorus complements tight irrigation schedules. Although region-specific subsidies support neem and castor oil cakes, scalability in export-oriented markets is limited by concerns over heavy-metal residues and inconsistent nutrient analysis. The adoption of organic residues is influenced by regional agricultural practices, availability of raw materials, and the cost-effectiveness of these inputs compared to synthetic alternatives. Efforts to improve nutrient consistency and address contamination concerns are critical for enhancing their adoption in global markets.
Complete Report Scope:
- By Type
- Microorganism
- Rhizobium
- Azotobacter
- Azospirillum
- Blue-green Algae
- Phosphate-Solubilizing Bacteria
- Mycorrhiza
- Other Microorganisms
- Organic Residues
- Green Manure
- Fish Meal
- Bone Meal
- Oil Cakes
- Others
- Microorganism
- By Application
- Grains and Cereals
- Pulses and Oilseeds
- Fruits and Vegetables
- Commercial Crops
- Turf and Ornamentals
- By Geography
- North America
- United States
- Canada
- Rest of North America
- Europe
- Germany
- United Kingdom
- France
- Spain
- Italy
- Russia
- Rest of Europe
- Asia-Pacific
- China
- India
- Japan
- Australia
- Rest of Asia-Pacific
- South America
- Brazil
- Argentina
- Rest of South America
- Middle East
- Saudi Arabia
- United Arab Emirates
- Rest of Middle East
- Africa
- South Africa
- Nigeria
- Rest of Africa
- North America
Geography Analysis
Asia-Pacific is the largest geography and commanded 42.5% of the biological organic fertilizer market share in 2025. India and China anchor growth via generous subsidy pools and mandatory nutrient-reduction directives. In India, the Indian Farmers Fertiliser Cooperative Limited (IFFCO) and Krishak Bharati Cooperative Limited (KRIBHCO) are prominent fertilizer cooperatives contributing to agricultural sustainability by supporting the domestic biological fertilizer market. They manufacture various eco-friendly products, including biofertilizers and compost, alongside their primary chemical fertilizer operations, securing local supply. China offers tax rebates to distributors that swap synthetic inventory for biologicals, accelerating channel penetration in Shandong and Henan provinces.
Africa records the fastest CAGR of 8.8% through 2031. Nigeria has allocated a significant budget for smallholder vouchers to support microbial products, with initial maize trials showing a notable increase in yields. In South Africa, collaborative funding for biological inputs in the Western Cape fruit-growing region has led to a significant reduction in synthetic nitrogen use. However, challenges such as gaps in cold-chain infrastructure and limitations in product shelf life continue to restrict the full potential of these initiatives. Despite these obstacles, donor-supported programs from organizations such as the United States Agency for International Development (USAID) and the Bill and Melinda Gates Foundation are steadily expanding the scope of pilot projects.
North America and Europe contributed significantly to the 2025 market revenue, with steady annual growth driven by reimbursement programs and strict nitrate regulations. In the United States, payments under the Conservation Stewardship Program led to a substantial annual increase in adoption among row-crop operators in the Midwest. Canada's Agricultural Clean Technology Program provided substantial funding to support the co-financing of on-farm bioreactors, resulting in a significant reduction in production costs. In Europe, countries such as Germany, France, and the Netherlands showed the fastest adoption rates due to stringent nitrogen limits, while Spain and Italy experienced slower adoption but still recorded notable growth in biological sales, supported by exports of citrus and olives.
- Novonesis Group
- Bioceres Crop Solutions Corp
- Lallemand, Inc.
- Premier Tech Ltd. (Gestion Bernard Belanger Ltee)
- Corteva Agriscience
- Indian Farmers Fertiliser Cooperative Limited (IFFCO)
- Krishak Bharati Cooperative Limited (KRIBHCO)
- Madras Fertilizers Limited (MFL)
- T. Stanes and Company Limited (Amalgamations Group)
- String Bio Private Limited
- UPL Limited
- Kiwa Bio-Tech Products Group Corporation
- Protan AG
- Savio Bio Organic and Fertilizers Private Limited (SBOF)
- Yara International ASA
- Coromandel International Limited
- Sustane Natural Fertilizer, Inc.
Additional Benefits:
- The market estimate (ME) sheet in Excel format
- 3 months of analyst support
TABLE OF CONTENTS
1 Introduction
- 1.1 Study Assumptions and Market Definition
- 1.2 Scope of the Study
2 Research Methodology
3 Executive Summary
4 Market Landscape
- 4.1 Market Overview
- 4.2 Market Drivers
- 4.2.1 Federal incentives for regenerative farming
- 4.2.2 Escalating restrictions on synthetic fertilizers
- 4.2.3 Rising demand from organic packaged-food processors
- 4.2.4 Rapid adoption of microbial consortia blends
- 4.2.5 Farmer-led data cooperatives unlocking localized soil health insights
- 4.2.6 On-farm bioreactor platforms lowering production costs
- 4.3 Market Restraints
- 4.3.1 Short shelf-life in high-temperature climates
- 4.3.2 Fragmented, country-specific registration hurdles
- 4.3.3 Low farmer awareness outside specialty crops
- 4.3.4 Biocontamination risks during decentralized production
- 4.4 Regulatory Landscape
- 4.5 Technological Outlook
- 4.6 Porter's Five Forces Analysis
- 4.6.1 Bargaining Power of Suppliers
- 4.6.2 Bargaining Power of Buyers
- 4.6.3 Threat of New Entrants
- 4.6.4 Threat of Substitutes
- 4.6.5 Intensity of Competitive Rivalry
5 Market Size and Growth Forecasts (Value)
- 5.1 By Type
- 5.1.1 Microorganism
- 5.1.1.1 Rhizobium
- 5.1.1.2 Azotobacter
- 5.1.1.3 Azospirillum
- 5.1.1.4 Blue-green Algae
- 5.1.1.5 Phosphate-Solubilizing Bacteria
- 5.1.1.6 Mycorrhiza
- 5.1.1.7 Other Microorganisms
- 5.1.2 Organic Residues
- 5.1.2.1 Green Manure
- 5.1.2.2 Fish Meal
- 5.1.2.3 Bone Meal
- 5.1.2.4 Oil Cakes
- 5.1.2.5 Others
- 5.1.1 Microorganism
- 5.2 By Application
- 5.2.1 Grains and Cereals
- 5.2.2 Pulses and Oilseeds
- 5.2.3 Fruits and Vegetables
- 5.2.4 Commercial Crops
- 5.2.5 Turf and Ornamentals
- 5.3 By Geography
- 5.3.1 North America
- 5.3.1.1 United States
- 5.3.1.2 Canada
- 5.3.1.3 Rest of North America
- 5.3.2 Europe
- 5.3.2.1 Germany
- 5.3.2.2 United Kingdom
- 5.3.2.3 France
- 5.3.2.4 Spain
- 5.3.2.5 Italy
- 5.3.2.6 Russia
- 5.3.2.7 Rest of Europe
- 5.3.3 Asia-Pacific
- 5.3.3.1 China
- 5.3.3.2 India
- 5.3.3.3 Japan
- 5.3.3.4 Australia
- 5.3.3.5 Rest of Asia-Pacific
- 5.3.4 South America
- 5.3.4.1 Brazil
- 5.3.4.2 Argentina
- 5.3.4.3 Rest of South America
- 5.3.5 Middle East
- 5.3.5.1 Saudi Arabia
- 5.3.5.2 United Arab Emirates
- 5.3.5.3 Rest of Middle East
- 5.3.6 Africa
- 5.3.6.1 South Africa
- 5.3.6.2 Nigeria
- 5.3.6.3 Rest of Africa
- 5.3.1 North America
6 Competitive Landscape
- 6.1 Market Concentration
- 6.2 Strategic Moves
- 6.3 Market Share Analysis
- 6.4 Company Profiles (Includes Global Level Overview, Market Level Overview, Core Segments, Financials as Available, Strategic Information, Market Rank/Share for Key Companies, Products and Services, and Recent Developments)
- 6.4.1 Novonesis Group
- 6.4.2 Bioceres Crop Solutions Corp
- 6.4.3 Lallemand, Inc.
- 6.4.4 Premier Tech Ltd. (Gestion Bernard Belanger Ltee)
- 6.4.5 Corteva Agriscience
- 6.4.6 Indian Farmers Fertiliser Cooperative Limited (IFFCO)
- 6.4.7 Krishak Bharati Cooperative Limited (KRIBHCO)
- 6.4.8 Madras Fertilizers Limited (MFL)
- 6.4.9 T. Stanes and Company Limited (Amalgamations Group)
- 6.4.10 String Bio Private Limited
- 6.4.11 UPL Limited
- 6.4.12 Kiwa Bio-Tech Products Group Corporation
- 6.4.13 Protan AG
- 6.4.14 Savio Bio Organic and Fertilizers Private Limited (SBOF)
- 6.4.15 Yara International ASA
- 6.4.16 Coromandel International Limited
- 6.4.17 Sustane Natural Fertilizer, Inc.


