

|
시장보고서
상품코드
2115841
인도의 전기자전거 렌탈 : 시장 점유율 분석, 업계 동향과 통계, 성장 예측(2026-2031년)Indian E-Bike Rental - Market Share Analysis, Industry Trends & Statistics, Growth Forecasts (2026 - 2031) |
||||||
 Mordor Intelligence
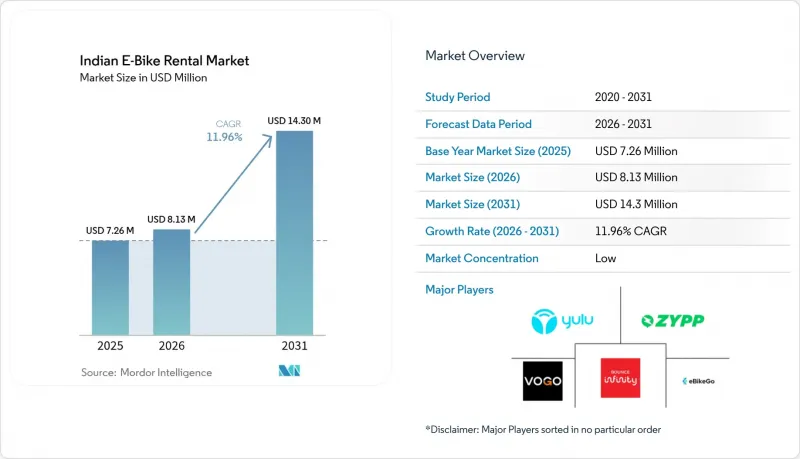
Mordor Intelligence에 따르면 2026년 인도의 전기자전거 렌탈 시장 규모는 813만 달러로 추정되며, 2025년 726만 달러에서 확대되어 2031년에는 1,430만 달러에 달할 것으로 예측됩니다.
2026년부터 2031년까지의 연평균 성장률(CAGR)은 11.96%가 될 것으로 전망됩니다.
본 보고서는 용도별(도시 지역 및 화물·물류), 차량 유형별(페달 보조식 및 스로틀 보조식), 최종사용자별(소비자 대상 B2C 등), 이용 요금제별(시간 단위, 일 단위 등), 배터리 유형별(리튬 이온, 납산, 기타), 및 출력(250W 이하 및 251-500W)별로 분류되어 있습니다. 시장 전망은 금액(달러) 기준으로 제시되어 있습니다.
인도 전기자전거 렌탈 시장의 동향 및 인사이트
FAME-II 및 각 주의 전기자동차 정책에 기반한 정부의 우대 조치
넉넉한 구매 보조금, 요금 면제 및 명확한 배터리 교체 기준 덕분에 총 소유 비용 측면에서 렌탈 이용이 결정적으로 유리합니다. 전력부가 2025년에 수립한 교체 스테이션 상호 운용성 관련 지침은 벤더 락인을 해소하고, 다중 브랜드 차량 운영을 간소화하고 있습니다. 델리의 ‘EV 정책 2.0’은 그린세 및 어그리게이터 라이선스 수수료를 재원으로 하는 전용 기금을 편성하여, 2027년까지 이륜차의 전기화 비용 5분의 4를 충당하는 것을 목표로 하고 있습니다. 서벵골 주는 대폭적인 구매 인센티브와 자동차세 전액 면제를 제공함으로써 전기 모빌리티 노력을 강화하고 있습니다. 그 결과, 사업자들은 현재 기존 스쿠터보다 저렴한 가격으로 전기자전거 렌탈 요금을 책정할 수 있게 되었습니다. 이러한 노력은 안정적인 수요 동향을 창출하고, 차량 대여 자금 조달 파트너를 유치하고 있습니다. 그러나 과거 보조금 프로그램에서 얻은 교훈은, 이처럼 급성장하는 수요를 최대한 활용하기 위해서는 인프라 구축을 협력적으로 추진하는 것이 중요하다는 점을 여실히 보여주고 있습니다.
마이크로모빌리티 스타트업에 대한 벤처 캐피털 자금 조달 및 전략적 투자의 급증
2025년에는 자본 유입이 사상 최고 속도에 도달하며, 과거 하드웨어 규모 확장을 가로막았던 역사적인 자금 격차가 해소되었습니다. Yulu사는 EBITDA 손익분기점을 달성함과 동시에 연간 경상 수익도 확보하여, 투자자들에게 단위 경제성의 건전성을 입증하는 드문 사례를 제시했습니다. 신규 진입 기업인 Greenerg Mobility는 막대한 투자를 유치하고 있으며, 특히 L.G. Balakrishnan &Bros의 지원을 받아 코임바토르에서 구독형 하이브리드 모델을 전개하고 있습니다. 풍부한 자금 덕분에 차량 투자 회수 기간이 단축되고, 사용자 확보 비용이 충당되며, SaaS 텔레매틱스 도입이 가속화되고 있습니다. 대형 배송 기업과의 제휴를 통해 자본이 즉시 활용되며, 매출 총이익률이 유지되고 있습니다. 그러나 자금 소모에 대한 허용도는 기업마다 다릅니다. 독자적인 경쟁 우위를 갖추지 못한 소규모 사업자는 시장의 성숙에 따라 여전히 업계 재편이나 인재 확보를 목적으로 한 인수(아키하이아)의 가능성에 직면해 있습니다.
제한된 공공 충전 및 배터리 교환 인프라의 밀도
2024년 6월 기준, 인도에는 다수의 공공 충전기가 설치되어 있었으나(전기자동차 191대당 약 1기), 그 5분의 3이 5개 주에 집중되어 있습니다. 이러한 집중으로 인해 사업자들은 대도시권을 순회할 수밖에 없어, 인프라가 부족한 2급 도시권으로의 진출이 지연되고 있습니다. 2024년 3월 기준으로 전국적으로 운영되는 배터리 교환 스테이션은 극히 소수에 불과하며, 그 대부분이 특정 자동차 제조사 전용이기 때문에 타 브랜드와의 호환성이 제한되고 있습니다. 도로운송·고속도로부는 각 주를 대상으로 모델 양도 계약을 발행하고 있지만, 시행이 파편화되어 있어 부지 취득 승인이 지연되고 있습니다. 충전망이 충분히 정비되지 않은 상황에서는 플릿 사업자가 대용량 배터리 팩에 과도하게 투자하게 되어 자본 효율성이 저하되고 있습니다. 그 결과 발생하는 비용 전가로 인해, 라이드셰어나 대중교통과 비교했을 때 소비자에게 제공되는 가치 제안이 훼손되는 경우가 많습니다.
부문 분석
2025년 인도 전기자전거 렌탈 시장 매출 중 도시 지역 이동이 83.12%를 차지하고 있으며, 이용자가 밀집된 지역과 단거리 이동 범위의 시너지 효과가 재차 확인되고 있습니다. 대도시권의 서비스 지역에서는 네트워크 효과가 발휘되어, 자산 이용률이 1일당 5-6회 탑승이라는 손익분기점을 상회합니다. 화물·물류 분야의 2025년 시장 규모는 훨씬 작지만, E-Commerce 소포 처리량과 기업의 탄소 중립 로드맵에 편승함으로써 2031년까지 연평균 성장률(CAGR) 12.09%로 급성장하고 있습니다. 2025년 6월부터 델리의 Zomato를 대상으로 운영되고 있는 렌탈 차량 군에 더해, EVIFY의 1,000대 규모의 Hero 차량 군은 교체 가능한 배터리에 적합하며, 주문 내용에 기반한 경로 경제성을 보여주고 있습니다.
도시 지역의 보급률은 내연기관 차량에 벌금을 부과하는 정책적 인센티브와 LEZ(저배출 구역) 규제를 반영하고 있습니다. 충전소 밀도가 높기 때문에 사업자는 텔레매틱스 정보를 활용하여 하루 종일 차량 배치를 재조정할 수 있어 공회전을 최소화할 수 있습니다. 한편, 화물 운송 하위 부문에서는 계약상의 구속력과 예측 가능한 근무 패턴 덕분에 B2C 렌탈에서 흔히 나타나는 주말 수요 부진을 완화하는 안정적인 수요가 확보되고 있습니다. 도시 마스터플랜에 따라 혼잡 통행료가 도입됨에 따라, 대여 자전거는 택시에 비해 더욱 큰 비용 우위를 확보하고 있으며, 대형 밴으로부터 소량 배송 물량을 서서히 빼앗아 가는 소포 배송 차량이 존재하는 상황에서도 도시 지역에서의 우위를 확고히 하고 있습니다.
인도 전기자전거 렌탈 시장에서 2025년 지출의 60.74%를 스로틀 보조 기능이 있는 자전거가 차지하고 있습니다. 이는 부드러운 가속과 페달을 밟지 않아도 되는 편의성이 교통 체증에 시달리는 통근자들에게 지지를 받고 있기 때문입니다. 이 자전거들은 택배 적재량에 적합하지만, 면허, 등록 및 제3자 보험이 필요하여 차량당 규정 준수 비용이 증가하고 있습니다. 한편, 연평균 성장률(CAGR) 12.12%로 확대되고 있는 페달 보조형 자전거는 250W의 출력 상한선을 밑돌기 때문에 면허가 필요하지 않아, 관광지에서는 일반 사용자가 즉시 이용을 시작할 수 있습니다.
사업자들은 대도시권에서는 스로틀과 페달의 비율을 70대 30으로 설정해 차량을 구성하고 있지만, 속도 제한이 적용되는 역사 지구에서는 그 비율을 반대로 바꾸고 있습니다. 모터 효율의 향상으로 인해 페달 보조 모델에서도 배터리를 과도하게 소모하지 않고 도시 지역의 완만한 오르막길을 주행할 수 있게 되어, 성능 차이는 줄어들고 있습니다. 한편, Oben Electric과 같은 OEM 업체들은 출력 대역의 기준치를 알기 쉽게 설명한 간소화된 규정 준수 매트릭스를 공개하고 있으며, 과거에는 차량 압수로 이어지기도 했던 부주의로 인한 규정 위반을 억제하는 것을 목표로 하고 있습니다.
기타 혜택:
- 엑셀 형식의 시장 예측(ME) 시트
- 3개월간의 애널리스트 지원
자주 묻는 질문
목차
제1장 소개
제2장 조사 방법
제3장 주요 요약
제4장 시장 구도
제5장 시장 규모와 성장 예측
제6장 경쟁 구도
제7장 시장 기회와 향후 전망
KSM 26.08.26According to Mordor Intelligence, the indian e-Bike rental market size in 2026 is estimated at USD 8.13 million, growing from 2025 value of USD 7.26 million with 2031 projections showing USD 14.3 million, growing at 11.96% CAGR over 2026-2031.
This report is Segmented by Application Type (Urban/City and Cargo & Logistics), Vehicle Type (Pedal-Assisted and Throttle-Assisted), End User (Consumers B2C and More), Subscription Model (Hourly, Daily, and More), Battery Type (Lithium-Ion, Lead-Acid, and Others), and Power Output (Less Than or Equal To 250 W and 251-500 W). The Market Forecasts are Provided in Terms of Value (USD).
Indian E-Bike Rental Market Trends and Insights
Government Incentives Under FAME-II & State EV Policies
Generous purchase subsidies, fee waivers, and clear battery-swap standards are tilting the total cost of ownership decisively toward rentals. The Ministry of Power's 2025 guidelines on swap-station interoperability cut vendor lock-in and simplify multi-brand fleet operations . Delhi's EV Policy 2.0 earmarks a dedicated fund, sourced from green taxes and aggregator license fees, to finance four-fifth of two-wheeler electrification by 2027. West Bengal is bolstering its electric mobility initiative by offering significant purchase incentives and complete road-tax waivers. As a result, operators can now set e-bike rental prices lower than those of traditional scooters. These initiatives are fostering consistent demand trends, drawing in fleet financing partners. Yet, lessons from previous subsidy programs underscore the importance of a coordinated infrastructure rollout to capitalize on this burgeoning demand.
Surge In VC Funding & Strategic Investments In Micromobility Start-Ups
Capital inflow reached record velocity in 2025, filling a historical funding gap that once throttled hardware scale-up. Yulu hit EBITDA breakeven while delivering annual recurring revenue, giving investors a rare proof point for positive unit economics . Greenerg Mobility, a new entrant, has garnered substantial investments, notably securing support from L.G. Balakrishnan & Bros to launch subscription-based hybrid models in Coimbatore. Ample liquidity shortens fleet payback cycles, subsidizes rider acquisition, and accelerates SaaS telematics rollouts. Partnerships with delivery giants convert capital into immediate utilization, protecting gross margins. Yet cash-burn tolerance varies; smaller operators without unique moats still face consolidation or acqui-hire prospects as the market matures.
Limited Public Charging & Swapping Infrastructure Density
India logged numerous public chargers by June 2024-roughly 1 unit for every 191 EVs-with three-fifths clustered inside five states. Such concentration compels operators to circle megacities, delaying entry into infrastructure-poor tier-2 catchments. Only a few swap stations operated nationally by March 2024, many OEM-exclusive, limiting cross-brand compatibility. The Ministry of Road Transport and Highways has issued model concession agreements for states, yet fragmented execution slows right-of-way approvals. Without dense grids, fleets over-invest in higher-capacity packs that impair capital efficiency. Resulting cost pass-through often erodes the consumer value proposition relative to ride-hailing or public transport.
Other drivers and restraints analyzed in the detailed report include:
- Corporate ESG Goals Accelerating Last-Mile E-Fleet Conversions
- Declining Lithium-Ion Battery Prices Lowering Operator Capex
- High Battery Replacement Costs Squeezing Operator Margins
For complete list of drivers and restraints, kindly check the Table Of Contents.
Segment Analysis
Urban/City trips account for a 83.12% of 2025 revenue for the Indian electric bike rental market, reaffirming the synergy between dense rider pools and short-trip range envelopes. Metropolitan catchments deliver network effects that push asset utilization above the 5-6 rides per day breakeven threshold. Although Cargo & Logistics has a far smaller 2025 base, it is accelerating at 12.09% CAGR to 2031 by piggybacking on e-commerce parcel volumes and corporates' net-zero roadmaps. Rental fleets deployed for Zomato in Delhi since June 2025, plus EVIFY's 1,000-unit Hero fleet, illustrate recipe-driven route economics that suit swappable batteries.
Urban prevalence also mirrors policy incentives and LEZ rules that penalize internal-combustion counterparts. Charge-point density allows operators to rebalance fleets throughout the day using telematics cues, minimizing deadheading. Conversely, cargo sub-verticals enjoy contractual locks and predictable shift patterns, supplying steady demand that dilutes the weekend slump typical in B2C rentals. As city master plans adopt congestion fees, rental bikes gain another cost uptick over taxis, cementing urban primacy even while parcel fleets seize incremental volume from heavyweight vans.
Throttle-assisted bikes accounts for a 60.74% of the 2025 spend within the Indian electric bike rental market share because friction-free acceleration and no-pedal convenience resonate with commuters juggling traffic bursts. They suit courier payloads yet require a license, registration, and third-party insurance, which inflates compliance costs per unit. Pedal-assisted alternatives, expanding at a 12.12% CAGR, slip under the 250 W ceiling and thus bypass licensing, letting casual users onboard instantly at tourist hotspots.
Operators stack fleets with a 70-30 throttle-pedal ratio in metros, but invert the mix in heritage districts where speed caps apply. Motor-efficiency gains now allow pedal-assist models to tackle minimal urban gradients without severe battery drain, shrinking performance gaps. Meanwhile, OEMs like Oben Electric publish simplified compliance matrices to demystify power-band thresholds, hoping to curb accidental regulatory breaches that once led to impounds.
Complete Report Scope:
- By Application Type
- Urban/City
- Cargo & Logistics
- By Vehicle Type
- Pedal-Assisted
- Throttle-Assisted
- By End User
- Consumers (B2C)
- Last-Mile Delivery & Couriers (B2B)
- Tourism & Leisure
- Corporate/Institutional Sharing
- By Subscription Model
- Hourly
- Daily
- Monthly
- Long-term Leasing
- By Battery Type
- Lithium-ion
- Lead-acid
- Others
- By Power Output
- Less than or equal to 250 W
- 251-500 W
List of Companies Covered in this Report:
- Yulu Bikes Pvt Ltd
- Zypp Electric
- Bounce Infinity
- Vogo Rental
- eBikeGo Pvt Ltd
- Rentrip Services Pvt Ltd
- ONN Bikes
- Royal Brothers
- Drivezy
- Rapido EV
- EXA RIDE (EXA Mobility)
- Wheelbros
- Voltium
- Green Drive Mobility (Lithium Urban-Spin)
- Quick Ride
- Chartered Bike
- PedL by Zoomcar
- MYBYK e-fleet
- Mobicy EV
- VahanPay Rentals
Additional Benefits:
- The market estimate (ME) sheet in Excel format
- 3 months of analyst support
TABLE OF CONTENTS
1 Introduction
- 1.1 Study Assumptions & Market Definition
- 1.2 Scope of the Study
2 Research Methodology
3 Executive Summary
4 Market Landscape
- 4.1 Market Overview
- 4.2 Market Drivers
- 4.2.1 Government Incentives Under Fame-LI & State EV Policies
- 4.2.2 Surge In VC Funding & Strategic Investments In Micromobility Start-Ups
- 4.2.3 Corporate ESG Goals Accelerating Last-Mile E-Fleet Conversions
- 4.2.4 Declining Lithium-Ion Battery Prices Lowering Operator Capex
- 4.2.5 Expansion Of Battery-Swapping Hubs Integrated With Rental Fleets
- 4.2.6 Urban Congestion Charges & LEZs Nudging Commuters To E-Bikes
- 4.3 Market Restraints
- 4.3.1 Limited Public Charging & Swapping Infrastructure Density
- 4.3.2 High Battery Replacement Costs Squeezing Operator Margins
- 4.3.3 Regulatory Ambiguity On E-Bike Lane & Helmet Compliance
- 4.3.4 Theft & Vandalism Risk Elevating Insurance Premiums
- 4.4 Value / Supply-Chain Analysis
- 4.5 Regulatory Landscape
- 4.6 Technological Outlook
- 4.7 Porter's Five Forces
- 4.7.1 Threat of New Entrants
- 4.7.2 Bargaining Power of Buyers/Consumers
- 4.7.3 Bargaining Power of Suppliers
- 4.7.4 Threat of Substitute Products
- 4.7.5 Intensity of Competitive Rivalry
5 Market Size & Growth Forecasts (Value (USD))
- 5.1 By Application Type
- 5.1.1 Urban/City
- 5.1.2 Cargo & Logistics
- 5.2 By Vehicle Type
- 5.2.1 Pedal-Assisted
- 5.2.2 Throttle-Assisted
- 5.3 By End User
- 5.3.1 Consumers (B2C)
- 5.3.2 Last-Mile Delivery & Couriers (B2B)
- 5.3.3 Tourism & Leisure
- 5.3.4 Corporate/Institutional Sharing
- 5.4 By Subscription Model
- 5.4.1 Hourly
- 5.4.2 Daily
- 5.4.3 Monthly
- 5.4.4 Long-term Leasing
- 5.5 By Battery Type
- 5.5.1 Lithium-ion
- 5.5.2 Lead-acid
- 5.5.3 Others
- 5.6 By Power Output
- 5.6.1 Less than or equal to 250 W
- 5.6.2 251-500 W
6 Competitive Landscape
- 6.1 Market Concentration
- 6.2 Strategic Moves
- 6.3 Market Share Analysis
- 6.4 Company Profiles (includes Global Level Overview, Market Level Overview, Core Segments, Financials as Available, Strategic Information, Market Rank/Share for Key Companies, Products and Services, SWOT Analysis, and Recent Developments)
- 6.4.1 Yulu Bikes Pvt Ltd
- 6.4.2 Zypp Electric
- 6.4.3 Bounce Infinity
- 6.4.4 Vogo Rental
- 6.4.5 eBikeGo Pvt Ltd
- 6.4.6 Rentrip Services Pvt Ltd
- 6.4.7 ONN Bikes
- 6.4.8 Royal Brothers
- 6.4.9 Drivezy
- 6.4.10 Rapido EV
- 6.4.11 EXA RIDE (EXA Mobility)
- 6.4.12 Wheelbros
- 6.4.13 Voltium
- 6.4.14 Green Drive Mobility (Lithium Urban-Spin)
- 6.4.15 Quick Ride
- 6.4.16 Chartered Bike
- 6.4.17 PedL by Zoomcar
- 6.4.18 MYBYK e-fleet
- 6.4.19 Mobicy EV
- 6.4.20 VahanPay Rentals
7 Market Opportunities & Future Outlook
- 7.1 White-space & Unmet-need Assessment


