

|
시장보고서
상품코드
2116598
북미의 렌터카 시장 : 점유율 분석, 업계 동향과 통계, 성장 예측(2026-2031년)North America Vehicle Rental - Market Share Analysis, Industry Trends & Statistics, Growth Forecasts (2026 - 2031) |
||||||
 Mordor Intelligence
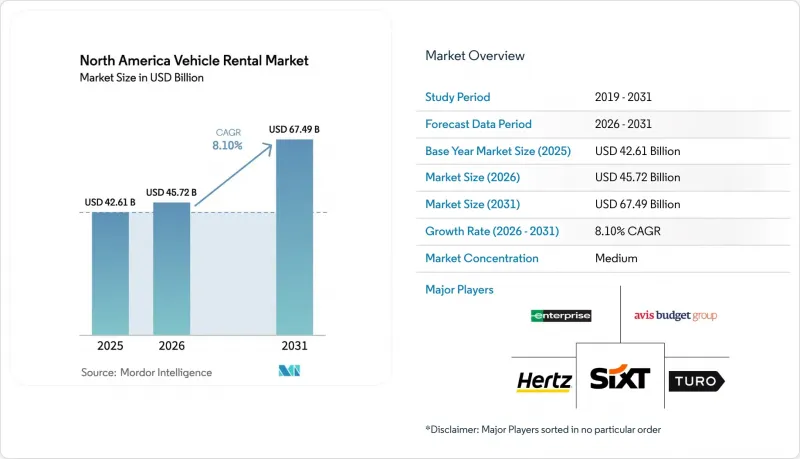
Mordor Intelligence에 의하면, 북미의 렌터카 시장 규모는 2025년에 426억 1,000만 달러로 평가되었고 2026년 457억 2,000만 달러에서 2031년까지 674억 9,000만 달러에 이를 것으로 예측되며, 예측 기간(2026-2031년) CAGR은 8.10%를 나타낼 전망입니다.
본 보고서는 차량 유형(고급차 등), 이용 목적(레저 여행 등), 대여 기간(단기·장기), 예약 유형(온라인·오프라인), 고객 유형(개인 등), 대여 장소(공항 내·공항등), 연료 유형(내연기관 등) 및 국가별로 분류되어 있습니다. 시장 예측은 금액(달러)으로 표시되어 있습니다.
북미 렌터카 시장 동향 및 인사이트
COVID-19 이후 인바운드 레저 여행 증가
2024년, 미국 교통안전청(TSA)의 보안 검색대를 통과한 승객 수는 9억 400만 명에 달하여 사상 최대 연간 총 수치를 기록했습니다. 이러한 급증으로 인해 공항 내 렌터카 이용에 대한 신뢰가 회복되었으며, 북미 렌터카 시장에서 레저 여행의 점유율은 53.62%를 유지했습니다. 또한, 2031년까지의 연평균 성장률(CAGR)은 11.92%로 예측됩니다. 로스앤젤레스, 마이애미, 올랜도 등의 주요 공항은 대서양 횡단 노선 및 라틴아메리카 노선의 승객 수 회복으로 특히 큰 혜택을 받았으며, 그 결과 여러 날 동안 이용하는 스포츠 유틸리티 차량(SUV) 예약이 증가했습니다. 캐나다의 관광지에서도 2024년 여름 성수기에 숙박객 수가 두 자릿수 증가를 기록했습니다. 밀레니얼 세대와 Z세대 여행객들의 ‘블레저(비즈니스와 레저의 융합)’ 체류 기간이 길어짐에 따라 평균 렌탈 기간이 연장되어 수익성 향상에 기여했습니다.
비즈니스 출장자 부문의 강력한 회복
2024년 4분기까지 기업 출장 여행량은 2019년 기준치의 약 90%에 도달했습니다. 빈번하게 출장을 다니는 비즈니스 여행객들이 프리미엄 세단이나 로열티 혜택을 선택함에 따라, 사업자들은 다이내믹 프라이싱을 도입하여 부가 수익 증가를 실현할 수 있었습니다. 엔터프라이즈 홀딩스와 에이비스 버짓 그룹은 2024년 한 해 동안 기업 계정 예약이 전 분기 대비 증가했다고 보고했습니다. CES 2025와 같은 대규모 컨벤션으로 인해 직전 예약이 급증했으나, AI를 활용한 가격 책정을 통해 이를 효과적으로 포착함으로써, 차량 대수 증가세가 완만했음에도 불구하고 이용 가능한 차량 1대당 수익을 끌어올렸습니다.
자동차 제조업체(OEM)의 차량 공급 제약과 높은 취득 비용
반도체 부족으로 인해 2024년 차량 납품이 제한되면서, 각 사업자는 보유 기간 연장이나 잔존 가치 보장을 위한 협상을 할 수밖에 없었습니다. 2024년 미국의 신차 평균 거래 가격은 4만 8,000달러 전후로 형성되어 자본 요건이 증가했습니다. 각 사업자는 노후화된 세단을 고객들에게 인기 있는 스포츠 유틸리티 차량(SUV)으로 교체함으로써 차량 1대당 감가상각비를 억제했으나, OEM이 전동화를 위한 생산 체제 전환을 추진하는 가운데 취득 비용은 여전히 부담으로 남아 있습니다.
부문 분석
북미 렌터카 시장에서 이코노미 차량은 중요한 위치를 차지하고 있으며, 2025년에는 45.18%의 점유율을 기록할 전망입니다. 이러한 우위는 주로 법인 계약 및 비용을 중시하는 레저 여행객들 수요에 의해 뒷받침되고 있습니다. 그러나 스포츠 유틸리티 차량(SUV)과 크로스오버 차량은 가장 빠르게 성장하는 부문으로서 급속히 성장세를 보이고 있습니다. 공간, 쾌적성, 그리고 모든 기상 조건에서의 신뢰성을 중시하는 가족 단위 여행객 및 외국인 관광객 수요에 힘입어, 2031년까지 연평균 성장률(CAGR) 10.68%를 나타낼 것으로 예측됩니다.
각 업체들은 구매 및 보험 비용이 높음에도 불구하고, 스포츠 유틸리티 차량(SUV)의 비중을 늘리기 위해 차량 구성을 조정하는 경향이 강해지고 있습니다. 이러한 차량은 가동률이 높고 일일 평균 렌탈 요금도 높기 때문에 수익성이 높은 선택지가 되고 있습니다. 프리미엄 차량 및 고급 차량은 시장 점유율은 작지만, 특히 도시 지역이나 휴양지에서 높은 수익률을 기록하고 있습니다. 또한, 다목적 차량과 소형 밴은 단체 여행이나 업무용 이동과 같은 틈새 수요를 지속적으로 충족시키고 있습니다.
레저 여행은 시장의 주요 부문으로서 입지를 확고히 하고 있으며, 2025년에는 53.62%라는 큰 점유율을 차지할 것으로 전망됩니다. 이 부문은 견조한 인바운드 관광과 장기 휴가 여행 증가 추세에 힘입어 2031년까지 연평균 성장률(CAGR) 11.92%라는 눈부신 성장이 예상됩니다. 또한, 비즈니스와 레저를 결합한 ‘블레저(bleisure)’ 여행의 부상으로 대여 기간이 더욱 연장되어 거래당 수익이 직접적으로 향상되고 있습니다.
한편, 비즈니스 여행은 신뢰할 수 있는 두 번째 수요 축으로서 안정적이며, 평일 이용객 수를 뒷받침하고 건당 수익률을 높이고 있습니다. 기업의 출장 수준은 팬데믹 이전의 정점보다 낮지만, 사업자에게는 계약에 따른 거래와 로열티에 기반한 재이용에 힘입어 이익률이 안정된다는 이점이 있습니다.
2025년에는 단기 대여가 시장의 79.94%라는 큰 점유율을 차지하며, 일 단위나 주 단위의 예약을 선호하는 레저 여행객과 비즈니스 여행객 모두에게 그 매력이 두드러지고 있습니다. 이러한 렌탈 업체들은 동적 가격 책정(다이나믹 프라이싱)을 능숙하게 활용하여, 계절적 성수기나 주요 행사에 따른 수요 급증을 효과적으로 포착하고 있습니다. 단기 렌탈의 우위는 막바지 예약에 대한 대응 능력과 이코노미 차량부터 프리미엄 차량에 이르기까지 폭넓은 선택지를 제공할 수 있다는 점에서도 뒷받침되며, 다양한 여행객의 요구를 충족시키는 최적의 선택지가 되고 있습니다.
장기 렌탈은 구독 모델과 함께 연평균 성장률(CAGR) 13.35%라는 견실한 성장이 예상됩니다. 이러한 성장은 기존의 소유보다 유연성을 중시하는 소비자의 인식 변화와 긱 경제(gig economy)에서 비롯된 수요 증가에 의해 주도되고 있습니다. 또한, 원격 근무가 보편화됨에 따라 개인과 가족이 유연한 생활 방식을 추구하게 되면서 장기 렌터카 솔루션에 대한 수요가 확대되고 있습니다. 아울러 사업자 측은 보험 및 정비 서비스를 포함한 정액 요금제를 통해 고객 유지율을 높이고 안정적이며 지속적인 수익을 확보하고 있으며, 이는 소비자에게도 편의성과 부가가치를 제공합니다.
기타 혜택:
- 엑셀 형식 시장 예측(ME) 시트
- 3개월간의 애널리스트 지원
자주 묻는 질문
목차
제1장 서론
제2장 조사 방법
제3장 개요
제4장 시장 구도
제5장 시장 규모와 성장 예측
제6장 경쟁 구도
제7장 시장 기회와 향후 전망
JHS 26.09.01According to Mordor Intelligence, the north american vehicle rental market size was valued at USD 42.61 billion in 2025 and estimated to grow from USD 45.72 billion in 2026 to reach USD 67.49 billion by 2031, at a CAGR of 8.10% during the forecast period (2026-2031).
This report is Segmented by Vehicle Type (Luxury Cars, and More), Application Type (Leisure Travel, and More), Rental Duration (Short-Term and Long-Term), Booking Type (Online and Offline), Customer Type (Individual and More), Rental Location (On-Airport and Off-Airport), Fuel Type (Internal Combustion Engine and More), and Country. Market Forecasts are in Value (USD).
North America Vehicle Rental Market Trends and Insights
Rise in Inbound Leisure Travel Post-COVID-19
Passenger throughput at Transportation Security Administration checkpoints reached 904 million in 2024, the highest annual total on record. The surge restored confidence in airport rentals and maintained leisure's 53.62% share of the North America vehicle rental market, with a projected 11.92% CAGR through 2031. Gateway airports such as Los Angeles, Miami, and Orlando benefited disproportionately from recovering trans-Atlantic and Latin American traffic, translating to higher multi-day sport utility vehicle (SUV) bookings. Canadian destinations also logged double-digit growth in overnight visitors during the 2024 summer peak. Extended "bleisure" stays among millennial and Gen Z travelers lengthened average rental durations and supported yield improvements.
Strong Rebound of Corporate Road-Warrior Segment
Corporate travel volumes reached about 90% of 2019 benchmarks by Q4 2024. High-frequency road warriors chose premium sedans and loyalty perks, enabling operators to deploy dynamic pricing and earn higher ancillary revenue. Enterprise Holdings and Avis Budget Group reported sequential gains in corporate account bookings during 2024. Large conventions such as CES 2025 drove short-notice spikes that AI-based pricing captured, lifting revenue per available car even with modest fleet growth.
OEM Vehicle Supply Constraints and High Acquisition Costs
Semiconductor shortages curbed 2024 fleet deliveries, forcing operators to extend holding periods and negotiate residual-value guarantees. Average new-vehicle transaction prices in the United States hovered near USD 48,000 in 2024, increasing capital requirements. Operators narrowed depreciation per unit by replacing aging sedans with customer-preferred sport utility vehicles, yet acquisition costs remain a drag while original equipment manufacturers retool for electrification.
Other drivers and restraints analyzed in the detailed report include:
- Airport Infrastructure Modernization Boosting On-Airport Rentals
- EV-Focused Fleet Incentives Under United States Inflation Reduction Act (IRA) and the Canadian Zero-Emission Vehicle (ZEV) Mandates
- Rising Insurance Premiums and Liability-Claims Inflation
For complete list of drivers and restraints, kindly check the Table Of Contents.
Segment Analysis
Economy vehicles hold a significant position in North America's vehicle rental market, accounting for a 45.18% share in 2025. This dominance is primarily driven by corporate contracts and the demand from cost-sensitive leisure travelers. However, sport utility vehicles and crossovers are rapidly gaining traction as the fastest-growing segment. They are projected to grow at a 10.68% CAGR through 2031, fueled by the preferences of families and inbound tourists who prioritize space, comfort, and all-weather reliability.
Operators are increasingly adjusting their fleet composition to include more sport utility vehicles, despite the higher costs associated with acquisition and insurance. These vehicles offer better utilization rates and command higher average daily rates, making them a lucrative choice. Premium and luxury vehicles, although representing a smaller share of the market, deliver higher margins, particularly in urban and resort areas. Additionally, multi-purpose vehicles and light vans continue to address the specific needs of group travel and commercial mobility niches.
Leisure travel has established itself as the leading segment in the market, holding a significant 53.62% share in 2025. This segment is anticipated to grow at an impressive 11.92% CAGR through 2031, driven by robust inbound tourism and the increasing trend of extended holiday travel. Additionally, the rise of "bleisure" travel, which combines business and leisure, is further extending rental durations and directly enhancing revenue per transaction.
On the other hand, business travel has stabilised as a reliable secondary demand pillar, contributing steady weekday volumes and generating a higher yield per rental. Although corporate travel levels remain below pre-pandemic peaks, operators benefit from margin stability supported by negotiated accounts and loyalty-driven repeat usage.
In 2025, short-term rentals commanded a significant 79.94% share of the market, underscoring their appeal to both leisure and business travelers, who favor daily and weekly bookings. These rentals adeptly leverage dynamic pricing, capitalizing on seasonal peaks and surges driven by major events. The dominance of short-term rentals is further supported by their ability to cater to last-minute bookings and provide a wide range of options, from economy cars to premium vehicles, making them a preferred choice for diverse traveler needs.
Long-term rentals, alongside subscription models, are set to expand at a robust 13.35% CAGR. This growth is fueled by a consumer shift towards valuing flexibility over traditional ownership and a rising demand from the gig economy. Additionally, the increasing adoption of remote work has amplified the demand for long-term rental solutions, as individuals and families seek adaptable living arrangements. Furthermore, operators are enhancing customer retention and securing stable, recurring revenue through bundled pricing that encompasses insurance and maintenance services, which also adds convenience and value for consumers.
Complete Report Scope:
- By Vehicle Type
- Luxury Cars
- Economy Cars
- SUVs and Crossovers
- Multi-Purpose Vehicles (MPV)
- Light Commercial Vans
- By Application Type
- Leisure Travel
- Business/Commercial Travel
- Local Usage (In-city)
- Outstation/Inter-city
- By Rental Duration
- Short-Term (Under 30 days)
- Long-Term/Subscription (30 days or more)
- By Booking Type
- Online
- Offline
- By Customer Type
- Individual
- Corporate Fleet Accounts
- By Rental Location
- On-Airport
- Off-Airport
- By Fuel Type
- Internal Combustion Engine (ICE)
- Hybrid
- Battery Electric Vehicle (BEV)
- By Country
- United States
- Canada
- Rest of North America
List of Companies Covered in this Report:
- Enterprise Holdings, Inc.
- Avis Budget Group, Inc.
- Hertz Global Holdings, Inc.
- Sixt SE
- Europcar Mobility Group
- Turo Inc.
- Getaround, Inc.
- Kyte Systems Inc.
- Flexcar, Inc.
- HyreCar Inc.
- Routes Car Rental
Additional Benefits:
- The market estimate (ME) sheet in Excel format
- 3 months of analyst support
TABLE OF CONTENTS
1 Introduction
- 1.1 Study Assumptions and Market Definition
- 1.2 Scope of the Study
2 Research Methodology
3 Executive Summary
4 Market Landscape
- 4.1 Market Overview
- 4.2 Market Drivers
- 4.2.1 Rise in Inbound Leisure Travel Post-COVID-19
- 4.2.2 Strong Rebound of Corporate Road-Warrior Segment
- 4.2.3 Airport Infrastructure Modernisation Boosting On-Airport Rentals
- 4.2.4 EV-Focused Fleet Incentives Under United States Inflation Reduction Act (IRA) and the Canadian Zero-Emission Vehicle (ZEV) Mandates
- 4.2.5 Peer-to-Peer Car-Sharing Platforms Unlocking Latent Supply
- 4.2.6 AI-Driven Dynamic Pricing Lifting Revenue per Available Car (RevPAC)
- 4.3 Market Restraints
- 4.3.1 OEM Vehicle Supply Constraints and High Acquisition Costs
- 4.3.2 Rising Insurance Premiums and Liability-Claims Inflation
- 4.3.3 Urban Modal Shift Toward Ride-Hailing and Micro-Mobility
- 4.3.4 Airport Surcharges and Environmental Levies Squeezing Margins
- 4.4 Value/Supply-Chain Analysis
- 4.5 Regulatory Landscape
- 4.6 Technological Outlook
- 4.7 Porter's Five Forces
- 4.7.1 Threat of New Entrants
- 4.7.2 Bargaining Power of Buyers/Consumers
- 4.7.3 Bargaining Power of Suppliers
- 4.7.4 Threat of Substitute Products
- 4.7.5 Intensity of Competitive Rivalry
5 Market Size and Growth Forecasts (Value (USD))
- 5.1 By Vehicle Type
- 5.1.1 Luxury Cars
- 5.1.2 Economy Cars
- 5.1.3 SUVs and Crossovers
- 5.1.4 Multi-Purpose Vehicles (MPV)
- 5.1.5 Light Commercial Vans
- 5.2 By Application Type
- 5.2.1 Leisure Travel
- 5.2.2 Business/Commercial Travel
- 5.2.3 Local Usage (In-city)
- 5.2.4 Outstation/Inter-city
- 5.3 By Rental Duration
- 5.3.1 Short-Term (Under 30 days)
- 5.3.2 Long-Term/Subscription (30 days or more)
- 5.4 By Booking Type
- 5.4.1 Online
- 5.4.2 Offline
- 5.5 By Customer Type
- 5.5.1 Individual
- 5.5.2 Corporate Fleet Accounts
- 5.6 By Rental Location
- 5.6.1 On-Airport
- 5.6.2 Off-Airport
- 5.7 By Fuel Type
- 5.7.1 Internal Combustion Engine (ICE)
- 5.7.2 Hybrid
- 5.7.3 Battery Electric Vehicle (BEV)
- 5.8 By Country
- 5.8.1 United States
- 5.8.2 Canada
- 5.8.3 Rest of North America
6 Competitive Landscape
- 6.1 Market Concentration
- 6.2 Strategic Moves and Funding
- 6.3 Market Share Analysis
- 6.4 Company Profiles (Includes Global level Overview, Market level Overview, Core Segments, Financials as Available, Strategic Information, Market Rank/Share for Key Companies, Products and Services, SWOT Analysis, and Recent Developments)
- 6.4.1 Enterprise Holdings, Inc.
- 6.4.2 Avis Budget Group, Inc.
- 6.4.3 Hertz Global Holdings, Inc.
- 6.4.4 Sixt SE
- 6.4.5 Europcar Mobility Group
- 6.4.6 Turo Inc.
- 6.4.7 Getaround, Inc.
- 6.4.8 Kyte Systems Inc.
- 6.4.9 Flexcar, Inc.
- 6.4.10 HyreCar Inc.
- 6.4.11 Routes Car Rental
7 Market Opportunities and Future Outlook
- 7.1 White-space and Unmet-Need Assessment


