
|
시장보고서
상품코드
2118040
OTT 프로그래매틱 광고 시장 : 시장 점유율 분석, 업계 동향 및 통계, 성장 예측(2026-2031년)OTT Programmatic Advertising - Market Share Analysis, Industry Trends & Statistics, Growth Forecasts (2026 - 2031) |
||||||
 Mordor Intelligence
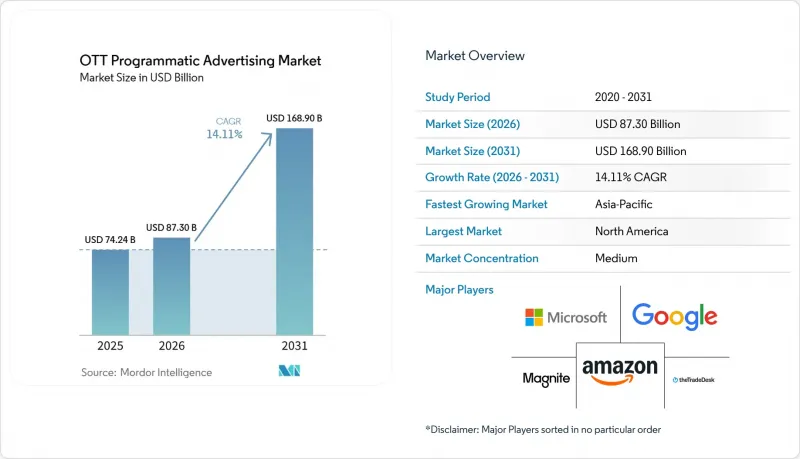
Mordor Intelligence에 의하면, OTT 프로그래매틱 광고 시장 규모는 2025년 742억 4,000만 달러로 평가되었고, 2026년 873억 달러에서 2031년까지 1,689억 달러로 확대될 것으로 예측되며, 2026-2031년 CAGR 14.11%를 기록할 전망입니다.
본 보고서는 플랫폼 유형별(실시간 입찰, 프라이빗 마켓플레이스, 프로그래매틱 게런티드 등), 광고 형식별(동영상 광고, 디스플레이 광고, 인터랙티브 광고 등), 기기 유형별(스마트폰, 태블릿 등), 최종 사용자 산업별(미디어 및 엔터테인먼트, 소매·이커머스, 자동차 등) 및 지역별로 분류되어 있습니다. 시장 예측은 금액(달러) 기준으로 제시되어 있습니다.
세계의 OTT 프로그래매틱 광고 시장 동향 및 인사이트
CTV 주도의 프로그래매틱 광고비 확대
커넥티드 TV(CTV)는 OTT 프로그래매틱 광고 시장에서 가장 뚜렷한 수요 동력이 되고 있으며, 광고주가 TV, 동영상, 퍼포먼스 광고 예산을 각 스크린 간에 어떻게 배분할지에 대한 방식을 변화시키고 있습니다. Premion과 Advertiser Perceptions의 보고서에 따르면, 대다수의 CTV 광고주들이 지출 증가를 예상하고 있으며, 이는 예산 확대가 일부 얼리 어답터에 국한되지 않음을 보여줍니다. 동 조사에 따르면, CTV 및 OTT 거래량의 상당 부분이 프로그래매틱을 통해 이루어질 것으로 예측되는 한편, 통합형 하이브리드 구매 팀이 CTV 예산의 대부분을 관리하고 있는 것으로도 밝혀졌습니다. 이는 자동화가 전문 채널이 아닌 업무상의 표준으로 자리 잡고 있음을 시사합니다. 또한 IAB의 조사에 따르면, CTV 지출을 늘리고 있는 많은 광고주들이 그 증가분을 선형 TV 예산에서 충당하고 있는 것으로 밝혀졌으며, 이는 OTT 프로그래매틱 광고 시장이 완전히 새로운 광고 수요를 기다리는 것이 아니라 기존 미디어 풀의 자금을 흡수하고 있음을 뒷받침합니다. 동시에, CTV에 투자하는 중소규모 광고주의 참여가 현저히 증가하고 있으며, 구매자층도 확대되고 있습니다. 이는 도구가 셀프 서비스화되고 관리가 용이해짐에 따라 진입 장벽이 낮아지고 있음을 의미합니다. 예산 조달원의 변화, 프로그래매틱 처리량 증가, 그리고 구매자 참여 확대가 맞물리면서 OTT 프로그래매틱 광고 시장은 가입자 수만으로는 추측할 수 있는 것보다 더 강력한 수요 양상을 보이고 있습니다.
써드파티 쿠키 폐지가 퍼스트파티 타겟팅을 가속화
써드파티 쿠키를 둘러싼 불확실성은 더 이상 단일 플랫폼의 문제에 그치지 않고, 더 광범위한 신호 품질 문제로 발전했습니다. 이에 따라 광고주들은 견고하고 허가에 기반한 신원 확인 체계를 갖춘 환경을 선호하게 되었습니다. 2025년 4월, 구글이 크롬에서 써드파티 쿠키를 완전히 폐지하지 않기로 결정함에 따라 기술적인 의문점 중 하나는 해소되었지만, 사파리의 제한, 파이어폭스의 쿠키 분할, 그리고 동의에 따른 데이터 유출로 인해 디지털 광고의 많은 분야에서 활용 가능한 오디언스 신호는 여전히 축소되고 있습니다. 이러한 변화는 OTT 프로그래매틱 광고 시장에 비교우위를 가져다줍니다. 스트리밍 서비스는 일반적으로 브라우저 쿠키에만 의존하지 않고, 구독자 정보나 앱 로그인 정보를 바탕으로 오디언스를 인식하기 때문입니다. 또한, 화면이나 세션을 넘나들며 개인정보 보호 규정을 준수하는 오디언스 매칭을 유지할 수 있는 방송사, 통신사, 플랫폼과의 파트너십 가치도 높아지고 있습니다. 그 결과, 광고 예산이 사라지는 것이 아니라, 더 충실한 동의 획득 데이터, 더 견고한 ID 지속성, 그리고 더 깨끗한 인증 프레임워크를 갖춘 퍼블리셔나 인벤토리 소유자로 이동하고 있습니다. 실제로, 이를 통해 OTT 프로그래매틱 광고 시장은 이전에는 신뢰성이 낮은 오픈 웹 타겟팅 신호나 불안정한 오디언스 식별에 의존하던 예산을 확보할 수 있게 되었습니다.
개인정보 보호 조치로 인한 신호 상실이 오디언스 그래프를 제한
신호 손실은 더 이상 일시적인 조정 문제가 아니라, OTT 프로그래매틱 광고 시장, 특히 로그인 깊이가 얕거나 사용자와의 관계가 지속적이지 않은 인벤토리에 있어 지속적인 압박 요인이 되고 있습니다. Safari의 제한, Firefox의 쿠키 파티셔닝, 동의에 기반한 옵트아웃, 모바일 식별자 재설정 등은 모두 광범위한 디지털 생태계 전반에서 오디언스 매칭에 활용 가능한 주소 지정 가능한 데이터의 양을 감소시키고 있습니다. 이로 인해 인증된 구독자 환경에 의존할 수 있는 프리미엄 스트리밍 플랫폼과, 오디언스 매칭률 및 CPM 지원이 취약한 롱테일 OTT 및 FAST 인벤토리 간에 뚜렷한 격차가 발생하고 있습니다. 콤스코어의 조사에 따르면, 많은 응답자가 문맥 타겟팅을 강화할 계획인 것으로 나타났는데, 이는 많은 구매자들이 상실된 크로스 플랫폼 인식을 완전히 대체하기보다는 ID 정확도 저하에 적응하려고 하고 있음을 보여줍니다. 이와 같은 환경에서는 빈도 관리도 어려워집니다. 이는 ID 기반의 약화로 인해 여러 스트리밍 서비스와 기기에 걸친 중복 노출을 제어하기 어려워지기 때문입니다. 그 결과, OTT 프로그래매틱 광고 시장은 여전히 성장을 이어가고 있지만, 그 성장의 상당 부분은 더 엄격한 개인정보 보호 조건 하에서도 오디언스의 유용성을 유지할 수 있는 데이터가 풍부한 플랫폼에 집중되고 있습니다.
부문 분석
2025년에는 실시간 입찰(RTB)이 38.44%라는 최대 플랫폼 점유율을 차지했으나, OTT 프로그래매틱 광고 시장에서는 프로그래매틱 게런티드가 2031년까지 연평균 성장률(CAGR) 14.43%로 가장 빠른 성장을 기록할 것으로 예측됩니다. 실시간 입찰이 선두를 유지한 이유는 광범위한 수요 풀에서 디지털 비디오 및 커넥티드 TV 인벤토리에 대한 기본 거래 방식으로 오랫동안 기능해 왔기 때문입니다. 많은 광고주가 유연성을 유지하고, 테스트 활동을 신속하게 확대하며, 예산을 조기에 확정하지 않은 상태에서 퍼블리셔 간의 인벤토리 실적을 비교하기 위해 RTB를 활용하고 있기 때문에 이러한 기존 관행은 여전히 중요하게 여겨지고 있습니다. 하지만 OTT 프로그래매틱 광고 시장의 중심은 가격, 전달, 오디언스 품질을 보다 세밀하게 제어할 수 있는 프리미엄 인벤토리 구조로 이동하고 있습니다. 이것이 바로 프리미엄 스트리밍 서비스 운영자들이 수익의 안정성이나 인벤토리 관리의 엄격함을 희생하지 않으면서 디지털 광고 운영을 추구함에 따라, 프로그래매틱 게런티드가 다른 플랫폼 유형보다 빠르게 성장하고 있는 이유입니다.
프로그래매틱 게런티드가 주목을 받고 있는 이유는 퍼블리셔에게 고정 가격의 확실성과 노출 보장을 제공하면서도 브랜드 광고주가 디지털 인프라에 기대하는 타겟팅, 보고서, 워크플로우의 효율성을 유지할 수 있기 때문입니다. 이러한 균형은 프리미엄 퍼블리셔가 수익성과 구매자의 신뢰를 동시에 지켜야 하는 OTT 프로그래매틱 광고 업계에서 중요합니다. 프라이빗 마켓플레이스의 활동도 여전히 중요한데, 이는 검증된 구매자에게 브랜드 안전성이 보장된 인벤토리 풀에 대한 접근을 제공하며, 일반적으로 오픈 옥션 경로보다 높은 가격 책정과 우수한 캠페인 품질을 실현할 수 있기 때문입니다. 구매자가 동일한 거래 경로에서 검증된 공급, 오디언스 패키징 및 낭비 감소를 요구함에 따라 큐레이션형 마켓플레이스의 중요성이 높아지고 있으며, 이는 차별화되지 않은 오픈 익스체인지 구매에서 벗어나는 추세를 부추기고 있습니다. 프리퍼드 딜은 여전히 특정 이용 사례를 대상으로 하고 있지만, OTT 프로그래매틱 광고 시장의 전반적인 방향성은 자동화와 보다 엄격한 인벤토리 거버넌스를 결합한 거래 모델로 나아가고 있습니다.
2025년에는 OTT 프로그래매틱 광고 시장에서 동영상 광고가 부문 매출의 55.26%를 차지한 것으로 평가되었으며, 인터랙티브 광고는 2031년까지 연평균 성장률(CAGR) 14.57%로 성장할 것으로 전망됩니다. OTT는 전체 화면 동영상 시청을 기반으로 하기 때문에 동영상은 여전히 주류 포맷이며, 프리롤 및 미드롤 광고 슬롯은 대부분의 프리미엄 스트리밍 환경에서 여전히 네이티브 수익화 단위로 자리 잡고 있습니다. 이러한 기반은 광고주들이 이미 익숙해져 있는 점에서도 혜택을 받고 있습니다. 많은 브랜드 바이어들은 캠페인이 디지털 시스템을 통해 실행되더라도 여전히 TV의 관점에서 OTT 성과를 평가하고 있기 때문입니다. 따라서 동영상의 강점은 제품-시장 적합성과 편안한 시청 환경에서의 영상, 음성, 움직임에 대한 바이어들의 오랜 신뢰감을 모두 반영하고 있습니다. 동시에 가장 빠른 성장세를 보이고 있는 것은 프리미엄 시각적 맥락을 훼손하지 않으면서 시청 경험에 상호작용과 성과상의 편의성을 더하는 형식으로 이동하고 있습니다.
인터랙티브 광고가 확대되고 있는 이유는 일시 정지 광고, 쇼핑 가능한 오버레이, 세컨드 스크린의 커머스 링크 등이 수동적인 노출을 측정 가능한 행동의 기회로 전환하고, 비즈니스 성과와의 연관성을 쉽게 만들 수 있기 때문입니다. IAB 보고서에 따르면, 2026년에는 TV 및 동영상 광고 구매자들에게 있어 구매의 최우선 기준이 컨텐츠 품질에서 타겟팅 기능으로 바뀌었으며, 이는 전년 대비 10포인트 상승한 수치입니다. 이는 데이터에 즉각 대응하고 성과를 중시하는 광고 형식으로의 광범위한 전환을 뒷받침하는 것입니다. 이러한 변화는 광범위한 도달 범위뿐만 아니라 측정 가능한 성과와 신속한 학습 루프를 중시하는 중소규모 광고주에게 특히 중요합니다. 홈 화면 배너나 일시 정지 상태에서의 노출을 포함한 디스플레이 광고 슬롯 역시 OTT 프로그래매틱 광고 시장의 상업적 범위를 확대되고 있습니다. 특히, 2026년 5월 Equativ와 Titan OS가 유럽 및 남미에서 커넥티드 TV용 프로그래매틱 홈 화면 동영상 솔루션을 출시한 이후, 이러한 경향은 더욱 두드러지고 있습니다. 오직 오디오로만 구성된 프리롤 및 기타 소규모 오버레이 형식은 여전히 규모가 작지만, 유연한 인벤토리 구성이 효과적인 FAST 및 라디오 관련 스트리밍 카테고리에서는 수익 창출을 지원하고 있습니다.
지역별 분석
2025년, 북미는 OTT 프로그래매틱 광고 시장 점유율의 40.56%를 차지했으며, 여전히 지역별 최대 수익 기반을 유지했습니다. 이 지역은 커넥티드 TV 하드웨어의 높은 보급률, 성숙한 DSP 및 SSP 인프라, 그리고 이미 자동 수익화에 대응하고 있는 고밀도의 프리미엄 퍼블리셔 기반이라는 강점을 활용하고 있습니다. 2026년 1월, The Trade Desk가 AccuWeather, The Guardian, Hearst, Newsweek, BuzzFeed 등의 파트너와 공동으로 ‘OpenAds’를 출범시킨 것은 이 지역이 직접적이고 투명성이 더 높은 경매 설계에서도 주도적인 역할을 하고 있음을 보여줍니다. 또한 북미에서는 다른 많은 지역에 비해 바이사이드의 부정 방지 대책이 더욱 철저하여, 이를 통해 프리미엄 커넥티드 TV 예산이 낭비되는 것을 방지하는 데 도움이 되고 있습니다. Pixalate의 보고서에 따르면, 2025년 4분기 미국 내 커넥티드 TV의 무효 트래픽 비율은 19%로, 제공된 자료에서 추적된 주요 세계 시장 중 가장 낮은 수치였습니다. 이는 북미가 운영 측면에서 가장 성숙한 지역 거점이라는 입지를 뒷받침합니다.
아시아태평양은 2031년까지 연평균 성장률(CAGR) 14.72%를 나타낼 것으로 예측되며, OTT 프로그래매틱 광고 시장에서 가장 빠르게 성장하는 지역 블록이 될 전망입니다. 이러한 성장은 인도와 동남아시아에서 스트리밍이 보급되고 있는 데 더해, 한국과 호주에서 커넥티드 TV 이용이 확대됨에 따라 주도되고 있습니다. IAB SEA와 인도 CTV·OTT 협의회는 2025년, 해당 지역 마케터의 74%가 커넥티드 TV 및 OTT에 대한 투자를 늘릴 계획이라고 밝혔습니다. 이는 수요가 단일 국가가 아닌 여러 국내 시장에 걸쳐 확대되고 있음을 보여줍니다. 아시아 비디오 산업 협회(AVIA)는 2026년, 프리미엄 비디오 온 디맨드(VOD)가 2025-2030년 아시아태평양 전체에서 125억 달러의 증분 성장 수익을 창출하여 2030년 말까지 520억 달러에 달할 것으로 예측했습니다. 이는 프로그래매틱 광고 구매자들이 주목하고 있는 시청자층의 규모가 얼마나 큰지를 뒷받침합니다. 한편, Pixalate의 보고서에 따르면 2026년 1분기 아시아태평양의 커넥티드 TV 무효 트래픽 비율은 58%에 달했습니다. 이는 해당 지역의 급속한 성장에 따라 구매자들이 품질 리스크를 보다 적절하게 관리할 수 있는 큐레이션형 및 프라이빗 마켓플레이스 구조로 전환하고 있음을 의미합니다.
유럽, 중동 및 아프리카, 남미에서는 성숙도에 차이가 보이지만, 유럽은 규모, 거버넌스, 그리고 부정 행위에 대한 민감도 면에서 두드러집니다. 독일의 OVK와 BVDW는 2026년 프로그래매틱 광고 수익이 60억 유로(제시된 환율 기준으로 68억 4,000만 달러에 해당)를 넘어 독일 온라인 디스플레이 및 동영상 광고 수익 전체의 80%를 차지할 것으로 예측했습니다. 이는 유럽 최대 규모의 디지털 광고 시장 중 하나에서 자동화가 이미 표준 운영 모델이 되었음을 보여줍니다. Pixalate의 기록에 따르면, 2026년 1분기 커넥티드 TV의 무효 트래픽 비율은 영국에서 46.1%, 독일에서 44%였습니다. 이는 수요가 성숙해졌더라도 브랜드 안전성 대책 및 공급 측 검증이 여전히 필요하다는 점을 보여줍니다. 중동 및 아프리카, 남미는 OTT 프로그래매틱 광고 시장에서 여전히 초기 단계에 있으며, 도입은 증가 추세에 있지만 인프라 구축 현황, 프리미엄 퍼블리셔의 대응 상황, 그리고 현지 프로그래매틱 기준은 국가마다 여전히 크게 다릅니다.
기타 혜택 :
- 엑셀 형식 시장 예측(ME) 시트
- 3개월간의 애널리스트 지원
자주 묻는 질문
목차
제1장 서론
제2장 조사 방법
제3장 주요 요약
제4장 시장 구도
제5장 시장 규모 및 성장 예측
제6장 경쟁 구도
제7장 시장 기회 및 향후 전망
AJY 26.09.03According to Mordor Intelligence, the OTT programmatic advertising market size is projected to expand from USD 74.24 billion in 2025 and USD 87.30 billion in 2026 to USD 168.90 billion by 2031, registering a CAGR of 14.11% between 2026 to 2031.
This report is Segmented by Platform Type (Real-Time Bidding, Private Marketplace, Programmatic Guaranteed, and More), Ad Format (Video Ads, Display Ads, and Interactive Ads), Device Type (Smartphones and Tablets, and More), End-User Industry (Media and Entertainment, Retail and E-Commerce, Automotive, and More), and Geography. The Market Forecasts are Provided in Terms of Value (USD).
Global OTT Programmatic Advertising Market Trends and Insights
CTV-Led Programmatic Spend Expansion
Connected television has become the clearest demand engine inside the OTT programmatic advertising market, and it is changing how advertisers split television, video, and performance budgets across screens. Premion and Advertiser Perceptions reported that most CTV advertisers expected to increase spending, which shows that budget growth is not limited to a narrow set of early adopters. The same study found that a significant share of CTV and OTT volume was projected to transact programmatically, while integrated hybrid buying teams controlled a large portion of CTV budgets, which points to automation becoming the operational norm rather than a specialist channel. The IAB also found that many advertisers increasing CTV spending were funding that rise from linear television budgets, which confirms that the OTT programmatic advertising market is absorbing money from legacy media pools instead of waiting for entirely new ad demand. The buyer base is broadening at the same time, as participation from small advertisers investing in CTV has increased notably, which means access barriers are falling as tools become more self-serve and easier to manage. This mix of shifting budget origin, higher programmatic throughput, and wider buyer participation gives the OTT programmatic advertising market a stronger demand profile than subscriber counts alone would suggest.
Third-Party Cookie Deprecation Accelerating First-Party Targeting
Third-party cookie uncertainty stopped being a single platform issue and became a broader signal quality issue, which has pushed advertisers to favor environments with durable, permissioned identity foundations. Google's April 2025 decision not to fully deprecate third-party cookies in Chrome settled one technical question, but Safari restrictions, Firefox cookie partitioning, and consent-led data loss still narrowed usable audience signals across much of digital advertising. That shift creates a comparative advantage for the OTT programmatic advertising market because streaming services usually anchor audience recognition in subscriber or app logins rather than browser cookies alone. It also increases the value of broadcaster, telecom, and platform partnerships that can sustain privacy-compliant audience matching across screens and sessions. The result is that spend does not disappear, but it moves toward publishers and inventory owners with better consented data depth, stronger identity persistence, and cleaner authentication frameworks. In practice, this is helping the OTT programmatic advertising market capture budgets that previously depended on weaker open-web targeting signals and less stable audience resolution.
Privacy-Driven Signal Loss Limiting Audience Graphs
Signal loss is no longer a temporary adjustment issue, and it now acts as a steady pressure point on the OTT programmatic advertising market, especially for inventory without strong login depth or persistent user relationships. Safari restrictions, Firefox cookie partitioning, consent-led opt-outs, and mobile identifier resets all reduce how much addressable data remains available for audience matching across the wider digital ecosystem. This creates a clear split between premium streaming platforms that can rely on authenticated subscriber environments and long-tail OTT or FAST inventory, where audience match rates and CPM support are weaker. Comscore found that many respondents planned to increase contextual targeting, which shows that many buyers are adjusting to lower identity precision instead of fully replacing lost cross-platform recognition. Frequency management becomes harder in the same environment because a weaker identity spine makes it more difficult to control repeated exposure across multiple streaming services and devices. The net effect is that the OTT programmatic advertising market still grows, but more of that growth concentrates around data-rich platforms that can preserve audience utility under tighter privacy conditions.
Other drivers and restraints analyzed in the detailed report include:
- AI-Powered Bid Optimization and Dynamic Creative Deployment
- Retail Media Data Infrastructure Extending Into OTT Inventory
- Supply-Path Complexity Raising Take Rates and Transparency Costs
For complete list of drivers and restraints, kindly check the Table Of Contents.
Segment Analysis
Real-time bidding held the largest platform share at 38.44% in 2025, while programmatic guaranteed is projected to post the fastest growth at a 14.43% CAGR through 2031 within the OTT programmatic advertising market. Real-time bidding kept its lead because it has long served as the default transaction method for digital video and connected TV inventory across broad demand pools. That legacy still matters, since many advertisers use RTB to preserve flexibility, scale testing activity quickly, and compare inventory performance across publishers without committing budget too early. Even so, the center of gravity in the OTT programmatic advertising market is shifting toward premium inventory structures that offer more control over price, delivery, and audience quality. This is why programmatic guaranteed is growing faster than other platform types, as premium streaming owners seek digital execution without giving up revenue stability or inventory discipline.
Programmatic guaranteed is gaining traction because it gives publishers fixed-price certainty and guaranteed delivery, while still preserving targeting, reporting, and workflow efficiencies that brand advertisers expect from digital infrastructure. That balance matters in the OTT programmatic advertising industry, where premium publishers need to protect yield and buyer trust at the same time. Private marketplace activity also remains important because it gives vetted buyers access to brand-safe inventory pools that usually command better pricing and stronger campaign quality than open auction routes. Curated marketplaces are becoming more relevant as buyers look for verified supply, audience packaging, and lower waste in the same transaction path, which reinforces the move away from undifferentiated open exchange buying. Preferred deals still serve selective use cases, but the broader direction of the OTT programmatic advertising market points toward transaction models that combine automation with tighter inventory governance.
Video ads accounted for 55.26% of segment revenue in 2025, while interactive ads are projected to grow at a 14.57% CAGR through 2031 in the OTT programmatic advertising market. Video remained the dominant format because OTT is built around full-screen video consumption, and pre-roll and mid-roll placements remain the native monetization unit for most premium streaming environments. This base also benefits from established advertiser familiarity, as many brand buyers still evaluate OTT performance through a television lens even when campaigns are executed through digital systems. The strength of video, therefore, reflects both product-market fit and a long-standing buyer comfort with sight, sound, and motion in lean-back viewing environments. At the same time, the fastest growth is moving toward formats that add interaction and performance utility to the viewing experience without abandoning the premium visual context.
Interactive ads are expanding because pause ads, shoppable overlays, and second-screen commerce links turn passive exposure into measurable action opportunities that are easier to connect to business outcomes. The IAB reported that targeting capabilities overtook content quality as the top purchase criterion for TV and video buyers in 2026, rising 10 percentage points year over year, which supports the broader move toward more data-responsive and outcome-aware ad formats. That shift is especially relevant for smaller and mid-sized buyers that value measurable performance and faster learning loops more than broad reach alone. Display placements, including homescreen banners and pause-state surfaces, are also widening the commercial surface area of the OTT programmatic advertising market, especially after Equativ and Titan OS launched a programmatic home-screen video solution for connected TVs in Europe and South America in May 2026. Audio-only pre-roll and other minor overlay formats remain small, but they still support monetization in FAST and radio-adjacent streaming categories where flexible inventory packaging is useful.
Complete Report Scope:
- By Platform Type
- Real-Time Bidding
- Private Marketplace
- Programmatic Guaranteed
- Preferred Deals
- Other Platform Types
- By Ad Format
- Video Ads
- Display Ads
- Interactive Ads
- Other Ad Formats
- By Device Type
- Smartphones and Tablets
- Smart TVs
- Laptops and Desktops
- Other Device Types
- By End-User Industry
- Media and Entertainment
- Retail and E-Commerce
- Automotive
- Healthcare and Pharmaceuticals
- Financial Services
- Travel and Hospitality
- Other End User Industries
- By Geography
- North America
- United States
- Canada
- Mexico
- South America
- Brazil
- Argentina
- Chile
- Rest of South America
- Europe
- Germany
- United Kingdom
- France
- Italy
- Spain
- Rest of Europe
- Asia-Pacific
- China
- Japan
- India
- South Korea
- Australia
- Rest of Asia-Pacific
- Middle East
- Saudi Arabia
- United Arab Emirates
- Qatar
- Rest of Middle East
- Africa
- South Africa
- Egypt
- Nigeria
- Rest of Africa
- North America
Geography Analysis
North America held 40.56% of the OTT programmatic advertising market share in 2025, which kept it as the largest regional revenue base. The region benefits from strong connected TV hardware penetration, mature DSP and SSP infrastructure, and a dense premium publisher base that is already configured for automated monetization. The Trade Desk's January 2026 launch of OpenAds with partners including AccuWeather, The Guardian, Hearst, Newsweek, and BuzzFeed showed how the region is also leading in direct and more transparent auction design. North America also shows stronger buy-side discipline in fraud mitigation than many other regions, which helps protect premium connected TV budgets from waste. Pixalate reported a 19% connected TV invalid traffic rate in the United States in Q4 2025, the lowest among major global markets tracked in the supplied material, which supports North America's position as the most operationally mature regional base.
Asia-Pacific is projected to grow at a 14.72% CAGR through 2031, making it the fastest-growing regional block in the OTT programmatic advertising market. Growth is being driven by strong streaming adoption in India and Southeast Asia, along with rising connected TV use in South Korea and Australia. The IAB SEA and India CTV and OTT Council found in 2025 that 74% of marketers across the region planned to increase connected TV and OTT investment, which shows that demand is scaling across multiple national markets rather than one isolated country. The Asia Video Industry Association projected in 2026 that premium video on demand would add USD 12.5 billion in incremental growth revenue across Asia-Pacific between 2025 and 2030 and reach USD 52 billion by decade's end, which underlines the size of the viewing base that programmatic buyers are moving toward. At the same time, Pixalate reported a 58% connected TV invalid traffic rate in Asia-Pacific in Q1 2026, which means the region's rapid growth is also pushing buyers toward curated and private marketplace structures that can better control quality risk.
Europe, the Middle East, Africa, and South America show uneven maturity, with Europe standing out for scale, governance, and higher fraud sensitivity. Germany's OVK and BVDW projected that programmatic revenue would exceed EUR 6 billion in 2026, equivalent to USD 6.84 billion at the supplied conversion, and account for 80% of all German online display and video revenue, which signals that automation is already the default operating model in one of Europe's largest digital ad markets. Pixalate recorded Q1 2026 connected TV invalid traffic rates of 46.1% in the United Kingdom and 44% in Germany, which shows that mature demand does not remove the need for brand-safety controls and supply verification. The Middle East, Africa, and South America remain earlier-stage parts of the OTT programmatic advertising market, where adoption is rising, but infrastructure depth, premium publisher readiness, and local programmatic standards still vary widely across countries.
- The Trade Desk, Inc.
- Google LLC
- Amazon.com, Inc.
- Microsoft Corporation
- Magnite, Inc.
- PubMatic, Inc.
- FreeWheel, A Comcast Company
- Roku, Inc.
- Adobe Inc.
- Criteo S.A.
- Equativ
- Adform A/S
- OpenX Software Ltd.
- Index Exchange Inc.
- Innovid Corp.
- iSpot.tv, Inc.
- VideoAmp, Inc.
- LiveRamp Holdings, Inc.
- StackAdapt Inc.
- Yahoo Inc.
Additional Benefits:
- The market estimate (ME) sheet in Excel format
- 3 months of analyst support
TABLE OF CONTENTS
1 INTRODUCTION
- 1.1 Study Assumptions and Market Definition
- 1.2 Scope of the Study
2 RESEARCH METHODOLOGY
3 EXECUTIVE SUMMARY
4 MARKET LANDSCAPE
- 4.1 Market Overview
- 4.2 Market Drivers
- 4.2.1 CTV-Led Programmatic Spend Expansion
- 4.2.2 Third-Party Cookie Deprecation Accelerating First-Party Targeting
- 4.2.3 AI-Powered Bid Optimization and Dynamic Creative Deployment
- 4.2.4 Retail Media Data Infrastructure Extending Into OTT Inventory
- 4.2.5 Curated Marketplaces Reducing Open-Exchange Waste
- 4.2.6 Server-Side Ad Insertion Improving Monetizable Ad Load
- 4.3 Market Restraints
- 4.3.1 Privacy-Driven Signal Loss Limiting Audience Graphs
- 4.3.2 Supply-Path Complexity Raising Take Rates and Transparency Costs
- 4.3.3 CTV Ad Fraud and Invalid Traffic Pressure
- 4.3.4 Fragmented Measurement Standards Slowing Budget Reallocation
- 4.4 Industry Value Chain Analysis
- 4.5 Impact of Macroeconomic Factors on the Market
- 4.6 Regulatory Landscape
- 4.7 Technological Outlook
- 4.8 Porter's Five Forces Analysis
- 4.8.1 Bargaining Power of Suppliers
- 4.8.2 Bargaining Power of Buyers
- 4.8.3 Threat of New Entrants
- 4.8.4 Threat of Substitutes
- 4.8.5 Industry Rivalry
5 MARKET SIZE AND GROWTH FORECASTS (VALUE)
- 5.1 By Platform Type
- 5.1.1 Real-Time Bidding
- 5.1.2 Private Marketplace
- 5.1.3 Programmatic Guaranteed
- 5.1.4 Preferred Deals
- 5.1.5 Other Platform Types
- 5.2 By Ad Format
- 5.2.1 Video Ads
- 5.2.2 Display Ads
- 5.2.3 Interactive Ads
- 5.2.4 Other Ad Formats
- 5.3 By Device Type
- 5.3.1 Smartphones and Tablets
- 5.3.2 Smart TVs
- 5.3.3 Laptops and Desktops
- 5.3.4 Other Device Types
- 5.4 By End-User Industry
- 5.4.1 Media and Entertainment
- 5.4.2 Retail and E-Commerce
- 5.4.3 Automotive
- 5.4.4 Healthcare and Pharmaceuticals
- 5.4.5 Financial Services
- 5.4.6 Travel and Hospitality
- 5.4.7 Other End User Industries
- 5.5 By Geography
- 5.5.1 North America
- 5.5.1.1 United States
- 5.5.1.2 Canada
- 5.5.1.3 Mexico
- 5.5.2 South America
- 5.5.2.1 Brazil
- 5.5.2.2 Argentina
- 5.5.2.3 Chile
- 5.5.2.4 Rest of South America
- 5.5.3 Europe
- 5.5.3.1 Germany
- 5.5.3.2 United Kingdom
- 5.5.3.3 France
- 5.5.3.4 Italy
- 5.5.3.5 Spain
- 5.5.3.6 Rest of Europe
- 5.5.4 Asia-Pacific
- 5.5.4.1 China
- 5.5.4.2 Japan
- 5.5.4.3 India
- 5.5.4.4 South Korea
- 5.5.4.5 Australia
- 5.5.4.6 Rest of Asia-Pacific
- 5.5.5 Middle East
- 5.5.5.1 Saudi Arabia
- 5.5.5.2 United Arab Emirates
- 5.5.5.3 Qatar
- 5.5.5.4 Rest of Middle East
- 5.5.6 Africa
- 5.5.6.1 South Africa
- 5.5.6.2 Egypt
- 5.5.6.3 Nigeria
- 5.5.6.4 Rest of Africa
- 5.5.1 North America
6 COMPETITIVE LANDSCAPE
- 6.1 Market Concentration
- 6.2 Strategic Moves
- 6.3 Vendor Positioning Analysis
- 6.4 Company Profiles (includes Global Level Overview, Market Level Overview, Core Segments, Financials as available, Strategic Information, Market Rank/Share, Products and Services, Recent Developments)
- 6.4.1 The Trade Desk, Inc.
- 6.4.2 Google LLC
- 6.4.3 Amazon.com, Inc.
- 6.4.4 Microsoft Corporation
- 6.4.5 Magnite, Inc.
- 6.4.6 PubMatic, Inc.
- 6.4.7 FreeWheel, A Comcast Company
- 6.4.8 Roku, Inc.
- 6.4.9 Adobe Inc.
- 6.4.10 Criteo S.A.
- 6.4.11 Equativ
- 6.4.12 Adform A/S
- 6.4.13 OpenX Software Ltd.
- 6.4.14 Index Exchange Inc.
- 6.4.15 Innovid Corp.
- 6.4.16 iSpot.tv, Inc.
- 6.4.17 VideoAmp, Inc.
- 6.4.18 LiveRamp Holdings, Inc.
- 6.4.19 StackAdapt Inc.
- 6.4.20 Yahoo Inc.
7 MARKET OPPORTUNITIES AND FUTURE OUTLOOK
- 7.1 White-Space and Unmet-Need Assessment