
|
시장보고서
상품코드
2125330
프로그래매틱 광고 : 시장 점유율 분석, 업계 동향과 통계, 성장 예측(2026-2031년)Programmatic Advertisement - Market Share Analysis, Industry Trends & Statistics, Growth Forecasts (2026 - 2031) |
||||||
 Mordor Intelligence
Mordor Intelligence에 따르면 2026년 프로그래매틱 광고 시장 규모는 7,200억 달러로 추정되고 있으며, 2025년 6,500억 달러에서 확대하며, 2031년에는 1조 1,700억 달러에 달할 것으로 예측됩니다.
2026-2031년까지의 연평균 성장률(CAGR)은 10.34%에 달할 것으로 전망됩니다.
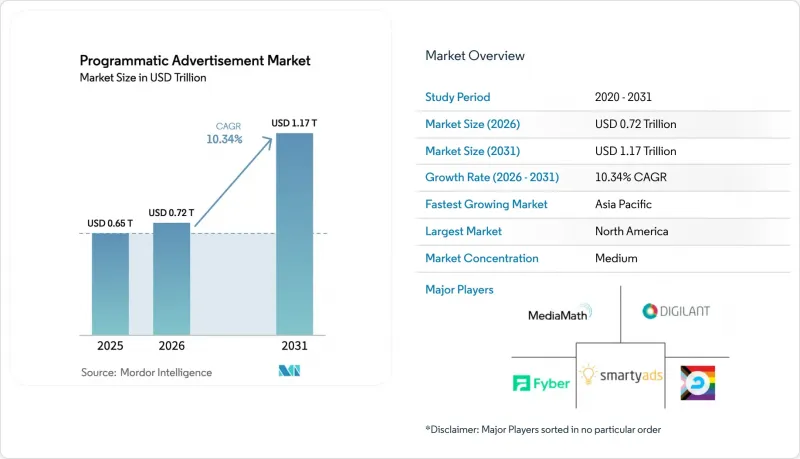
이 보고서는 거래 플랫폼(실시간 입찰, 프라이빗 마켓플레이스 등), 광고 채널/포맷(디스플레이 배너, 동영상 등), 기기(데스크톱, 모바일, 스마트 TV), 업종(소매·E-Commerce, 미디어·엔터테인먼트 등), 기업 규모(중소기업, 대기업), 지역별로 분류되어 있습니다. 시장 전망은 금액(달러) 기준으로 제시되어 있습니다.
글로벌 프로그래매틱 광고 시장의 동향 및 인사이트
프리미엄 인벤토리의 프라이빗 마켓플레이스로의 전환
Magnite는 2024년 한 해 동안 프리미엄 퍼블리셔들이 주력 인벤토리를 초대제 환경으로 계속 전환했으며, 브랜드 안전성 보장을 통해 평균 청산 가격이 상승했다고 밝혔습니다. 클로즈드 옥션은 수익의 확실성이 높고 부정 행위 위험도 낮아지기 때문에 구매자와 판매자 모두 점점 더 프라이빗 거래를 기본 옵션으로 선택하고 있습니다. 한 글로벌 뉴스 미디어는 2025년 초, 라이브 이벤트 슬롯과 라이프스타일 컨텐츠를 묶어 오픈 익스체인지 요율보다 3분의 1 이상 높은 CPM을 확보했습니다. 이러한 구조적 결과로, 잉여 노출은 오픈 익스체인지에 남아 있는 반면, 고가치 공급은 엄선된 마켓플레이스로 모여들게 되어 사실상 유동성 지도가 다시 그려지게 됩니다. 이러한 전환이 가속화됨에 따라 투명한 공급 경로와 감사 가능한 보고 기준은 프리미엄 수요에 있으며, 필수적인 요소가 될 것입니다.
AI를 활용한 입찰 최적화
포스트 클릭 가치를 예측하는 머신러닝 모델은 2024년에 시범 단계에서 주류로 전환되어, 2025년 1분기까지 주요 수요 측 플랫폼(DSP)에 통합되었습니다. 한 유럽의 구독 서비스는 LTV(생애 가치) 가중 입찰을 적용한 결과, 광고비 1달러당 6개월간 수익이 35% 증가했습니다. 또한 소매업체들은 현재 SKU별 이익 기여도를 바탕으로 입찰가를 조정하고 있습니다. 이러한 사례들은 알고리즘이 실시간으로 입찰가를 최적화함에 따라 경영진의 초점이 비용 관리에서 성장 가속화로 이동하고 있음을 보여줍니다. 그 결과, 성공 지표가 노출 수 대신 증분 이익을 중심으로 재정의되면서 사내 미디어 팀의 데이터 과학 인재에 대한 의존도가 높아지고 있습니다. 경쟁 우위는 독자적인 예측 데이터세트와 신속한 피드백 루프의 조합에 점점 더 좌우되고 있습니다.
서드파티 쿠키의 상실로 인해 유럽의 ID 풀이 축소
유럽의 엄격한 개인정보 보호 규제로 인해 2024년에는 식별자의 축소가 가속화되었습니다. 여러 시장에 걸쳐 활동하는 한 퍼블리셔 그룹은 새로운 정책 시행 직후 서드파티 ID가 20% 감소했다고 보고했습니다. 그 감소분의 절반은 퍼스트파티 로그인 및 암호화된 이메일 해시를 통해 회복되었으며, 이는 참여한 광고주들에게 전환율 향상과 노출 낭비 감소로 이어졌습니다. 규모는 작지만, 동의를 얻은 오디언스에서는 확장 가능한 성과가 확인되고 있으며, 퍼블리셔와의 관계에 기반한 어드레서빌리티가 향후 타겟팅의 틀을 형성해 나갈 것임을 시사하고 있습니다. 하지만 전환 비용과 측정상의 혼란이 단기적인 성장을 제약하고 있으며, 이는 프로그래매틱 광고 시장 전체의 예상 연평균 성장률(CAGR)을 약 1.7포인트 하향 조정하는 요인이 되고 있습니다.
부문 분석
2025년, 실시간 입찰(RTB)은 프로그래매틱 광고 시장 점유율의 41.30%를 차지하며, 도달 범위 확대에 있으며, 그 중요성을 부각시켰습니다. 그러나 2031년까지 연평균 성장률(CAGR) 24.15%로 확대될 ‘프로그래매틱 게런티드’의 부상에 따라 RTB 부문의 비중은 점차 감소하고 있습니다. 이는 프리미엄 광고 슬롯에서 고정 가격의 확실성을 추구하는 광고주의 수요를 반영한 것입니다. 에피소드 형식의 컨텐츠나 라이브 뉴스를 보증형 포트폴리오로 묶은 퍼블리셔는 예정보다 몇 주나 빨리 광고 공간이 매진되어, 확실한 노출에 대한 잠재적 수요가 드러났습니다. 구매자들이 규모 확대를 위해 오픈 옥션을 유지하면서도 전략적인 타이밍을 보장형 채널을 통해 확보하는 하이브리드형 미래가 부상하고 있으며, 플랫폼의 다양화가 진행되고 있습니다. 이에 따라 공급 측 파트너사들은 단일 워크플로우로 여러 거래 유형을 실행할 수 있도록 API 확장을 추진하고 있습니다.
프로그래매틱 광고 시장의 참여 기업은 보장형 거래가 예측 정확도와 수익의 안정성을 향상시키고, 과거에는 선형 TV에 한정되었던 브랜드 광고 예산을 끌어들이고 있음을 인식하고 있습니다. 한편, 실시간 경매에서는 입찰 셰이딩 및 최저가 자동화와 같은 혁신이 계속되고 있습니다. 이러한 다양한 접근 방식이 공존함에 따라 벤더들은 거래 유형 전반에 걸쳐 성과를 시각화하는 통합 대시보드를 개발하여 운영상의 마찰을 줄이고 있습니다. 예측 기간 중, 크로스 채널 및 멀티 딜을 지원하는 거버넌스를 제공하는 거래 파트너는 특히 옴니채널 예산을 일원적으로 관리하는 브랜드로부터 매우 큰 지갑 점유율을 확보하게 될 것입니다.
디스플레이 배너는 여전히 노출의 34.25%를 차지하며, 리타게팅 및 빈도 조절에 있으며, 필수적인 요소입니다. 하지만 프로그래매틱 동영상은 2031년까지 연평균 성장률(CAGR) 25.1%로 시장 규모가 확대됨에 따라 증가하는 광고비의 대부분을 차지할 전망입니다. 소셜 피드상의 숏폼 컨텐츠는 거실 스크린에서의 롱폼 스트리밍을 보완하며, 하루 종일 접점을 배가시키는 연속적인 동영상 경험을 형성하고 있습니다. 한 유럽 자동차 브랜드는 세로형 동영상과 적응형 6초 범퍼를 결합한 결과, 방문 의향이 28% 상승하며 크리에이티브의 시너지 효과를 입증했습니다.
광고주가 리치 미디어, 오디오, 그리고 새롭게 등장하는 몰입형 광고 유닛을 통합된 동영상 예산에 포함함에 따라 동영상 형식과 관련된 프로그래매틱 광고 시장 규모는 더욱 확대될 전망입니다. 각 측정 업체들은 커넥티드 TV, 모바일, 야외 광고(OOH)의 노출을 단일 중복 제거 지표 세트로 통합한 ‘통합 도달 곡선’을 제공함으로써 이러한 추세에 대응하고 있습니다. 크리에이티브 자산의 포맷 간 조정은 현재 최상위 캠페인과 평균적인 캠페인을 구분 짓는 요인이 되고 있으며, 광고 대행사들은 클라우드 기반 자산 버전 관리 및 AI 기반 편집 스위트에 대한 투자를 가속화하고 있습니다.
지역별 분석
북미는 2025년에 프로그래매틱 광고 시장 점유율 37.50%를 유지하며 최대 지역 허브로서의 입지를 공고히 했습니다. 정치 선거 주기를 통해 새로운 자금이 유입되고 그 효율성이 입증된 후, 자동화된 워크플로우가 정착되었습니다. 공급망 최적화를 통해 퍼블리셔와 바이어 간의 거리는 계속해서 좁혀지고 있으며, 이는 퍼블리셔의 수익성 향상과 수요 측의 수수료 절감으로 이어지고 있습니다. 투명한 경로는 구매자의 충성도를 확보할 것으로 기대되며, 클린룸 기반의 도달 범위 검증 및 성과 보고와 같은 새로운 측정 기준의 시험장으로서 이 지역의 역할을 강화하고 있습니다.
아시아태평양은 2031년까지 연평균 성장률(CAGR) 12.3%로 확대될 것으로 예측되며, 다른 지역을 압도하는 기세로 가장 빠르게 성장하는 지역이 될 전망입니다. 모바일 우선의 소비자 행동과 E-Commerce의 급속한 확산이 노출의 유동성을 촉진하고 있으며, 특히 인도와 인도네시아에서는 앱 중심의 생태계가 데스크톱의 레거시 시스템을 우회하고 있습니다. 2025년 한 스포츠 이벤트에서 동남아시아의 한 스트리밍 앱이 실시한 실시간 광고 삽입은 사상 최고 수준의 뷰스루율을 달성하며, 이 지역이 첨단 서버사이드 광고 삽입을 위한 준비가 되어 있음을 여실히 보여주었습니다. 각국 정부는 유럽의 선례를 모델로 한 개인정보 보호 관련 법안을 마련하고 있으며, 이에 따라 각 벤더는 사업 시작 초기부터 동의 획득 체계를 구축하도록 권장받고 있습니다. 이러한 미래 지향적인 규정 준수 노력으로 인해 과거 성장 단계에서 성숙한 시장이 직면했던 상황보다 구조적으로 더 깨끗한 광고 인벤토리 풀이 형성될 가능성이 있습니다.
유럽은 서드파티 쿠키 풀을 축소시킨 엄격한 규제에도 불구하고 여전히 매우 중요한 시장입니다. 퍼블리셔들은 인증된 트래픽에 대한 집중을 강화하고 있으며, 암호화된 메일 해시를 활용한 초기 노력 덕분에 쿠키 기반 리타게팅에 비해 적격 은행 신청 건수가 17% 증가했습니다. 규정 준수 대응은 운영상의 부담을 가중시키고 있지만, 결정론적 타겟팅을 통해 성과가 안정적이며, 해당 지역의 프로그래매틱 광고 시장 규모는 한 자릿수 중반대의 성장 궤도를 유지하고 있습니다. 라틴아메리카, 중동 및 아프리카는 절대적인 광고 지출 규모에서는 뒤처지고 있지만, 스마트폰 보급과 도시 지역의 야외 광고 디지털화에 힘입어 상대적으로 급속한 성장을 기록하고 있습니다. 투자자들은 해당 지역의 인증받은 스타트업에 자본을 투입하고 있으며, 이는 광고주들이 중기적인 확장성에 대해 확신을 가지고 있음을 보여줍니다.
기타 혜택:
- 엑셀 형식의 시장 예측(ME) 시트
- 3개월간의 애널리스트 지원
자주 묻는 질문
목차
제1장 서론
제2장 조사 방법
제3장 개요
제4장 시장 구도
제5장 시장 규모와 성장 예측
제6장 경쟁 구도
제7장 시장 기회와 향후 전망
KSA 26.09.08According to Mordor Intelligence, programmatic advertising market size in 2026 is estimated at USD 0.72 trillion, growing from 2025 value of USD 0.65 trillion with 2031 projections showing USD 1.17 trillion, growing at 10.34% CAGR over 2026-2031.
This report is Segmented Trading Platform (Real-Time Bidding, Private Marketplace, and More), Advertising Channel / Format (Display Banner, Video, and More), Device (Desktop, Mobile, Smart TV), Industry Vertical (Retail and E-Commerce, Media and Entertainment, and More), Enterprise Size (SMBs, Large Enterprises), Geography. The Market Forecasts are Provided in Terms of Value (USD).
Global Programmatic Advertisement Market Trends and Insights
Premium Inventory Migration to Private Marketplaces
Premium publishers continued to shift flagship inventory into invitation-only environments throughout 2024, lifting average clearing prices as brand-safety assurances Magnite. Buyers and sellers alike increasingly default to private deals because closed auctions combine higher revenue certainty with reduced fraud exposure. One global news outlet bundled live-event slots with lifestyle content in early 2025 and secured CPMs more than one-third above its open-exchange rate. The structural outcome is that remnant impressions will remain in open exchanges while high-value supply gravitates to curated marketplaces, effectively redrawing liquidity maps. As this migration gains momentum, transparent supply paths and auditable reporting standards become table stakes for premium demand.
AI-Driven Bid Optimisation
Machine-learning models that predict post-click value moved from pilot to mainstream in 2024 and were embedded across leading demand-side platforms by Q1 2025 . A European subscription service recorded a 35% uplift in six-month revenue per advertising dollar after applying lifetime-value-weighted bidding, and retailers now adjust bids based on SKU-level margin contribution. These examples show management focus pivoting from cost control to growth acceleration as algorithms refine bid prices in real time. The net effect is a redefinition of success metrics around incremental profit rather than impressions served, deepening the reliance on data-science talent within in-house media teams. Competitive advantage increasingly hinges on proprietary predictive datasets coupled with fast feedback loops.
Third-Party-Cookie Loss Shrinking ID Pools in Europe
Europe's stringent privacy regime accelerated identifier contraction in 2024 when a multi-market publisher group reported a 20% drop in third-party IDs immediately after new policy enforcement. Half of that loss was recovered through first-party sign-ins and encrypted email hashes, leading to higher win rates and lower impression waste for participating advertisers. Smaller yet consented audiences demonstrate scalable outcomes, indicating that addressability anchored in publisher relationships will shape future targeting frameworks. Nonetheless, transition costs and measurement disruptions constrain short-term growth, shaving an estimated 1.7 percentage points from the projected CAGR across the programmatic advertising market.
Other drivers and restraints analyzed in the detailed report include:
- Connected-TV Programmatic Surge
- Retail-Media First-Party Data Unlocking Budgets
- Ad-Fraud and Supply-Chain Opacity in Emerging Markets
For complete list of drivers and restraints, kindly check the Table Of Contents.
Segment Analysis
Real-Time Bidding accounted for 41.30% of programmatic advertising market share in 2025, underscoring its prominence for incremental reach. Yet the segment's proportion is gradually declining as Programmatic Guaranteed accelerates at a 24.15% CAGR to 2031, reflecting advertiser demand for fixed-price certainty in premium slots. Publishers that bundled episodic content and live news into guaranteed portfolios sold out weeks ahead of schedule, demonstrating latent demand for assured delivery. A hybrid future is emerging in which buyers maintain open auctions for scale while reserving strategic moments through guaranteed pipes, increasing platform diversification. Supply-side partners are therefore expanding APIs to accommodate multi-deal-type execution in a single workflow.
Programmatic advertising market participants recognise that guaranteed deals improve forecast accuracy and yield stability, attracting brand dollars once confined to linear television. Meanwhile, real-time auctions continue to innovate with bid-shading and floor-price automation. The coexistence of these paths encourages technology vendors to develop consolidated dashboards that visualise performance across deal types, reducing operational friction. Over the forecast period, trading partners that deliver cross-channel, multi-deal governance will capture outsized wallet share, particularly from brands centralising omnichannel budgets.
Display banners still represented 34.25% of impressions and remain indispensable for retargeting and frequency balancing. Nevertheless, programmatic video is set to capture the dominant share of incremental spend as its market size grows at a 25.1% CAGR through 2031. Short-form content on social feeds complements long-form streaming on living-room screens, forming contiguous video journeys that multiply touchpoints throughout the day. A European automotive brand combined vertical video with adaptive six-second bumpers and saw visit intent rise 28%, illustrating creative synergies.
As buyers integrate rich-media, audio, and emerging immersive units into unified video budgets, the programmatic advertising market size attached to video formats is poised to widen further. Measurement vendors are responding with unified reach curves that aggregate connected-TV, mobile, and out-of-home exposures into a single, deduplicated metric set. The cross-format orchestration of creative assets now differentiates leading campaigns from median performers, spurring agencies to invest in cloud-based asset-versioning and AI-driven editing suites.
Complete Report Scope:
- By Trading Platform
- Real-Time Bidding (Open Auction)
- Private Marketplace
- Programmatic Guaranteed
- Preferred Deals (Unreserved Fixed-Rate)
- Header Bidding
- By Advertising Channel / Format
- Display Banner
- Video
- Mobile Display
- Connected TV (CTV)
- Digital Out-of-Home (DOOH)
- Others
- By Device
- Desktop
- Mobile
- Smart TV
- By Industry Vertical
- Retail and E-Commerce
- Media and Entertainment
- Automotive
- BFSI
- Healthcare and Pharma
- Others
- By Enterprise Size
- SMBs
- Large Enterprises
- By Geography
- North America
- United States
- Canada
- Latin America
- Brazil
- Argentina
- Mexico
- Rest of Latin America
- Europe
- Germany
- United Kingdom
- France
- Italy
- Spain
- Rest of Europe
- Asia-Pacific
- China
- Japan
- South Korea
- India
- Australia
- New Zealand
- Rest of Asia-Pacific
- Middle East and Africa
- United Arab Emirates
- Saudi Arabia
- South Africa
- Rest of Middle East and Africa
- North America
Geography Analysis
North America sustained a 37.50% programmatic advertising market share in 2025, cementing its status as the largest regional hub. Political election cycles injected fresh funds that remained in automated workflows after proving efficient. Supply-path optimisation continues to shorten the distance between publisher and buyer, lifting publisher yield and lowering demand-side fees. Transparent routes are expected to lock in buyer loyalty, reinforcing the region's role as the test bed for new measurement standards such as clean-room-based reach verification and outcome reporting.
Asia-Pacific is forecast to expand at a 12.3% CAGR to 2031, making it the fastest-growing region by a clear margin. Mobile-first consumer behavior and rapid e-commerce adoption fuel impression liquidity, especially in India and Indonesia, where app-centric ecosystems bypass desktop legacies. A Southeast-Asian streaming app's real-time ad insertion during 2025 sporting events achieved record view-through rates, highlighting regional readiness for advanced server-side ad insertion. Governments are drafting privacy statutes modelled on European precedents, prompting vendors to embed consent frameworks from inception. This proactive compliance stance could yield a structurally cleaner supply pool than mature markets faced in earlier growth waves.
Europe remains pivotal despite stricter regulations that trimmed third-party-cookie pools. Publishers double down on authenticated traffic, and early encrypted-email-hash collaborations delivered a 17% boost in qualified banking applications versus cookie-based retargeting. Although compliance raises operational overhead, deterministic addressability is stabilising performance, keeping the programmatic advertising market size in the region on a mid-single-digit growth path. Latin America and the Middle East and Africa trail in absolute spend but register rapid relative growth, driven by smartphone penetration and urban out-of-home digitisation. Investors are funnelling capital into regional verification start-ups, signalling advertiser confidence in medium-term scalability.
- Alphabet Inc. (Google Ads)
- Meta Platforms, Inc.
- Amazon.com, Inc.
- The Trade Desk, Inc.
- Magnite, Inc.
- PubMatic, Inc.
- Index Exchange, Inc.
- Verizon Communications Inc. (Yahoo)
- Adobe Inc.
- Microsoft Corp. (Xandr)
- MediaMath Inc.
- War Room Holdings, Inc.
- Digilant
- Fyber N.V.
- SmartyAds
- Choozle, Inc.
- Zeta Global Holdings Corp.
- Criteo S.A.
- Roku, Inc.
- AppLovin Corp.
- OpenX Technologies, Inc.
- TripleLift, Inc.
- Adform A/S
Additional Benefits:
- The market estimate (ME) sheet in Excel format
- 3 months of analyst support
TABLE OF CONTENTS
1 INTRODUCTION
- 1.1 Study Assumptions and Market Definition
- 1.2 Scope of the Study
2 RESEARCH METHODOLOGY
3 EXECUTIVE SUMMARY
4 MARKET LANDSCAPE
- 4.1 Market Overview
- 4.2 Market Drivers
- 4.2.1 Premium Inventory Migration to Private Marketplaces Fuelling CPMs
- 4.2.2 AI-Driven Bid Optimisation Elevating ROAS in Europe
- 4.2.3 Connected-TV Programmatic Surge in the US and Japan
- 4.2.4 Retail-Media First-Party Data Unlocking Budgets
- 4.2.5 Contextual Targeting Renaissance Post-Cookie
- 4.2.6 5G-Enabled Real-Time Mobile RTB Growth in Asia
- 4.3 Market Restraints
- 4.3.1 Third-Party-Cookie Loss Shrinking ID Pools in Europe
- 4.3.2 Ad-Fraud and Supply-Chain Opacity in Emerging Markets
- 4.3.3 Programmatic Talent Scarcity Among SMB Advertisers
- 4.3.4 Divergent Privacy Laws Stalling Cross-Border Buys
- 4.4 Regulatory Outlook
- 4.5 Technological Outlook
- 4.6 Porter's Five Forces Analysis
- 4.6.1 Bargaining Power of Suppliers
- 4.6.2 Bargaining Power of Buyers/Consumers
- 4.6.3 Threat of New Entrants
- 4.6.4 Threat of Substitute Products
- 4.6.5 Intensity of Competitive Rivalry
5 MARKET SIZE AND GROWTH FORECASTS (VALUE)
- 5.1 By Trading Platform
- 5.1.1 Real-Time Bidding (Open Auction)
- 5.1.2 Private Marketplace
- 5.1.3 Programmatic Guaranteed
- 5.1.4 Preferred Deals (Unreserved Fixed-Rate)
- 5.1.5 Header Bidding
- 5.2 By Advertising Channel / Format
- 5.2.1 Display Banner
- 5.2.2 Video
- 5.2.3 Mobile Display
- 5.2.4 Connected TV (CTV)
- 5.2.5 Digital Out-of-Home (DOOH)
- 5.2.6 Others
- 5.3 By Device
- 5.3.1 Desktop
- 5.3.2 Mobile
- 5.3.3 Smart TV
- 5.4 By Industry Vertical
- 5.4.1 Retail and E-Commerce
- 5.4.2 Media and Entertainment
- 5.4.3 Automotive
- 5.4.4 BFSI
- 5.4.5 Healthcare and Pharma
- 5.4.6 Others
- 5.5 By Enterprise Size
- 5.5.1 SMBs
- 5.5.2 Large Enterprises
- 5.6 By Geography
- 5.6.1 North America
- 5.6.1.1 United States
- 5.6.1.2 Canada
- 5.6.2 Latin America
- 5.6.2.1 Brazil
- 5.6.2.2 Argentina
- 5.6.2.3 Mexico
- 5.6.2.4 Rest of Latin America
- 5.6.3 Europe
- 5.6.3.1 Germany
- 5.6.3.2 United Kingdom
- 5.6.3.3 France
- 5.6.3.4 Italy
- 5.6.3.5 Spain
- 5.6.3.6 Rest of Europe
- 5.6.4 Asia-Pacific
- 5.6.4.1 China
- 5.6.4.2 Japan
- 5.6.4.3 South Korea
- 5.6.4.4 India
- 5.6.4.5 Australia
- 5.6.4.6 New Zealand
- 5.6.4.7 Rest of Asia-Pacific
- 5.6.5 Middle East and Africa
- 5.6.5.1 United Arab Emirates
- 5.6.5.2 Saudi Arabia
- 5.6.5.3 South Africa
- 5.6.5.4 Rest of Middle East and Africa
- 5.6.1 North America
6 COMPETITIVE LANDSCAPE
- 6.1 Strategic Developments
- 6.2 Vendor Positioning Analysis
- 6.3 Company Profiles (includes Global level Overview, Market level overview, Core Segments, Financials as available, Strategic Information, Products and Services, and Recent Developments)
- 6.3.1 Alphabet Inc. (Google Ads)
- 6.3.2 Meta Platforms, Inc.
- 6.3.3 Amazon.com, Inc.
- 6.3.4 The Trade Desk, Inc.
- 6.3.5 Magnite, Inc.
- 6.3.6 PubMatic, Inc.
- 6.3.7 Index Exchange, Inc.
- 6.3.8 Verizon Communications Inc. (Yahoo)
- 6.3.9 Adobe Inc.
- 6.3.10 Microsoft Corp. (Xandr)
- 6.3.11 MediaMath Inc.
- 6.3.12 War Room Holdings, Inc.
- 6.3.13 Digilant
- 6.3.14 Fyber N.V.
- 6.3.15 SmartyAds
- 6.3.16 Choozle, Inc.
- 6.3.17 Zeta Global Holdings Corp.
- 6.3.18 Criteo S.A.
- 6.3.19 Roku, Inc.
- 6.3.20 AppLovin Corp.
- 6.3.21 OpenX Technologies, Inc.
- 6.3.22 TripleLift, Inc.
- 6.3.23 Adform A/S
7 MARKET OPPORTUNITIES AND FUTURE OUTLOOK
- 7.1 White-Space and Unmet-Need Assessment