

|
시장보고서
상품코드
2118226
OTT 추천 엔진 시장 : 시장 점유율 분석, 업계 동향 및 통계, 성장 예측(2026-2031년)OTT Recommendation Engine - Market Share Analysis, Industry Trends & Statistics, Growth Forecasts (2026 - 2031) |
||||||
 Mordor Intelligence
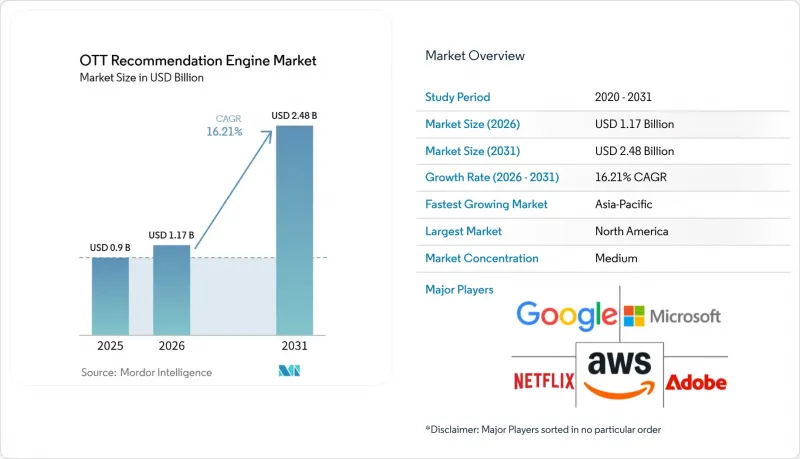
에 의하면, OTT 추천 엔진 시장 규모는 2025년 9억 달러로 평가되었고, 2026년 11억 7,000만 달러에서 2031년까지 24억 8,000만 달러로 확대될 것으로 예측되며, 2026-2031년 연평균 복합 성장률(CAGR)은 16.21%를 나타낼 전망입니다.
본 보고서는 배포 방식별(클라우드 기반, 온프레미스형 등), 최종 사용자별(방송사 및 유료 TV 사업자, 디지털 미디어 및 퍼블리싱 플랫폼 등), 비즈니스 모델별(정기 구독 과금(SVOD) 등), 용도별(컨텐츠 추천, 광고 및 프로모션 추천 등), 그리고 지역별로 분류되어 있습니다. 시장 예측은 금액(달러) 기준으로 제시되어 있습니다.
세계의 OTT 추천 엔진 시장 동향 및 인사이트
초개인화된 시청 경험에 대한 수요
추천의 품질은 해지율, 시청 시간, 광고 수익에 동시에 영향을 미치기 때문에 중요한 운영 지표로 자리 잡고 있습니다. 2026년에 발표된 넷플릭스의 조사에 따르면, 해당사의 추천 시스템은 시청할 타이틀 선택뿐만 아니라 시청자가 애초에 시청할지 여부에도 영향을 미치고 있으며, 개인화는 단순한 인터페이스 품질뿐만 아니라 사용자당 수익과도 연결되어 있음이 밝혀졌습니다. 따라서 OTT 추천 엔진 시장은 홈페이지 레이아웃, 아트워크 선정, 편집상의 프레젠테이션을 통합적으로 조정하는 시스템으로 전환되고 있습니다. 넷플릭스는 자사의 ‘GenPage’ 시스템이 주요 참여 지표를 개선했으며, 기존의 다단계 추천 시스템에 비해 엔드투엔드 전송 지연을 20% 줄였다고 보고했습니다. JioHotstar는 텍스트와 음성 기반 컨텐츠 검색 기능이 모두 제공되었을 때 60% 이상의 사용자가 음성을 선택했다고 보고했으며, 이는 검색 인터페이스가 기반이 되는 모델이 제공하는 가치를 형성할 수 있음을 보여줍니다.
증가하는 스트리밍 컨텐츠 양
OTT 추천 엔진 시장은 카탈로그의 확장에 힘입어 성장하고 있으며, 이로 인해 수동적인 컨텐츠 발견은 점점 더 어려워지고 있습니다. Amagi는 2026년 중반까지 자사의 THUNDERSTORM 플랫폼에서 6,500개 이상의 FAST 채널 전송을 추적하고 있으며, 정확한 프로그램 메타데이터와 검색 결과에 대한 수요가 증가하고 있습니다. 2026년 Hub Entertainment Research의 조사에 따르면, 장르, 등급, 에피소드 데이터가 불완전할 경우 검색에서 프로그램의 가시성이 떨어지고, 컨텍스트 광고의 매칭 정확도가 약화될 가능성이 있는 것으로 밝혀졌습니다. 메타데이터의 충실화는 랭킹의 품질만큼이나 중요해지고 있습니다. 이는 메타데이터가 불충분할 경우 유용한 카탈로그 타이틀이 간과될 가능성이 있기 때문입니다. ThinkAnalytics는 IBC 2025에서 ‘ThinkMetadataAI’를 발표하며, 수십 개 언어로 된 컨텐츠 태깅을 자동화하고 해당 정보를 자사의 디스커버리 도구와 연동했습니다. 충실한 메타데이터와 랭킹 시스템을 결합한 제공업체는 대규모의 다양한 라이브러리에서 더욱 강력한 검색 기능을 요구하는 플랫폼에 서비스를 제공하는 데 있어 유리한 입장에 있습니다.
데이터 개인정보 보호 및 동의 관리 요건
개인정보 보호 및 투명성에 관한 의무로 인해 국경을 초월한 개인화 프로그램의 운영은 더욱 어려워지고 있습니다. 유럽연합 집행위원회는 EU AI법에 근거한 제50조 투명성 규정이 2026년 8월 2일부터 적용되어, 사람과 상호작용하는 관련 시스템에 대해 공개 및 문서화 의무가 부과된다고 밝혔습니다. 또한, 디지털 서비스법(DSM)은 프로파일링에 기반한 추천 이외의 의미 있는 대안을 요구함으로써, 알고리즘 기반 큐레이션을 활용하는 서비스에 영향을 미치고 있습니다. 따라서 OTT 추천 엔진 시장에서는 보다 명확한 동의 관리, 문서화 및 사용자 대상 설명을 지원해야 합니다. 유럽의 개인정보 보호 규정이 적용되는 데이터를 위해 별도의 훈련 환경을 마련하면 인프라 비용이 증가하고 모델 업데이트가 지연될 가능성이 있습니다. 확립된 동의 및 거버넌스 시스템을 갖춘 대규모 벤더는 소규모 전문 벤더보다 이러한 요건을 충족하기 쉬울 것입니다.
부문 분석
2025년 기준, 클라우드 기반 시스템은 OTT 추천 엔진 시장의 65.70% 점유율을 차지했으며, 2031년까지 연평균 성장률(CAGR) 16.71%를 나타낼 것으로 예측됩니다. 클라우드를 통한 제공으로 방송사 규모의 컨텐츠 라이브러리에서 피처 스토어 유지 관리, 모델 재훈련, 추론 서비스에 필요한 노력이 경감됩니다. 또한 팀은 기반이 되는 인프라 전체를 구축·운영하지 않고도 용량을 추가할 수 있게 됩니다. ByteDance의 Volcengine은 IPTV 및 OTT 사업자를 대상으로 홈페이지, 채널,컨텐츠 상세 페이지에 이르는 관리형 대형 화면용 추천 서비스를 제공합니다. 이 서비스는 독자적인 모델 개발 팀을 보유하지 않은 사업자에게도 OTT 추천 엔진 시장이 패키지화된 개인화 서비스를 제공할 수 있음을 보여줍니다.
온프레미스형 시스템은 국영 방송국이나 엄격한 데이터 현지화 규제의 대상이 되는 사업자에게 여전히 중요한 선택지입니다. 이러한 요건은 시청자 데이터의 국경 간 전송이 제한되는 경우 특히 중요해집니다. 기밀성이 높은 가입자 프로파일을 자사 시스템 내에 보관하는 대규모 유료 TV 사업자들 사이에서는 하이브리드형 접근 방식이 주목받고 있습니다. 이러한 사업자들은 기밀성이 낮은 추론 작업이나 비개인적 속성의 신호에 대해서는 계속해서 클라우드의 처리 능력을 활용할 수 있습니다. 이 접근 방식을 통해 OTT 추천 엔진 시장의 제공업체는 완전히 격리된 추천 환경을 구축하지 않고도 유연한 처리 능력을 제공하면서 현지 관리 권한을 유지할 수 있게 됩니다.
2025년, OTT 추천 엔진 시장의 매출 중 40.45%를 방송사 및 유료 TV 사업자가 차지했습니다. 이 사업자들은 방대한 컨텐츠 카탈로그를 보유하고 있으므로, 프리미엄 프로그램을 쉽게 찾을 수 있도록 하는 효과적인 검색 도구가 필요합니다. 기존 방송사가 스트리밍 중심의 배포 방식을 채택함에 따라, 추천 시스템은 단순한 앱의 부가 기능이 아닌 고객 유지를 위한 도구로 자리 잡고 있습니다. 디지털 미디어 및 출판 플랫폼 역시 뉴스, 팟캐스트, 사용자 생성 컨텐츠(UGC) 등 방대한 양의 컨텐츠를 관리하기 위해 추천 시스템을 활용하고 있습니다. 이러한 이용 사례로 인해 재참여 유도 및 시기적절한 컨텐츠 제공에 대한 수요가 증가하고 있습니다.
커넥티드 TV 및 디바이스 생태계는 2031년까지 연평균 성장률(CAGR) 16.94%를 나타낼 것으로 예측됩니다. 스마트 TV 제조업체들은 OS 레이어에 추천 기능을 통합하여, 시청자가 개별 스트리밍 앱을 실행하기 전부터 컨텐츠를 발견할 수 있도록 하고 있습니다. 2026년 2월, 삼성은 Gracenote와 제휴하여 자사의 세계 스마트 TV 플랫폼을 위해 LLM(대규모 언어 모델)을 활용한 대화형 검색 및 컨텐츠 발견 기능을 제공했습니다. 이러한 통합을 통해 컨텐츠 발견 과정은 기기 인터페이스라는 업스트림 단계로 이동합니다. 이를 통해 기기 제조업체는 시청자의 관심, 가구 단위의 컨텐츠 발견, 그리고 홈 화면과 관련된 광고 공간에 영향을 미칠 수 있게 되었으며, OTT 추천 엔진 시장 전반에서 상호 운용성의 중요성이 높아지고 있습니다.
지역별 분석
2025년, 북미는 전 세계 매출의 40.45%를 차지했으며, 이 지역은 세계 최대의 매출 규모를 자랑했습니다. 이 지역에는 구독형 및 광고 지원형 스트리밍 플랫폼이 밀집해 있으며, 확립된 프로그래매틱 광고 도구와 커넥티드 TV의 현저한 이용 실적이 있습니다. 2026년 7월, 아마존이 프라임 비디오(Prime Video)에 대해 진행한 AI 중심의 재설계 노력은 추천 기능에 대한 투자가 제품 팀을 넘어 경영진의 최우선 과제로 전환되었음을 보여줍니다. Amagi의 보고서에 따르면, 2026년 중반 시점에서 미국과 캐나다는 전 세계 FAST 시청 시간의 54%, 전 세계 FAST 광고 노출의 74%를 차지했습니다. Roku의 조사에 따르면, Roku를 이용하는 가구의 64%가 FAST 컨텐츠를 스트리밍하고 있는 것으로 나타났으며, 이는 OS 수준에서 컨텐츠 발견의 중요성을 뒷받침합니다. 남미에서는 SKY+와 DGO가 2025년 4월, 각각 170개 및 260개의 라이브 채널을 아우르는 1만 개의 타이틀로 구성된 전체 카탈로그에 Mediagenix 및 Spideo의 추천 엔진을 도입했습니다.
아시아태평양은 2031년까지 16.78%라는 지역별 최고 연평균 성장률(CAGR)을 나타낼 전망입니다. 인도, 중국, 한국, 일본 및 동남아시아 각 시장에서는 모바일 우선 이용 형태와 현지 언어로 된 컨텐츠 카탈로그 확충이 맞물려 발전하고 있습니다. JioHotstar는 2억 명 이상의 사용자에게 서비스를 제공하고 있으며, 음성과 텍스트 옵션이 모두 이용 가능한 경우 사용자의 60% 이상이 음성 기반 검색을 선택했다고 보고했습니다. DMM TV는 추천 코너를 통한 시청과 다른 플랫폼 경로를 통한 시청을 구분하는 측정 기법을 개발했습니다. 중국에서는 AI 기반 모바일 동영상 추천 서비스에 대해 YD/T 4886-2024 규격이 적용되고 있습니다. 이 규격은 2024년 10월에 시행되며, 관련 서비스에 대한 기술적 및 기능적 요건을 규정하고 있습니다.
유럽에서는 EU AI법, GDPR(EU 개인정보보호규정) 및 디지털 서비스법에 따라 동의 관리와 설명 가능한 추천 관행에 대한 필요성이 높아지고 있어 도입 요건이 더욱 엄격해지고 있습니다. 이러한 요건은 엔지니어링 비용을 증가시킬 수 있지만, 한편으로는 투명성이 높은 개인화 도구를 제공하는 공급자에 대한 수요도 높이고 있습니다. 중동에서는 샤르자 방송국이 2025년 5월, Maraya 플랫폼을 위해 Mediagenix 및 Spideo의 기술을 도입한 결과, 참여도가 20%에서 60%로 향상되었고 전환율이 35% 개선되었다고 보고했습니다. 아프리카에서는 스트리밍의 보급이 아직 초기 단계에 있지만, Mangomolo는 2025년부터 2026년에 걸쳐 남아프리카 방송공사(SABC)를 포함한 고객사를 대상으로 AI 개인화 및 현지화 기능을 확충했습니다. 이 지역들의 OTT 추천 엔진 시장은 현지 언어 지원, 지역별 컨텐츠 권리, 그리고 다양한 규제 요건에 대한 대응이라는 필요성에 의해 형성되고 있습니다.
기타 혜택 :
- 엑셀 형식 시장 예측(ME) 시트
- 3개월간의 애널리스트 지원
자주 묻는 질문
목차
제1장 서론
제2장 조사 방법
제3장 주요 요약
제4장 시장 구도
제5장 시장 규모 및 성장 예측
제6장 경쟁 구도
제7장 시장 기회 및 향후 전망
AJY 26.09.03According to Mordor Intelligence, the OTT recommendation engine market size is projected to expand from USD 0.90 billion in 2025 and USD 1.17 billion in 2026 to USD 2.48 billion by 2031, registering a CAGR of 16.21% between 2026 to 2031.

This report is Segmented by Deployment Mode (Cloud-Based, On-Premises, and More), End User (Broadcasters and Pay-TV Operators, Digital Media and Publishing Platforms, and More), Business Model (Recurring Subscription Billing (SVOD), and More), Application (Content Recommendation, Advertising and Promotional Recommendation, and More), and Geography. The Market Forecasts are Provided in Terms of Value (USD).
Global OTT Recommendation Engine Market Trends and Insights
Demand for Hyper-Personalized Viewer Experiences
Recommendation quality has become a central operating measure because it affects churn, viewing time, and advertising yield at the same time. Netflix research presented in 2026 found that its recommendation system affects both title choice and whether viewers watch at all, linking personalization to revenue per user rather than only interface quality. The OTT recommendation engine market is therefore moving toward systems that coordinate home-page layout, artwork selection, and editorial presentation together. Netflix reported that its GenPage system improved core engagement measures and reduced end-to-end serving latency by 20% compared with its earlier multi-stage recommender. JioHotstar reported that more than 60% of users selected voice when text and voice discovery were both offered, showing that discovery interfaces can shape the value delivered by the underlying model.
Rising Streaming Content Volumes
The OTT recommendation engine market is supported by catalog growth that makes manual discovery increasingly difficult. Amagi tracked more than 6,500 FAST channel deliveries on its THUNDERSTORM platform by mid-2026, increasing the need for accurate program metadata and search results. A 2026 Hub Entertainment Research report found that incomplete genre, rating, or episode data can reduce a program's visibility in search and weaken contextual advertising matches. Metadata enrichment is becoming as important as ranking quality because poor metadata can leave useful catalog titles unseen. ThinkAnalytics introduced ThinkMetadataAI at IBC2025 to automate content tagging across dozens of languages and connect that information to its discovery tools. Providers that combine enriched metadata with ranking systems are better placed to serve platforms seeking stronger discovery across large and varied libraries.
Data Privacy and Consent Management Requirements
Privacy and transparency obligations are making cross-border personalization programs more difficult to operate. The European Commission states that Article 50 transparency rules under the EU AI Act will apply from August 2, 2026, with disclosure and documentation obligations for relevant systems that interact with people. The Digital Services Act also affects services that use algorithmic curation by requiring meaningful options beyond profiling-based recommendations. The OTT recommendation engine market must therefore support clearer consent controls, documentation, and user-facing explanations. Separate training environments for data subject to European privacy rules can increase infrastructure costs and slow model updates. Larger providers with established consent and governance systems may find it easier to meet these requirements than smaller specialist vendors.
Other drivers and restraints analyzed in the detailed report include:
- First-Party Data Strategies in a Cookieless Advertising Environment
- Real-Time and Edge-AI Inference for Contextual Recommendations
- Cold-Start and Sparse-Interaction Limitations
For complete list of drivers and restraints, kindly check the Table Of Contents.
Segment Analysis
Cloud-based systems held 65.70% of the OTT recommendation engine market share in 2025 and are projected to grow at a 16.71% CAGR through 2031. Cloud delivery reduces the effort required to maintain feature stores, model retraining, and inference services for broadcaster-scale content libraries. It also allows teams to add capacity without building and operating the full underlying infrastructure. ByteDance's Volcengine offers a managed large-screen recommendation service for IPTV and OTT operators across home pages, channels, and content-detail pages. The service illustrates how the OTT recommendation engine market can offer packaged personalization to operators that do not maintain proprietary model teams.
On-premises systems remain relevant for state-owned broadcasters and operators subject to strict data-localization rules. These requirements are particularly important where cross-border transfer of viewer data is restricted. Hybrid arrangements are gaining attention among larger pay-TV operators that retain sensitive subscriber profiles within their own systems. Those operators can still use cloud capacity for less sensitive inference tasks and nonpersonal signals. This approach gives providers in the OTT recommendation engine market a way to preserve local control while providing flexible capacity without a fully isolated recommendation environment.
Broadcasters and pay-TV operators held 40.45% of revenue in 2025 within the OTT recommendation engine market. Their large content catalogs require effective discovery tools to make premium programs easier to find. As traditional broadcasters adopt streaming-led distribution, recommendation systems are becoming a retention tool rather than an optional app feature. Digital media and publishing platforms also use recommendation systems to manage high content volumes across news, podcasts, and user-generated material. Their use cases add demand for re-engagement and timely content presentation.
Connected-TV and device ecosystems are projected to grow at a 16.94% CAGR through 2031. Smart-TV manufacturers are placing recommendation features in the operating-system layer, allowing discovery to begin before a viewer enters an individual streaming app. In February 2026, Samsung partnered with Gracenote on LLM-enabled conversational search and discovery for its global smart-TV platform. Such integrations move discovery upstream toward the device interface. Device manufacturers can then influence audience attention, household-level discovery, and the advertising inventory associated with the home screen, which increases the importance of interoperability across the OTT recommendation engine market.
Complete Report Scope:
- By Deployment Mode
- Cloud-Based
- On-Premises
- Hybrid Deployment
- By End User
- Broadcasters and Pay-TV Operators
- Digital Media and Publishing Platforms
- Connected-TV and Device Ecosystems
- By Business Model
- Recurring Subscription Billing (SVOD)
- Transactional Billing (TVOD/PPV)
- Advertising-Supported Billing (AVOD/FAST)
- Hybrid Monetization Billing
- By Application
- Content Recommendation
- Advertising and Promotional Recommendation
- Commerce and Subscription Recommendation
- Other Applications
- By Geography
- North America
- United States
- Canada
- Mexico
- South America
- Brazil
- Argentina
- Rest of South America
- Europe
- United Kingdom
- Germany
- France
- Italy
- Spain
- Russia
- Rest of Europe
- Asia-Pacific
- China
- India
- Japan
- South Korea
- Singapore
- Australia
- Rest of Asia-Pacific
- Middle East
- United Arab Emirates
- Saudi Arabia
- Turkey
- Rest of Middle East
- Africa
- South Africa
- Nigeria
- Egypt
- Rest of Africa
- North America
Geography Analysis
North America held 40.45% of global revenue in 2025, giving the region the largest global revenue position. The region has a dense base of subscription and ad-supported streaming platforms, established programmatic advertising tools, and significant connected-TV usage. Amazon's July 2026 AI-focused redesign work on Prime Video showed that recommendation investment has moved beyond product teams to senior leadership priorities. Amagi reported that the United States and Canada generated 54% of global FAST viewing hours and 74% of global FAST advertising impressions in mid-2026. Roku found that 64% of Roku households stream FAST content, supporting the importance of operating-system-level discovery. In South America, SKY+ and DGO deployed Mediagenix and Spideo's recommendation engine across a 10,000-title catalog in April 2025, covering 170 and 260 live channels, respectively.
Asia-Pacific is projected to record the highest regional CAGR of 16.78% through 2031. India, China, South Korea, Japan, and Southeast Asian markets combine mobile-first usage with expanding vernacular-language catalogs. JioHotstar serves more than 200 million users and reported that over 60% of users chose voice-based discovery when voice and text options were available. DMM TV has developed measurement methods that distinguish views driven by recommendation rows from views arriving through other platform paths. China applies the YD/T 4886-2024 standard for AI-based mobile video recommendation services, which took effect in October 2024 and defines technical and functional requirements for relevant services.
Europe faces higher deployment requirements because the EU AI Act, GDPR, and Digital Services Act increase the need for consent controls and explainable recommendation practices. Those requirements can raise engineering costs, but they also increase demand for providers with transparent personalization tools. In the Middle East, Sharjah Broadcasting Authority deployed Mediagenix and Spideo technology for the Maraya platform in May 2025, reporting engagement gains of 20% to 60% and a 35% improvement in conversion. Africa remains earlier in streaming adoption, though Mangomolo expanded its AI personalization and localization capabilities through 2025 and 2026 for clients that include the South African Broadcasting Corporation. The OTT recommendation engine market in these regions is shaped by the need to support local languages, regional content rights, and differing regulatory expectations.
- Amazon Web Services, Inc.
- Google LLC
- Microsoft Corporation
- Netflix, Inc.
- Adobe Inc.
- ThinkAnalytics Ltd.
- Gracenote, Inc.
- ContentWise S.r.l.
- Recombee s.r.o.
- Dynamic Yield Ltd.
- Coveo Solutions Inc.
- Salesforce, Inc.
- Oracle Corporation
- SAP SE
- Algolia SAS
- Optimizely, Inc.
- Bloomreach Inc.
- Taboola, Inc.
- Outbrain Inc.
- Muvi LLC
- 24i Media Group B.V.
- Mediagenix NV
- Spideo SAS
- Argoid Analytics India Private Limited
- Kaltura, Inc.
Additional Benefits:
- The market estimate (ME) sheet in Excel format
- 3 months of analyst support
TABLE OF CONTENTS
1 INTRODUCTION
- 1.1 Study Assumptions and Market Definition
- 1.2 Scope of the Study
2 RESEARCH METHODOLOGY
3 EXECUTIVE SUMMARY
4 MARKET LANDSCAPE
- 4.1 Market Overview
- 4.2 Impact of Macroeconomic Factors on the Market
- 4.3 Market Drivers
- 4.3.1 Rising Streaming-Content Volumes
- 4.3.2 Demand for Hyper-Personalized Viewer Experiences
- 4.3.3 First-Party Data Strategies in a Cookieless Advertising Environment
- 4.3.4 Real-Time and Edge-AI Inference for Contextual Recommendations
- 4.3.5 Multilingual Content Expansion in Emerging Markets
- 4.3.6 Recommendation-Led Optimization of Retention and Advertising Yield
- 4.4 Market Restraints
- 4.4.1 Data Privacy and Consent Management Requirements
- 4.4.2 Cold-Start and Sparse-Interaction Limitations
- 4.4.3 Algorithmic Bias, Filter Bubbles, and Explainability Gaps
- 4.4.4 Escalating Compute, Feature-Store, and Model-Serving Costs
- 4.5 Industry Value-Chain Analysis
- 4.6 Regulatory Landscape
- 4.7 Technological Outlook
- 4.8 Porter's Five Forces
- 4.8.1 Threat of New Entrants Analysis
- 4.8.2 Bargaining Power of Suppliers Analysis
- 4.8.3 Bargaining Power of Buyers Analysis
- 4.8.4 Threat of Substitutes Analysis
- 4.8.5 Competitive Rivalry Analysis
5 MARKET SIZE AND GROWTH FORECASTS (VALUE)
- 5.1 By Deployment Mode
- 5.1.1 Cloud-Based
- 5.1.2 On-Premises
- 5.1.3 Hybrid Deployment
- 5.2 By End User
- 5.2.1 Broadcasters and Pay-TV Operators
- 5.2.2 Digital Media and Publishing Platforms
- 5.2.3 Connected-TV and Device Ecosystems
- 5.3 By Business Model
- 5.3.1 Recurring Subscription Billing (SVOD)
- 5.3.2 Transactional Billing (TVOD/PPV)
- 5.3.3 Advertising-Supported Billing (AVOD/FAST)
- 5.3.4 Hybrid Monetization Billing
- 5.4 By Application
- 5.4.1 Content Recommendation
- 5.4.2 Advertising and Promotional Recommendation
- 5.4.3 Commerce and Subscription Recommendation
- 5.4.4 Other Applications
- 5.5 By Geography
- 5.5.1 North America
- 5.5.1.1 United States
- 5.5.1.2 Canada
- 5.5.1.3 Mexico
- 5.5.2 South America
- 5.5.2.1 Brazil
- 5.5.2.2 Argentina
- 5.5.2.3 Rest of South America
- 5.5.3 Europe
- 5.5.3.1 United Kingdom
- 5.5.3.2 Germany
- 5.5.3.3 France
- 5.5.3.4 Italy
- 5.5.3.5 Spain
- 5.5.3.6 Russia
- 5.5.3.7 Rest of Europe
- 5.5.4 Asia-Pacific
- 5.5.4.1 China
- 5.5.4.2 India
- 5.5.4.3 Japan
- 5.5.4.4 South Korea
- 5.5.4.5 Singapore
- 5.5.4.6 Australia
- 5.5.4.7 Rest of Asia-Pacific
- 5.5.5 Middle East
- 5.5.5.1 United Arab Emirates
- 5.5.5.2 Saudi Arabia
- 5.5.5.3 Turkey
- 5.5.5.4 Rest of Middle East
- 5.5.6 Africa
- 5.5.6.1 South Africa
- 5.5.6.2 Nigeria
- 5.5.6.3 Egypt
- 5.5.6.4 Rest of Africa
- 5.5.1 North America
6 COMPETITIVE LANDSCAPE
- 6.1 Market Concentration
- 6.2 Strategic Moves
- 6.3 Market Share Analysis
- 6.4 Company Profiles (includes Global Level Overview, Market Level Overview, Core Segments, Financials as available, Strategic Information, Market Rank/Share, Products and Services, Recent Developments)
- 6.4.1 Amazon Web Services, Inc.
- 6.4.2 Google LLC
- 6.4.3 Microsoft Corporation
- 6.4.4 Netflix, Inc.
- 6.4.5 Adobe Inc.
- 6.4.6 ThinkAnalytics Ltd.
- 6.4.7 Gracenote, Inc.
- 6.4.8 ContentWise S.r.l.
- 6.4.9 Recombee s.r.o.
- 6.4.10 Dynamic Yield Ltd.
- 6.4.11 Coveo Solutions Inc.
- 6.4.12 Salesforce, Inc.
- 6.4.13 Oracle Corporation
- 6.4.14 SAP SE
- 6.4.15 Algolia SAS
- 6.4.16 Optimizely, Inc.
- 6.4.17 Bloomreach Inc.
- 6.4.18 Taboola, Inc.
- 6.4.19 Outbrain Inc.
- 6.4.20 Muvi LLC
- 6.4.21 24i Media Group B.V.
- 6.4.22 Mediagenix NV
- 6.4.23 Spideo SAS
- 6.4.24 Argoid Analytics India Private Limited
- 6.4.25 Kaltura, Inc.
7 MARKET OPPORTUNITIES AND FUTURE OUTLOOK
- 7.1 White-Space and Unmet-Need Assessment


