

|
시장보고서
상품코드
2118876
아시아태평양의 5G 기기 : 시장 점유율 분석, 업계 동향 및 통계, 성장 예측(2026-2031년)Asia-Pacific 5G Device - Market Share Analysis, Industry Trends & Statistics, Growth Forecasts (2026 - 2031) |
||||||
 Mordor Intelligence
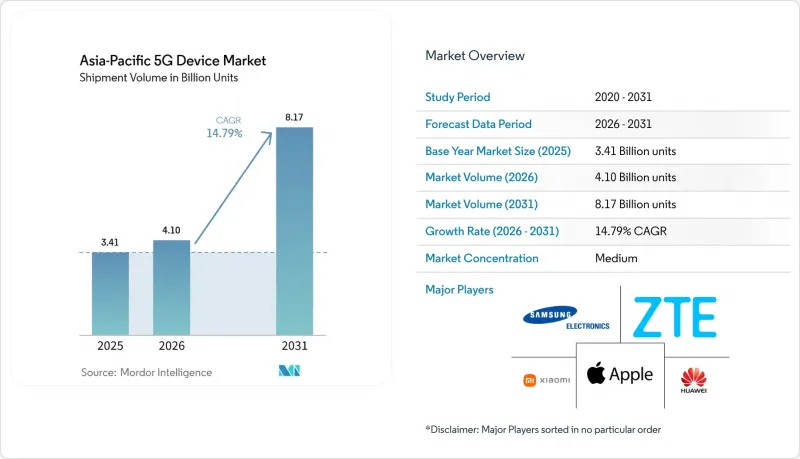
Mordor Intelligence에 의하면, 아시아태평양의 5G 기기 시장 규모(출하대수 기반)는 2025년 34억 1,000만 대로 평가되었습니다. 2026년에는 41억대로 확대되어 2026년부터 2031년에 걸쳐 CAGR 14.79%로 성장을 지속하여, 2031년까지 81억 7,000만 대에 이를 것으로 예측됩니다.
본 보고서는 폼 팩터(스마트폰, 고객 구내 장비(실내/실외) 등), 지원 주파수 대역(Sub-6GHz, mm파, 하이브리드(Sub-6GHz 및 mm파)), 최종 사용자 산업(소비자용 전자기기, 산업 및 제조 등),용도(고속 대용량 통신(eMBB) 등), 그리고 국가별로 분류되어 있습니다. 시장 예측은 수량(대수) 기준으로 제시되어 있습니다.
아시아태평양의 5G 기기 시장 동향 및 인사이트
5G 네트워크 구축 및 단말기 업그레이드 주기
중국의 네트워크 규모는 아시아태평양의 5G 기기 시장의 주요 수요원으로 계속 자리 잡고 있습니다. 중국에는 2025년 말 기준 483만 8,000기의 5G 기지국이 있었으며, 2026년 3월 말 기준으로는 495만 8,000기로 늘어났습니다. 2026년 초에는 5G-Advanced 서비스가 중국의 330개 도시로 확대되면서, 보다 고도화된 네트워크 기능을 지원할 수 있는 기기에 대한 수요가 발생하고 있습니다. 아시아태평양 전체에서는 2025년 중반까지 26개국 69개 통신 사업자가 상용 5G 서비스를 개시했으며, 13개 사업자가 네트워크를 구축 중이고, 17개 사업자가 서비스 도입을 계획하고 있습니다. 이 지역의 통신 사업자들은 2030년까지 네트워크 인프라에 2,540억 달러를 투자하겠다고 약속했으며, 그 주된 초점은 5G에 맞추어져 있습니다. 또한 싱가포르, 인도, 뉴질랜드에서 구형 네트워크가 폐지됨에 따라 미뤄졌던 장비 교체 결정이 단말기 구매로 이어지고 있습니다.
아시아태평양의 중저가 5G 스마트폰 보급률
인도는 단말기 가격 하락이 아시아태평양의 5G 기기 시장을 어떻게 확대하고 있는지를 여실히 보여주고 있습니다. 2025년 인도에서 출하된 스마트폰의 90% 이상이 5G를 지원했으며, 월간 5G 데이터 트래픽은 전년 대비 70% 증가한 12.9 엑사바이트에 달했습니다. 같은 해, 인도의 모바일 광대역 트래픽 중 47% 가까이가 5G를 통해 전송되었습니다. 100달러 미만의 5G 기기 출하 대수는 10배 이상 증가하여, 무선 하드웨어가 엔트리 레벨에 도달했음을 보여줍니다. 퀄컴은 2026년 5월, 인도에서 스냅드래곤 6Gen 5 및 스냅드래곤 4Gen 5 플랫폼을 발표하며, 인도를 중저가 및 보급형 단말기 개발의 중심지로 자리매김했습니다. 이 가격대는 5G 기기를 처음 구매하는 사용자와 기기 교체 수요를 모두 충족시키기 때문에 해당 지역의 출하 대수를 좌우하는 요인이 될 것입니다.
5G 기기 및 RF 부품의 높은 비용
RF 부품의 비용이 5G 하드웨어가 저가형 단말기에 얼마나 빠르게 보급될 수 있는지를 제한하고 있습니다. 플래그십급 5G 스마트폰 1대당 FR1 RF 부품에는 15-25달러, mm파 안테나 인 패키지(AIP) 모듈 1개당 20-80달러가 필요합니다. 따라서 RF 프런트엔드의 총 비용은 기기당 35-105달러로, 이는 단말기 부품 원가의 5%-15%에 해당합니다. 200달러 미만의 스마트폰 부품 원가 중 메모리와 스토리지가 30% 이상을 차지합니다. 동남아시아에서 출하되는 단말기의 60% 이상이 이 가격대에 해당하기 때문에 부품 가격의 급등은 합리적인 가격 유지와 제조업체의 이익률에 영향을 미칠 가능성이 있습니다. 2026년에는 RF 프런트엔드의 리드타임이 16-26주에 달할 것으로 예상되며, AI 인프라가 첨단 패키징 기술과 웨이퍼 생산 능력을 놓고 경쟁하고 있어 조달 측면의 압박이 커지고 있습니다.
부문별 분석
2025년, 스마트폰은 지역 전체 기기 출하 대수의 65.40%를 차지했습니다. 이는 해당 지역의 모바일 우선 고객 기반과 휴대전화 단말기 제조 능력에 힘입은 결과입니다. 2025년 9월 말 기준, 차이나 모바일(China Mobile)의 5G 가입자 수는 12억 명을 넘어섰습니다. 이러한 도입 기반은 저가형, 중급형, 프리미엄층을 포함한 아시아태평양 시장 전체의 5G 기기 출하를 뒷받침하고 있습니다. 고정 무선 서비스에는 라우터나 실외 장치가 필요하기 때문에 도입 속도 측면에서 고객 구내 장비는 두 번째로 큰 폼 팩터로서 기여도를 차지하고 있습니다. 산업용 라우터, 게이트웨이, 모듈, 핫스팟은 출하 대수는 적지만, 주류 소비자용 기기보다 단가가 높습니다.
웨어러블 단말기 및 XR 기기는 2026년부터 2031년까지 연평균 성장률(CAGR) 16.25%를 나타낼 것으로 예측됩니다. 싱가포르, 한국, 일본 및 중국의 주요 도시에서는 이미 저지연 공간 컴퓨팅을 지원할 수 있는 5G 독립형(SA) 통신 구역이 구축되어 있습니다. SoftBank Corp, Ericsson Japan, Qualcomm Technologies는 2025년 12월 도쿄에서 상용 5G 독립형 방식을 이용한 XR 스트리밍 현장 시험을 완료했습니다. 또한, 한국의 기업용 및 AR/VR 용도 수요 역시 기기 제조업체들이 mmWave(mm파) 지원 및 강화된 Sub-6GHz 플랫폼을 개발하도록 촉진하고 있습니다. 인도의 생산 연계형 인센티브 프로그램은 전자기기 조립 분야에 대한 투자를 유치하여 소비자용 기기의 단가 인하에 기여하고 있습니다.
2025년, 아시아태평양의 5G 기기 시장 규모 중 Sub-6GHz 대역 단말기가 59.66%를 차지했습니다. 이 주파수 대역은 광범위한 커버리지, 낮은 통합 비용, 그리고 다양한 지역 시장에서 완화된 규제 조건을 제공합니다. 특히 5G 커버리지가 n77 및 n78 주파수 대역을 중심으로 이루어지는 지역에서는 그 입지가 확고합니다. 또한 소비자의 가격 민감도 역시 mm파 하드웨어의 단기적인 잠재 고객층을 제한하는 요인으로 작용하고 있습니다. Sub-6GHz와 밀리파를 모두 지원하는 하이브리드 단말기는 일본과 한국에서 여전히 프리미엄층 및 기업용 이용 사례에 집중되어 있습니다.
mm파 단말기 시장은 2025년의 소규모 기반에서 2031년에 걸쳐 연평균 성장률(CAGR) 16.05%로 확대될 것으로 예측됩니다. 아시아태평양의 5G 기기 시장 수요는 높은 처리량과 낮은 지연 시간을 필요로 하는 사설 네트워크, 반도체 공장 및 고밀도 시설에 의해 주도되고 있습니다. ASE Technology는 2.6GHz 및 28GHz 링크에서 600 Mbps 업링크를 목표로 하는 5G mm파 NR-DC 독립형 방식의 스마트 팩토리 계획을 발표했습니다. 일본과 한국에서는 N257 및 N258 대역에 대해 엄격한 형식 인증 규정이 적용되고 있습니다. 이 프리미엄 부문에서는 확립된 인증 실적이 Samsung Electronics, 퀄컴, 소니 그룹에 유리하게 작용할 가능성이 있습니다.
기타 혜택 :
- 엑셀 형식 시장 예측(ME) 시트
- 3개월간의 애널리스트 지원
자주 묻는 질문
목차
제1장 서론
제2장 조사 방법
제3장 주요 요약
제4장 시장 구도
제5장 시장 규모 및 성장 예측
제6장 경쟁 구도
제7장 시장 기회 및 향후 전망
KTH 26.09.04According to Mordor Intelligence, the Asia-Pacific 5G device market size in terms of shipment volume is expected to grow from 3.41 billion units in 2025 to 4.10 billion units in 2026 and is forecast to reach 8.17 billion units by 2031 at 14.79% CAGR over 2026-2031.
This report is Segmented by Form Factor (Smartphones, Customer-Premises Equipment (Indoor/Outdoor), and More), Spectrum Support (Sub-6 GHz, Mmwave, and Hybrid (Sub-6 GHz and MmWave)), End User Industry (Consumer Electronics, Industrial and Manufacturing, and More), Application (Enhanced Mobile Broadband (eMBB), and More), and Country. The Market Forecasts are Provided in Terms of Volume (Units).
Asia-Pacific 5G Device Market Trends and Insights
5G Network Rollout and Device Upgrade Cycles
China's network scale remains a major source of demand for the Asia-Pacific 5G device market. China had 4.838 million 5G base stations at the end of 2025 and 4.958 million at the end of March 2026. 5G-Advanced service had reached 330 Chinese cities in early 2026, creating demand for devices that can support more advanced network functions. Across the region, 69 operators in 26 countries had launched commercial 5G by mid-2025, with 13 operators deploying networks and 17 planning services. Regional telecom operators have committed USD 254 billion to network infrastructure through 2030, with 5G as the main focus. The retirement of older networks in Singapore, India, and New Zealand has also led to delayed replacement decisions being converted into device purchases.
Mid-Range 5G Smartphone Penetration in Asia-Pacific
India illustrates how lower device prices are expanding the Asia-Pacific 5G device market. More than 90% of smartphones shipped in India in 2025 were 5G-enabled, while monthly 5G data traffic rose 70% year over year to 12.9 exabytes. Nearly 47% of India's mobile broadband traffic was carried on 5G during that year. Shipments of 5G handsets priced below USD 100 increased more than tenfold, indicating that radio hardware has reached the entry-level. Qualcomm introduced Snapdragon 6 Gen 5 and Snapdragon 4 Gen 5 platforms in India in May 2026, placing the country at the center of development for mid-range and entry devices. This price range is likely to shape regional shipment volumes, as it serves both first-time 5G buyers and replacement customers.
High Bill of Materials for 5G Devices and RF Components
The cost of RF components limits how quickly 5G hardware can move into lower-priced devices. A flagship 5G handset requires USD 15 to USD 25 of FR1 RF components and USD 20 to USD 80 for each mmWave antenna-in-package module. The total RF front-end cost can therefore range from USD 35 to USD 105 per device, or 5% to 15% of the handset bill of materials. Memory and storage account for more than 30% of the bill of materials in smartphones priced below USD 200. More than 60% of devices shipped in Southeast Asia fall into this price band, so component inflation can affect affordability and manufacturer margins. RF front-end lead times of 16 to 26 weeks in 2026 add procurement pressure as AI infrastructure competes for advanced packaging and wafer capacity.
Other drivers and restraints analyzed in the detailed report include:
- Industrial 5G and Private Network Device Adoption
- Fixed Wireless Access Substitution for Last-Mile Broadband
- mmWave Cost and Integration Complexity
For complete list of drivers and restraints, kindly check the Table Of Contents.
Segment Analysis
Smartphones held 65.40% of regional device volume in 2025, supported by the region's mobile-first customer base and handset manufacturing capacity. China Mobile's 5G subscriber base exceeded 1.2 billion mobile users at the end of September 2025. This installed base supports shipments of 5G devices across the Asia-Pacific market, including low-cost, mid-range, and premium tiers. Customer-premises equipment is the second-largest form-factor contributor by deployment velocity because fixed wireless services require routers and outdoor units. Industrial routers, gateways, modules, and hotspots have smaller volumes but higher unit values than mainstream consumer devices.
Wearables and XR devices are projected to grow at a 16.25% CAGR from 2026 to 2031. Singapore, South Korea, Japan, and major Chinese cities already have 5G standalone coverage that can support lower-latency spatial computing. SoftBank Corp., Ericsson Japan, and Qualcomm Technologies completed a commercial 5G standalone XR streaming field trial in Tokyo during December 2025. South Korea's enterprise and AR/VR uses are also encouraging device makers to pursue mmWave-capable and enhanced sub-6 GHz platforms. India's production-linked incentive program has attracted investment in electronics assembly and supports lower unit costs for consumer devices.
Sub-6 GHz devices accounted for 59.66% of the Asia-Pacific 5G device market size in 2025. The band provides broad coverage, lower integration cost, and accessible regulatory conditions across diverse regional markets. Its position is particularly durable where 5G coverage is centered on n77 and n78 spectrum. Consumer price sensitivity also limits the near-term addressable base for mmWave hardware. Hybrid devices that support both sub-6 GHz and mmWave remain concentrated in premium and enterprise use cases in Japan and South Korea.
mmWave devices are projected to expand at a 16.05% CAGR through 2031 from a smaller 2025 base. Demand in the Asia-Pacific 5G device market is driven by private networks, semiconductor plants, and high-density venues that require high throughput and low latency. ASE Technology has announced plans for a 5G mmWave NR-DC standalone smart factory targeting a 600 Mbps uplink over 2.6 GHz and 28 GHz links. Japan and South Korea apply strict type-approval rules for the N257 and N258 bands. Established certification records can favor Samsung Electronics, Qualcomm, and Sony Group in this premium tier.
Complete Report Scope:
- By Form Factor
- Smartphones
- Customer-Premises Equipment (Indoor/Outdoor)
- Industrial Grade Routers/Gateways
- Modules
- Laptops/Tablets
- Hotspots
- Wearables and XR Devices
- By Spectrum Support
- Sub-6 GHz
- mmWave
- Hybrid (Sub-6 GHz and mmWave)
- By End-User Industry
- Consumer Electronics
- Industrial and Manufacturing
- Automotive and Transportation
- Healthcare
- Energy and Utilities
- Enterprise/Commercial
- By Application
- Enhanced Mobile Broadband (eMBB)
- Ultra-Reliable Low-Latency Comms (URLLC)
- Massive Machine-Type Comms (mMTC)
- Fixed Wireless Access
- Vehicle-to-Everything (V2X)
- By Country
- China
- Japan
- India
- South Korea
- ASEAN
- Rest of Asia-Pacific
List of Companies Covered in this Report:
- Apple Inc.
- Samsung Electronics Co., Ltd.
- Xiaomi Corporation
- Huawei Technologies Co., Ltd.
- ZTE Corporation
- Sony Group Corporation
- D-Link Corporation
- Nokia Corporation
- Fibocom Wireless Inc.
- Inseego Corp.
- HTC Corporation
- Askey Computer Corp.
- Lenovo Group Limited
- Qualcomm Incorporated
- MediaTek Inc.
- Quectel Wireless Solutions Co., Ltd.
- MeiG Smart Technology Co., Ltd.
- SIMCom Wireless Solutions Co., Ltd.
- OPPO (OPPO Mobile Telecommunications Corp. Ltd.)
- Vivo Mobile Communication Co., Ltd.
Additional Benefits:
- The market estimate (ME) sheet in Excel format
- 3 months of analyst support
TABLE OF CONTENTS
1 INTRODUCTION
- 1.1 Study Assumptions and Market Definition
- 1.2 Scope of the Study
2 RESEARCH METHODOLOGY
3 EXECUTIVE SUMMARY
4 MARKET LANDSCAPE
- 4.1 Market Overview
- 4.2 Market Drivers
- 4.2.1 5G Network Rollout and Device Upgrade Cycles
- 4.2.2 Mid-Range 5G Smartphone Penetration in Asia-Pacific
- 4.2.3 Industrial 5G and Private Network Device Adoption
- 4.2.4 Fixed Wireless Access Substitution for Last-Mile Broadband
- 4.2.5 5G RedCap and Low-Power Device Enablement
- 4.2.6 AI-Ready Handsets and Premium Device Refresh Demand
- 4.3 Market Restraints
- 4.3.1 High Bill of Materials for 5G Devices and RF Components
- 4.3.2 mmWave Cost and Integration Complexity
- 4.3.3 Supply Chain Dependence on Advanced Semiconductors
- 4.3.4 Industrial Integration Complexity Across Legacy Systems
- 4.4 Industry Value Chain Analysis
- 4.5 Regulatory Landscape
- 4.6 Technological Outlook
- 4.7 Porter's Five Forces Analysis
- 4.7.1 Bargaining Power of Suppliers
- 4.7.2 Bargaining Power of Buyers
- 4.7.3 Threat of New Entrants
- 4.7.4 Threat of Substitutes
- 4.7.5 Intensity of Competitive Rivalry
5 MARKET SIZE AND GROWTH FORECASTS (VOLUME)
- 5.1 By Form Factor
- 5.1.1 Smartphones
- 5.1.2 Customer-Premises Equipment (Indoor/Outdoor)
- 5.1.3 Industrial Grade Routers/Gateways
- 5.1.4 Modules
- 5.1.5 Laptops/Tablets
- 5.1.6 Hotspots
- 5.1.7 Wearables and XR Devices
- 5.2 By Spectrum Support
- 5.2.1 Sub-6 GHz
- 5.2.2 mmWave
- 5.2.3 Hybrid (Sub-6 GHz and mmWave)
- 5.3 By End-User Industry
- 5.3.1 Consumer Electronics
- 5.3.2 Industrial and Manufacturing
- 5.3.3 Automotive and Transportation
- 5.3.4 Healthcare
- 5.3.5 Energy and Utilities
- 5.3.6 Enterprise/Commercial
- 5.4 By Application
- 5.4.1 Enhanced Mobile Broadband (eMBB)
- 5.4.2 Ultra-Reliable Low-Latency Comms (URLLC)
- 5.4.3 Massive Machine-Type Comms (mMTC)
- 5.4.4 Fixed Wireless Access
- 5.4.5 Vehicle-to-Everything (V2X)
- 5.5 By Country
- 5.5.1 China
- 5.5.2 Japan
- 5.5.3 India
- 5.5.4 South Korea
- 5.5.5 ASEAN
- 5.5.6 Rest of Asia-Pacific
6 COMPETITIVE LANDSCAPE
- 6.1 Market Concentration
- 6.2 Strategic Moves
- 6.3 Market Share Analysis
- 6.4 Company Profiles (includes Global Level Overview, Market Level Overview, Core Segments, Financials as available, Strategic Information, Market Rank/Share, Products and Services, Recent Developments)
- 6.4.1 Apple Inc.
- 6.4.2 Samsung Electronics Co., Ltd.
- 6.4.3 Xiaomi Corporation
- 6.4.4 Huawei Technologies Co., Ltd.
- 6.4.5 ZTE Corporation
- 6.4.6 Sony Group Corporation
- 6.4.7 D-Link Corporation
- 6.4.8 Nokia Corporation
- 6.4.9 Fibocom Wireless Inc.
- 6.4.10 Inseego Corp.
- 6.4.11 HTC Corporation
- 6.4.12 Askey Computer Corp.
- 6.4.13 Lenovo Group Limited
- 6.4.14 Qualcomm Incorporated
- 6.4.15 MediaTek Inc.
- 6.4.16 Quectel Wireless Solutions Co., Ltd.
- 6.4.17 MeiG Smart Technology Co., Ltd.
- 6.4.18 SIMCom Wireless Solutions Co., Ltd.
- 6.4.19 OPPO (OPPO Mobile Telecommunications Corp. Ltd.)
- 6.4.20 Vivo Mobile Communication Co., Ltd.
7 MARKET OPPORTUNITIES AND FUTURE OUTLOOK
- 7.1 White-Space and Unmet-Need Assessment


