|
시장보고서
상품코드
2121820
유리섬유 : 시장 점유율 분석, 업계 동향과 통계, 성장 예측(2026-2031년)Glass Fiber - Market Share Analysis, Industry Trends & Statistics, Growth Forecasts (2026 - 2031) |
||||||
 Mordor Intelligence
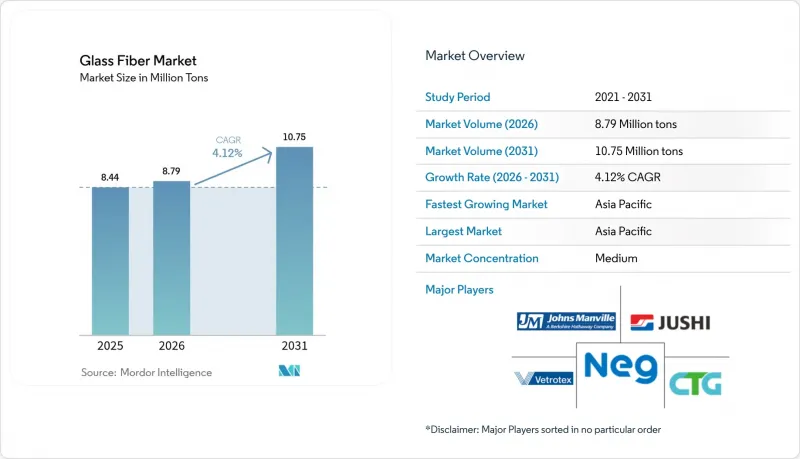
Mordor Intelligence에 따르면 유리섬유 시장 규모는 2025년 844만 톤에서 2026년에는 879만 톤으로 확대하며, 2026-2031년에 CAGR 4.12%로 추이하며, 2031년에는 1,075만 톤에 달할 것으로 예측됩니다.
이 보고서는 제품 형태(로빙, 매트, 스트랜드, 원사, 기타), 섬유 유형(E-글라스, S-글라스,E-CR 유리, C 유리, 기타), 최종사용자 산업(건축·건설, 자동차, 풍력발전, 항공우주·방위, 선박, 기타), 지역(아시아태평양, 북미, 유럽, 남미, 중동 및 아프리카)별로 분류되어 있습니다. 시장 예측은 톤 기준으로 제시되어 있습니다.
세계 유리섬유 시장의 동향 및 인사이트
아시아에서 팬데믹 이후 건설 붐에 따른 글라스울 단열재 수요 확대
인도는 2025 회계연도에 인프라 정비에 1,200억 달러를 배정했으나, 그 지출의 거의 절반은 주택 프로젝트에 할당되었으며, 2024년 에너지 절약 건축 기준에 따라 현재 이러한 프로젝트에서는 글라스울 단열재의 사용이 의무화되어 있습니다. 베트남의 건설 부문은 2025년에 9.1% 성장할 전망이며, 외국계 공장에서는 저밀도 글라스울을 사용한 클린룸용 단열재가 지정되어 있습니다. 인도네시아는 2025 회계연도 인프라 정비에 410조 루피아(270억 달러)를 배정했으며, 열대 지역 주택에서 냉방 부하를 최대 35%까지 줄여주는 글라스울 제품을 채택하고 있습니다. 말레이시아와 태국에서도 유사한 추세가 나타나고 있으며, 데이터센터 및 콜드 체인 투자자들은 ASHRAE 90.1의 목표를 달성하기 위해 더 높은 R값을 가진 단열재를 채택하고 있습니다. 이러한 노력들이 합쳐져 아시아는 유리섬유 시장 성장의 핵심적인 위치를 계속 유지하고 있습니다.
전기자동차(EV) 경량화에 따른 잘게 자른 스트랜드 복합재 채택 가속화
2025년 전 세계 배터리 전기자동차(BEV) 생산 대수는 1,420만 대에 달해 2024년 대비 19% 증가했으며, 이는 복합재료 수요를 끌어올렸습니다. 테슬라의 ‘모델 Y’는 찹드 스트랜드 매트 구조를 채택함으로써 화이트 바디의 무게를 23% 줄이고, 1회 충전당 주행 거리를 18km 연장했습니다. BYD, 폭스바겐, 제너럴 모터스는 각각 배터리 트레이에 유리섬유 강화 열가소성 플라스틱(GFRP)을 적용하는 방안을 검증했으며, 알루미늄 제품과 비교하여 차량당 총 300달러 이상의 비용 절감을 실현했습니다. 자동차 제조사들이 원가 평준화를 달성한 전기자동차 실현을 위해 노력하는 가운데, 잘게 자른 스트랜드의 대량 발주가 유리섬유 시장의 꾸준한 한 자릿수 중반대 성장을 지원하고 있습니다.
탄소섬유 가격 하락에 따른 유리섬유의 비용 우위 축소
도레이, 미쓰비시 화학, SGL 카본은 2025년에 총 9,500톤의 탄소섬유 공칭 생산 능력을 추가하여 평균 가격을 킬로그램당 16.30달러까지 낮췄습니다. 자동차용 컴파운드의 비용 격차는 2023년 2.4배에서 현재는 유리섬유 폴리프로필렌 대비 불과 2배로 줄었습니다. 스포츠 용품 OEM 각사는 저비용 샤프트의 도입을 추진하고 있으며, 이로 인해 E-글라스에서 중가대 수요가 빼앗길 가능성이 있습니다. 대책이 마련되지 않으면, 이러한 동향으로 인해 유리섬유 시장의 성장세가 둔화될 것으로 보입니다.
부문 분석
로빙은 2025년 수량의 33.45%를 차지하며, 2031년 연평균 성장률(CAGR)은 4.41%에 달할 전망입니다. 이는 15MW 해상 풍력 터빈 1기당 35톤의 단방향 섬유가 소비되므로 유리섬유 시장 전체를 상회하는 성장률을 기록하고 있습니다. 그 뒤를 매트가 따르며, 그 수요는 저비용의 중국 및 터키 조선소에서 생산되는 자동차 언더바디 패널과 선박용 라미네이트에 의해 지원되고 있습니다. 글라스울은 유럽과 북미 전역에 걸친 개보수 의무화의 호재를 타고 있습니다. 스트랜드, 원사, ‘기타’ 그룹은 인쇄회로기판, 여과용 섬유, 특수 접착제에 공급되고 있지만, 직접 로빙을 이용한 풀트라지션 공법이 중간 형태 시장을 잠식하고 있습니다.
로빙의 기존 설비는 자동차용 압축 성형에서 사이클 타임을 4분(찹드 스트랜드 매트의 절반)으로 단축하는 공정 개선의 혜택을 받고 있습니다. 글라스울 제조업체들은 바인더 함유량을 3%로 줄여 R값을 향상시키는 동시에 캘리포니아주의 VOC 규제 기준을 충족하고 있습니다. 밀드 파이버는 계속해서 실란트의 유변학 조절제로 사용되고 있는 반면, 직물은 항공우주 부문의 공구 수요를 지원하고 있습니다. 전반적으로 용도의 다양화로 인해 유리섬유 산업은 단일 부문의 변동으로부터 보호받고 있습니다.
지역별 분석
아시아태평양은 2025년 생산량의 49.81%를 차지하며 유리섬유 시장을 주도하고 있으며, 2031년까지 연평균 성장률(CAGR) 4.57%로 성장할 것으로 예상됩니다. 인도만 해도 180만 톤을 소비하여 전년 대비 19% 증가했습니다. 이는 개발업체들이 강화된 단열 기준을 충족했기 때문입니다. 중국은 520만 톤을 생산했으나, 그 중 38%를 수출하고 있으며, 이는 지속적인 생산 과잉과 적극적인 수출 물류를 반영합니다. 베트남에서는 2025년 1.2GW 규모의 풍력발전 설비 건설에 9,600톤의 로빙이 필요할 것으로 예상되는 반면, 인도네시아에서는 전기자동차 및 이륜차 붐으로 인해 이륜차용 배터리 케이스용 복합재료 소비량이 증가했습니다.
2025년에는 북미가 시장 점유율에서 큰 비중을 차지했습니다. 미국에서는 ‘인플레이션 억제법(Inflation Reduction Act)’의 우대 조치에 따라 12GW 규모의 풍력발전 설비가 도입되었으며, 이로 인해 9만 6,000톤의 로빙 수요가 발생했습니다. 캐나다의 ‘그리너 홈즈 그랜트(Greener Homes Grant)’에서는 글라스울이 주류를 이루는 18만 세트의 개조 키트가 도입되었으며, 멕시코에서는 380만 대의 차량이 생산되었고, 그중 28%에 복합재료가 사용되었습니다.
2025년, 유럽은 유리섬유 소비에서 큰 비중을 차지했으며, 독일, 프랑스, 영국이 전체의 58%를 차지했습니다. 독일에서는 42만 호의 주택 개보수가 이루어져 글라스울 배트가 대량으로 사용된 반면, 프랑스에서는 2.1GW 규모의 풍력발전 설비가 신설되어 1만 6,800톤의 로빙이 필요했습니다. 영국에서는 자동차 산업이 부진했으나, 에어버스(Airbus)사가 A320neo 주익 세트의 생산량을 늘리면서 항공우주 부문은 호조를 보였습니다. 남미와 중동 및 아프리카에서는 브라질의 230만 대 자동차 보유 대수와 1만 2,000톤의 E-CR 유리를 소비하는 사우디아라비아의 수소 파이프라인 덕분에 수요가 확대되고 있습니다.
기타 혜택
- 엑셀 형식의 시장 예측(ME) 시트
- 3개월간의 애널리스트 지원
목차
제1장 서론
제2장 조사 방법
제3장 개요
제4장 시장 구도
제5장 시장 규모와 성장 예측
제6장 경쟁 구도
제7장 시장 기회와 향후 전망
KSAAccording to Mordor Intelligence, the glass fiber market size is expected to grow from 8.44 million tons in 2025 to 8.79 million tons in 2026 and is forecast to reach 10.75 million tons by 2031 at a 4.12% CAGR over 2026-2031.
This report is Segmented by Product Form (Roving, Mats, Strands, Yarn, and More), Fiber Type (E-Glass, S-Glass, E-CR Glass, C-Glass, and Others), End-User Industry (Building and Construction, Automotive, Wind Energy, Aerospace and Defense, Marine, and More), and Geography (Asia-Pacific, North America, Europe, South America, Middle East and Africa). The Market Forecasts are Provided in Terms of Volume (Tons).
Global Glass Fiber Market Trends and Insights
Post-Pandemic Construction Boom in Asia Bolsters Demand for Glass-Wool Insulation
India allocated USD 120 billion to infrastructure in fiscal 2025, and nearly half of that spending went into residential projects where glass-wool batts are now required by the 2024 Energy Conservation Building Code. Vietnam's construction sector advanced 9.1% in 2025, with foreign-invested factories specifying clean-room insulation that relies on low-density glass wool. Indonesia earmarked IDR 410 trillion (USD 27 billion) for 2025 infrastructure, using glass-wool products that cut cooling loads by up to 35% in tropical housing. Malaysia and Thailand show parallel trends as data-center and cold-chain investors adopt higher R-value batts to meet ASHRAE 90.1 targets. Collectively, these programs keep Asia the anchor of glass fiber market growth.
EV Lightweighting Accelerates Adoption of Chopped-Strand Composites
Global battery-electric vehicle production hit 14.2 million units in 2025, a 19% jump over 2024 that propelled composite demand. Tesla's Model Y uses chopped-strand mat structures to trim body-in-white mass by 23%, translating into an 18 km range extension per charge. BYD, Volkswagen, and General Motors each validated glass-fiber-reinforced thermoplastics for battery trays, together saving more than USD 300 per vehicle against aluminum alternatives. As automakers push toward cost-parity EVs, volume contracts for chopped strands underpin a steady mid-single-digit rise in the glass fiber market.
Carbon-Fiber Price Erosion Narrows Glass-Fiber's Cost Advantage
Toray, Mitsubishi Chemical, and SGL Carbon added a combined 9,500 tons of carbon-fiber nameplate capacity during 2025, pushing average prices down to USD 16.30 per kilogram. Automotive compounds now see a cost gap of only 2X versus glass-fiber polypropylene, compared with 2.4X in 2023. Sporting goods OEMs are piloting lower-cost shafts that could siphon mid-tier volumes away from E-Glass. Absent countermeasures, this trend trims the glass fiber market growth trajectory.
Other drivers and restraints analyzed in the detailed report include:
- Mega-Scale Wind-Turbine Blades Expand Roving Consumption
- EU and North-American Retrofit Energy Codes Mandate Additional Insulation
- Rock-Wool Producers Target Less Than 100 kg/m3 HVAC Niche
For complete list of drivers and restraints, kindly check the Table Of Contents.
Segment Analysis
Roving contributed 33.45% to 2025 volume and is on track for 4.41% CAGR through 2031, outpacing the broader glass fiber market because each 15 MW offshore turbine consumes 35 tons of unidirectional material. Mats follow, anchored in automotive underbody panels and marine laminates produced in low-cost Chinese and Turkish yards. Glass wool receives a tailwind from retrofit mandates across Europe and North America. Strands, yarns, and the "others" cluster supply printed-circuit boards, filtration textiles, and specialty adhesives, but direct-roving pultrusion is cannibalizing intermediate formats.
Roving's installed base benefits from process improvements that cut cycle time in automotive compression molding to four minutes, half that of chopped-strand mats. Glass-wool producers are lowering binder content to 3%, improving R-value, and meeting VOC limits in California. Milled fiber remains a rheology modifier in sealants, whereas woven fabrics secure aerospace tooling demand. All told, diversified applications shield the glass fiber industry against single-segment swings.
Complete Report Scope:
- By Product Form
- Roving
- Mats
- Strands
- Yarn
- Glass Wool
- Others (Milled Fiber and Fabrics)
- By Fiber Type
- E-Glass
- S-Glass
- E-CR Glass
- C-Glass
- Others
- By End-user Industry
- Building and Construction
- Automotive
- Wind Energy
- Aerospace and Defense
- Marine
- Sports and Leisure
- Other End-user Industries (Electronics)
- By Geography
- Asia-Pacific
- China
- India
- Japan
- South Korea
- Indonesia
- Vietnam
- Malaysia
- Thailand
- Rest of Asia-Pacific
- North America
- United States
- Canada
- Mexico
- Europe
- Germany
- France
- United Kingdom
- Italy
- Spain
- Russia
- Turkey
- Nordics
- Rest of Europe
- South America
- Brazil
- Argentina
- Colombia
- Rest of South America
- Middle-East and Africa
- Saudi Arabia
- United Arab Emirates
- Qatar
- Egypt
- South Africa
- Nigeria
- Rest of Middle-East and Africa
- Asia-Pacific
Geography Analysis
Asia-Pacific dominated the glass fiber market with 49.81% of 2025 volume and is slated for a 4.57% CAGR to 2031. India alone absorbed 1.8 million tons, up 19% year-on-year, as developers met strengthened thermal codes. China produced 5.2 million tons but exported 38%, reflecting persistent overcapacity and aggressive outbound logistics. Vietnam's 1.2 GW of 2025 wind builds needed 9,600 tons of roving, while Indonesia's EV-motorcycle boom raised composite consumption in two-wheel battery enclosures.
North America accounted for a significant market share in 2025. The U.S. installed 12 GW of wind capacity under Inflation Reduction Act incentives, translating into 96,000 tons of roving demand. Canada's Greener Homes Grant installed 180,000 retrofit kits dominated by glass wool, and Mexico produced 3.8 million vehicles using composites in 28% of units.
Europe accounted for significant glass fiber consumption in 2025, with Germany, France, and the U.K. making up 58%. Germany's 420,000 home retrofits drew heavily on glass-wool batts, whereas France added 2.1 GW of wind that required 16,800 tons of roving. The U.K. saw automotive softness but aerospace upside as Airbus raised A320neo wing set output. South America and the Middle East-Africa together are witnessing the rising demand driven by Brazil's 2.3 million-unit auto fleet and Saudi Arabia's hydrogen pipelines that consume 12,000 tons of E-CR glass.
- 3B - the fibreglass company
- AGY
- ASAHI FIBER GLASS Co., Ltd
- China Jushi Co., Ltd.
- Chongqing International Composite Materials Co., Ltd.
- Envalior
- Gurit Services AG
- Heraeus Holding
- Johns Manville
- Nippon Electric Glass Co., Ltd.
- PFG FIBER GLASS CORPORATION
- Praana Group
- Saint-Gobain
- Taishan Fiberglass Inc.(CTG)
- Taiwan Glass Ind. Corp.
Additional Benefits:
- The market estimate (ME) sheet in Excel format
- 3 months of analyst support
TABLE OF CONTENTS
1 Introduction
- 1.1 Study Assumptions and Market Definition
- 1.2 Scope of the Study
2 Research Methodology
3 Executive Summary
4 Market Landscape
- 4.1 Market Overview
- 4.2 Market Drivers
- 4.2.1 Post-pandemic construction boom in Asia bolsters demand for glass-wool insulation
- 4.2.2 EV lightweighting accelerates adoption of chopped-strand composites
- 4.2.3 Mega-scale wind-turbine blades expand roving consumption
- 4.2.4 EU and North-American retrofit energy codes mandate additional insulation
- 4.2.5 Hydrogen pipeline projects specify E-CR glass for chemical resistance
- 4.3 Market Restraints
- 4.3.1 Carbon-fiber price erosion narrows glass-fiber's cost advantage
- 4.3.2 Rock-wool producers target Less Than 100 kg m-3 HVAC niche
- 4.3.3 Volatile soda-ash and energy costs crimp Chinese furnace margins
- 4.4 Value Chain Analysis
- 4.5 Porter's Five Forces
- 4.5.1 Bargaining Power of Suppliers
- 4.5.2 Bargaining Power of Consumers
- 4.5.3 Threat of New Entrants
- 4.5.4 Threat of Substitute Products
- 4.5.5 Degree of Competition
5 Market Size and Growth Forecasts (Volume)
- 5.1 By Product Form
- 5.1.1 Roving
- 5.1.2 Mats
- 5.1.3 Strands
- 5.1.4 Yarn
- 5.1.5 Glass Wool
- 5.1.6 Others (Milled Fiber and Fabrics)
- 5.2 By Fiber Type
- 5.2.1 E-Glass
- 5.2.2 S-Glass
- 5.2.3 E-CR Glass
- 5.2.4 C-Glass
- 5.2.5 Others
- 5.3 By End-user Industry
- 5.3.1 Building and Construction
- 5.3.2 Automotive
- 5.3.3 Wind Energy
- 5.3.4 Aerospace and Defense
- 5.3.5 Marine
- 5.3.6 Sports and Leisure
- 5.3.7 Other End-user Industries (Electronics)
- 5.4 By Geography
- 5.4.1 Asia-Pacific
- 5.4.1.1 China
- 5.4.1.2 India
- 5.4.1.3 Japan
- 5.4.1.4 South Korea
- 5.4.1.5 Indonesia
- 5.4.1.6 Vietnam
- 5.4.1.7 Malaysia
- 5.4.1.8 Thailand
- 5.4.1.9 Rest of Asia-Pacific
- 5.4.2 North America
- 5.4.2.1 United States
- 5.4.2.2 Canada
- 5.4.2.3 Mexico
- 5.4.3 Europe
- 5.4.3.1 Germany
- 5.4.3.2 France
- 5.4.3.3 United Kingdom
- 5.4.3.4 Italy
- 5.4.3.5 Spain
- 5.4.3.6 Russia
- 5.4.3.7 Turkey
- 5.4.3.8 Nordics
- 5.4.3.9 Rest of Europe
- 5.4.4 South America
- 5.4.4.1 Brazil
- 5.4.4.2 Argentina
- 5.4.4.3 Colombia
- 5.4.4.4 Rest of South America
- 5.4.5 Middle-East and Africa
- 5.4.5.1 Saudi Arabia
- 5.4.5.2 United Arab Emirates
- 5.4.5.3 Qatar
- 5.4.5.4 Egypt
- 5.4.5.5 South Africa
- 5.4.5.6 Nigeria
- 5.4.5.7 Rest of Middle-East and Africa
- 5.4.1 Asia-Pacific
6 Competitive Landscape
- 6.1 Market Concentration
- 6.2 Strategic Moves
- 6.3 Market Share(%)/Ranking Analysis
- 6.4 Company Profiles (includes Global Overview, Market Overview, Core Segments, Financials, Strategic Information, Products and Services, Recent Developments)
- 6.4.1 3B - the fibreglass company
- 6.4.2 AGY
- 6.4.3 ASAHI FIBER GLASS Co., Ltd
- 6.4.4 China Jushi Co., Ltd.
- 6.4.5 Chongqing International Composite Materials Co., Ltd.
- 6.4.6 Envalior
- 6.4.7 Gurit Services AG
- 6.4.8 Heraeus Holding
- 6.4.9 Johns Manville
- 6.4.10 Nippon Electric Glass Co., Ltd.
- 6.4.11 PFG FIBER GLASS CORPORATION
- 6.4.12 Praana Group
- 6.4.13 Saint-Gobain
- 6.4.14 Taishan Fiberglass Inc.(CTG)
- 6.4.15 Taiwan Glass Ind. Corp.
7 Market Opportunities and Future Outlook
- 7.1 White-space and Unmet-need Assessment