

|
시장보고서
상품코드
2122914
택배, 익스프레스 및 소포(CEP) : 시장 점유율 분석, 업계 동향 및 통계, 성장 예측(2026-2031년)Courier, Express, And Parcel (CEP) - Market Share Analysis, Industry Trends & Statistics, Growth Forecasts (2026 - 2031) |
||||||
 Mordor Intelligence
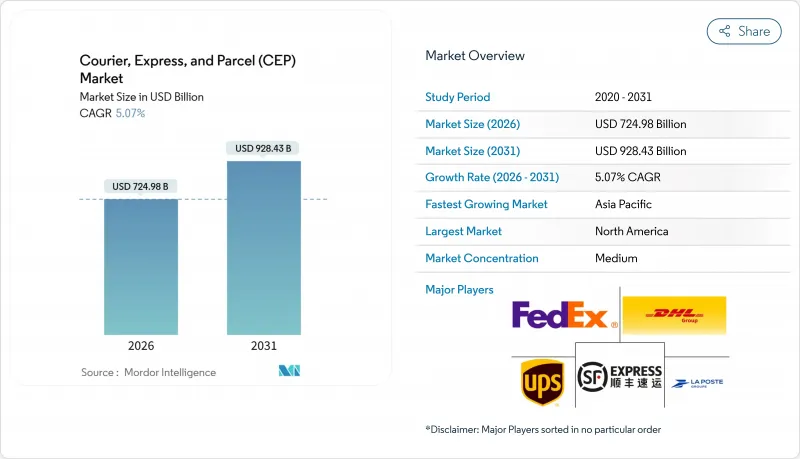
Mordor Intelligence에 의하면, 택배, 익스프레스 및 소포(CEP) 시장 규모는 2026년에 7,249억 8,000만 달러로 추정되고 예측 기간(2026-2031년) CAGR 5.07%로 성장을 지속하여, 2031년에는 9,284억 3,000만 달러에 이를 전망입니다.

본 보고서는 목적지(국내, 기타), 배송 속도(특급, 비특급), 모델(기업 대 소비자(B2C), 기타), 발송 중량(중량 발송, 기타), 운송 수단(항공, 도로, 기타), 최종 사용자 산업(전자상거래, 헬스케어, 기타), 지역(유럽 및 기타)별로 분류되어 있습니다. 시장 예측은 금액(달러) 기준으로 제시되어 있습니다.
세계의 택배, 익스프레스 및 소포(CEP) 시장 동향 및 인사이트
B2C 전자상거래 소포 처리량의 폭발적인 증가
2025년, 온라인 소매를 통한 소포 처리량은 전 세계적으로 1,310억 개에 달했으며, 2031년까지 1,780억 개에 이를 것으로 전망됩니다. 이는 인도, 인도네시아, 브라질에서 스마트폰 보급률이 상승함에 따라 소매 매출에서 전자상거래가 차지하는 비중이 52%인 중국과의 격차가 좁혀지고 있기 때문입니다. Temu나 Shein과 같은 플랫폼이 현지 유통망을 우회하여 공장에서 직접 상파울루나 라고스로 2주 이내에 주문 상품을 발송하고 있기 때문에 국경 간 물류의 성장세가 국내 성장률을 상회하고 있습니다. 이에 대응하기 위해 물류 통합 업체들은 메가 허브 대신 5,000제곱피트 이하의 도시형 마이크로 창고 클러스터를 도입했습니다. 이를 통해 2시간 이내 배송이 가능해졌고, 1제곱킬로미터당 소포 밀도가 향상되어 주요 수익원으로 자리 잡았습니다. 소셜 커머스도 물량 부담을 가중시키고 있으며, 2025년에는 TikTok Shop이 동남아시아에서 하루 300만 건의 주문을 처리하여, 이와 동일한 수의 경량 소포를 이러한 편중된 중량 분포에 익숙하지 않은 물류 네트워크로 보내고 있습니다.
당일 배송과 온디맨드 배송에 대한 기대
현재 전 세계 47개 도시의 소비자들은 온라인 주문의 38%를 결제 후 4시간 이내에 수령하고 있습니다. 이는 과거에는 따뜻한 식사나 긴급 처방약으로만 제한되었던 서비스입니다. UPS에 따르면, 2023년부터 2025년에 걸쳐 당일 배송 수요는 2배로 증가한 반면, 추가 요금을 지불하려는 의향은 31% 감소하여, 운송업체들은 자산 가동률을 유지하기 위해 특급 배송 물량과 지연이 허용되는 육로 배송을 병행할 수밖에 없게 되었습니다. 아마존 프라임(Amazon Prime)과 같은 구독 모델은 2억 1,000만 명의 회원에게 ‘다음 날 배송’을 표준으로 여기는 습관을 정착시켰으며, 지역 사업자의 고작 18%만이 보유한 실시간 교통 데이터를 활용해 2시간 단위의 배송 슬롯을 최적화하기 위해 운송업체들이 분주히 움직이는 가운데, 이익률을 압박하고 있습니다. 소매업체들은 고객 생애 가치(CLV)를 확보하기 위해 라스트 마일 배송 속도에 보조금을 투입하고 있으며, 그 비용 부담은 이미 인력 부족으로 어려움을 겪고 있는 택배 네트워크에 다시 전가되고 있습니다.
유류 가격 변동과 추가 요금 상승
2025년 브렌트유 가격은 배럴당 평균 84달러로 평가되었습니다. 2024년의 92달러라는 고점에서는 하락했으나, 운송업체들이 고점에서 헤지 거래를 진행했기 때문에 제트유 할증료는 기본 특송 요금의 11.5% 수준을 유지했습니다. 페덱스는 서차지로 인해 수익이 28억 달러 증가한 반면, 화주들이 서비스 수준을 낮춘 결과 취급량이 9% 감소했다고 밝혔습니다. 디젤 가격의 급등락으로 인해 매월 추가 요금을 재조정할 수밖에 없었고, 이는 화주들의 신뢰를 훼손하여 운송 수단의 전환이 ‘연기된 육상 운송’으로 이어지는 결과를 낳았습니다. 항공 네트워크는 여전히 위험에 노출되어 있으며, IATA에 따르면 연료비는 현재 영업 비용의 28%를 차지하고 있어 2020년의 22%에서 상승했습니다.
부문별 분석
전자상거래는 2025년 소포 운송량의 37.07%를 차지했으나, 온라인 보급률이 포화 상태에 가까워진 성숙한 지역에서는 현재 그 성장세가 둔화되고 있습니다. 대조적으로, 헬스케어 물류는 세포 및 유전자 치료 분야에서 -80°C의 정밀한 온도 관리가 요구됨에 따라 연평균 성장률(CAGR) 5.68%(2026-2031년)로 성장하며, 온도 관리가 필요한 화물 부문에서 택배, 익스프레스 및 소포 시장 점유율을 해마다 끌어올릴 것으로 보입니다. 페덱스는 이미 실시간 IoT 모니터링 기능을 갖춘 90곳의 콜드체인 시설을 운영하고 있으며, 40%의 가격 프리미엄을 확보하는 동시에 제품 손실 위험을 피하고자 하는 바이오의약품 기업 고객을 확보하고 있습니다.
제조업은 소포의 18%를 차지하며 견조하지만 완만한 성장세를 보이고 있는 반면, 디지털 서명이 종이 문서를 대체함에 따라 금융 및 보험·증권(BFSI) 부문은 축소 추세를 보이고 있습니다. 도매·소매 재고 보충은 연평균 성장률(CAGR) 3.2%로 확대되고 있으며, 매장이 주문 처리 거점으로도 기능하게 됨에 따라 소비자에게 직접 유통되는 채널과의 경계가 점점 모호해지고 있습니다. 1차 산업 및 정부 관련 운송량은 여전히 소량이지만 안정적인 틈새 시장을 형성하고 있습니다. 전반적으로 의료 및 헬스케어 부문은 고소득 시장에서 전자상거래 마켓플레이스의 성장 부진을 상쇄하는 성장 동력으로 부상하고 있습니다.
국제 배송은 2026년부터 2031년까지 연평균 성장률(CAGR) 5.36%로 확대될 전망이지만, 2025년 시점에서는 국내 배송이 수익의 68.98%를 차지했습니다. 데미니미스(소액 화물) 규제가 완화되어 통관 시간이 5일에서 36시간으로 단축됨에 따라, 국제 물류 분야의 택배, 익스프레스 및 소포 시장 규모는 확대될 것으로 예측됩니다. 중국 시장은 이미 연간 21억 개의 국경 간 소포를 주도하고 있으며, EU 역내의 효율성을 활용하기 위해 라이프치히나 리에주의 보세 허브를 경유하고 있습니다. 그러나 인도의 항구에서는 인프라 격차와 7일에 달하는 통관 대기 시간이 여전히 지속되고 있어, 항공 특송의 속도 면에서의 우위를 저해하고 있습니다. 택배 업체가 하루 180건을 배송하는 국내의 밀도 경제 덕분에 전 세계 쇼핑객을 대상으로 재고를 확대하고 있음에도 불구하고, 도시 지역 네트워크에서의 비용 리더십은 유지되고 있습니다.
국제 노선에서는 항공 운송, 통관 수수료, 제휴 우편 사업자에게 인계하는 데 드는 구조적 비용 프리미엄으로 소포 1개당 12-18달러가 부담되고 있지만, 규모의 경제와 통합 사업자의 보세 창고 투자로 인해 그 차이는 점차 줄어들고 있습니다. 아세안 전자상거래 협정(AEC)과 같은 지역 무역 협정은 서류 절차상의 마찰을 줄여, 아시아 지역 내 소포가 거의 국내 수준에 가까운 속도로 이동할 수 있도록 하고 있습니다. 현재 각 운송사는 엔드투엔드 가시화 및 관세 포함 결제와 같은 기능을 통해 국경 간 배송 서비스를 차별화하고 있으며, 이러한 기능은 Etsy나 Shopify를 이용하는 중소기업 판매자들의 재구매로 이어지고 있습니다. 세관 시스템의 디지털화가 진행됨에 따라 택배, 익스프레스 및 소포 시장에서는 그동안 불투명한 도착 비용 계산으로 인해 기피되던 경량 소포 수요가 더욱 확대되고 있습니다.
지역별 분석
북미는 2025년 매출의 36.37%를 차지했으며, 그 대부분은 90개 주요 대도시권에서 ‘당일 배송’을 당연시하는 1억 6,000만 명의 Amazon Prime 가입자 덕분입니다. 이 지역은 충실한 주소 데이터베이스와 성숙한 주간 트럭 운송의 혜택을 누리고 있지만, 2023년부터 2025년에 걸쳐 라스트 마일 인력 분야에서 18%의 임금 상승에 직면했습니다. 당일 배송은 현재 47개 도시로 확대되었으나, 고객이 추가 요금을 꺼리는 가운데 운송사들은 이익률 하락으로 어려움을 겪고 있습니다. 캐나다의 18억 개 소포와 미국과의 국경 간 거래가 급증하고 있는 멕시코가 북미 대륙 전체의 배송 밀도를 높이고 있습니다.
아시아태평양은 2025년 중국의 1,200억 개 국내 소포와 인도의 90억 개 배송에 힘입어 연평균 성장률(CAGR) 6.72%(2026-2031년)를 기록했으며, 다른 모든 지역을 능가하는 성장이 예상됩니다. 중국에서 87%, 인도에서 72%에 달하는 모바일 지갑 보급률로 인해 착불 배송에 따른 마찰이 완화되는 한편, 인도네시아, 베트남, 필리핀에서는 2025년에 총 60억 개의 소포가 배송되어 28%의 급증세를 기록했습니다. 일본과 호주의 노동력 부족을 배경으로, 야마토 운수의 임금 연동형 로봇 검사 운영부터 호주 우정공사의 교외 배송 로봇에 이르기까지 자율 배송 시범 사업이 추진되고 있습니다.
유럽은 2025년에 매출의 28%를 차지했으나, 전자상거래 보급률이 19% 수준에서 정체되고, 또한 ‘포장 폐기물 규제’에 따라 2030년까지 재활용 가능 소재의 90% 사용이 의무화됨에 따라 연평균 성장률(CAGR)은 4.1%에 그치며 성장세가 주춤하고 있습니다. 규제 준수 비용과 인건비 상승이 이익률을 압박하는 한편, 동유럽에서는 독일과 네덜란드에서의 국경 간 수출을 배경으로 소포 처리 건수가 두 자릿수 증가를 기록하고 있습니다. 중동 및 아프리카는 통관 지연이나 주소 불명확성으로 인해 제약을 받고 있지만, 걸프 국가에서는 항공 노선 연결성이 개선되어 매출의 7%를 차지하고 있습니다. 남미는 매출의 5%를 차지했으며, 브라질의 32억 개 소포가 성장의 견인차 역할을 하고 있지만, 환율 변동으로 인해 성장세가 둔화되고 있습니다.
기타 혜택
- 엑셀 형식 시장 예측(ME) 시트
- 3개월간 애널리스트 지원
자주 묻는 질문
목차
제1장 서론
제2장 조사 방법
제3장 주요 요약
제4장 시장 구도
제5장 시장 규모 및 성장 예측
제6장 경쟁 구도
제7장 시장 기회 및 향후 전망
KTH 26.09.08According to Mordor Intelligence, the courier, express, and parcel (CEP) market size is estimated at USD 724.98 billion in 2026, and is expected to reach USD 928.43 billion by 2031, at a CAGR of 5.07% during the forecast period (2026-2031).
This report is Segmented by Destination (Domestic and More), Speed of Delivery (Express and Non-Express), Model (Business-To-Consumer (B2C) and More), Shipment Weight (Heavy Weight Shipments and More), Mode of Transport (Air, Road, and Others), End User Industry (E-Commerce, Healthcare, and More), and Geography (Europe and More). The Market Forecasts are Provided in Terms of Value (USD).
Global Courier, Express, And Parcel (CEP) Market Trends and Insights
Explosive B2C E-Commerce Parcel Volumes
Online retail produced 131 billion parcels globally in 2025 and is tracking toward 178 billion by 2031 as rising smartphone penetration in India, Indonesia and Brazil closes the gap with China's 52% e-commerce share of retail sales. Cross-border flows outpace domestic growth because marketplaces such as Temu and Shein bypass local distribution, shipping factory-direct orders to Sao Paulo or Lagos in under two weeks. To cope, integrators have replaced megahubs with clusters of urban micro-warehouses under 5,000 square feet, enabling two-hour delivery windows that elevate parcel density per square kilometer as the primary profit lever. Social commerce compounds the load, with TikTok Shop processing 3 million daily orders in Southeast Asia during 2025 and sending an equivalent number of lightweight parcels into networks unaccustomed to such skewed weight profiles.
Same-Day and On-Demand Delivery Expectations
Consumers in 47 global cities now receive 38% of online orders within four hours of checkout, a service once limited to hot meals and urgent prescriptions. UPS noted same-day requests doubled between 2023 and 2025 even as willingness to pay premium fees fell 31%, forcing carriers to bundle expedited volume with deferred ground to preserve asset utilization. Subscription models like Amazon Prime train 210 million members to treat next-day as baseline, crowding margins as carriers scramble to optimize two-hour windows through real-time traffic data that just 18% of regional operators possess. Retailers subsidize last-mile speed to win customer lifetime value, shifting the cost burden back onto parcel networks already pressured by labor shortages.
Fuel-Price Volatility and Rising Surcharges
Brent averaged USD 84 per barrel in 2025, down from the USD 92 spike in 2024, yet jet-fuel surcharges lingered at 11.5% of base express rates after carriers hedged at higher prices. FedEx revealed surcharges lifted revenue by USD 2.8 billion but drove a 9% volume decline as shippers downgraded service levels. Diesel swings forced monthly surcharge resets, eroding shipper trust and pushing modal shifts toward deferred ground. Air networks remain exposed, with IATA noting fuel now represents 28% of operating costs, up from 22% in 2020.
Other drivers and restraints analyzed in the detailed report include:
- Liberalization of Cross-Border De Minimis Thresholds
- Automation and IoT Adoption in Sortation Hubs
- Acute Labor Shortages and Wage Inflation
For complete list of drivers and restraints, kindly check the Table Of Contents.
Segment Analysis
E-commerce commanded 37.07% of 2025 parcels but now decelerates in mature regions where online penetration nears saturation. Healthcare logistics, by contrast, will grow at a 5.68% CAGR (2026-2031) as cell-and-gene therapies demand precise -80 °C control, pushing the Courier, Express and Parcel market share of temperature-sensitive freight higher each year. FedEx already runs 90 cold-chain facilities with real-time IoT monitoring, securing 40% pricing premiums and capturing biopharma accounts unwilling to risk product loss.
Manufacturing accounts for 18% of parcels, steady but slow, while BFSI slips as digital signatures displace physical documents. Wholesale and retail inventory replenishment grows 3.2% CAGR, increasingly blurred with direct-to-consumer channels as stores double as fulfillment nodes. Primary industries and government shipments remain low-volume, stable niches. Overall, healthcare emerges as the growth engine that offsets plateauing e-commerce in high-income markets.
International shipments will expand at a 5.36% CAGR between 2026-2031, though domestic still anchors 68.98% of revenue in 2025. The Courier, Express and Parcel market size for international flows is projected to rise as de minimis liberalization trims clearance time from five days to 36 hours. Chinese marketplaces already drive 2.1 billion cross-border parcels a year, routing through bonded hubs in Leipzig and Liege to exploit intra-EU efficiencies. However, infrastructure gaps and seven-day customs queues persist at India's ports, tempering the speed advantage of express air. Domestic density economics, where a courier completes 180 daily stops, continue to yield cost leadership for urban networks even as global shoppers expand their addressable inventory.
International lanes shoulder USD 12-18 per parcel in structural cost premiums for air, brokerage, and partner-postal handoffs, but scale economies and bonded warehouse investment by integrators are closing the gap. Regional trade agreements such as ASEAN's e-commerce pact reduce documentary friction, enabling intra-Asia parcels to move with near-domestic velocity. Carriers now differentiate cross-border offers by end-to-end visibility and duty-paid checkout, features that win repeat small-business sellers on Etsy and Shopify. As customs systems digitalize, the Courier, Express and Parcel market unlocks an additional layer of lightweight parcels previously deterred by opaque landed-cost calculations.
Complete Report Scope:
- By Destination
- Domestic
- International
- By Speed of Delivery
- Express
- Non-Express
- By Model
- Business-to-Business (B2B)
- Business-to-Consumer (B2C)
- Consumer-to-Consumer (C2C)
- By Shipment Weight
- Heavy Weight Shipments
- Light Weight Shipments
- Medium Weight Shipments
- By Mode of Transport
- Air
- Road
- Others
- By End User Industry
- E-Commerce
- Financial Services (BFSI)
- Healthcare
- Manufacturing
- Primary Industry
- Wholesale and Retail Trade (Offline)
- Others
- By Region
- Asia-Pacific
- By Country
- Australia
- China
- India
- Indonesia
- Japan
- Malaysia
- Pakistan
- Philippines
- Thailand
- Vietnam
- Rest of Asia-Pacific
- By Country
- Europe
- By Country
- Albania
- Bulgaria
- Croatia
- Czech Republic
- Denmark
- Estonia
- Finland
- France
- Germany
- Hungary
- Iceland
- Italy
- Latvia
- Lithuania
- Netherlands
- Norway
- Poland
- Romania
- Russia
- Slovak Republic
- Slovenia
- Spain
- Sweden
- Switzerland
- United Kingdom
- Rest of Europe
- By Country
- Middle East and Africa
- By Country
- Egypt
- Nigeria
- Qatar
- Saudi Arabia
- South Africa
- GCC
- UAE
- Rest of Middle East and Africa
- By Country
- North America
- By Country
- Canada
- Mexico
- United States
- Rest of North America
- By Country
- South America
- By Country
- Argentina
- Brazil
- Chile
- Rest of South America
- By Country
- Rest of World
- Asia-Pacific
Geography Analysis
North America contributed 36.37% of 2025 revenue, largely from 160 million Amazon Prime subscribers who normalize same-day expectations across 90 metros. The region benefits from deep address databases and mature inter-state trucking, yet faces 18% wage inflation in last-mile labor between 2023 and 2025. Same-day now reaches 47 cities, but carriers battle margin erosion as customers recoil from surcharges. Canada's 1.8 billion parcels and Mexico's cross-border boom with the United States reinforce continental density.
Asia-Pacific will outpace all regions with a 6.72% CAGR (2026-2031), propelled by China's 120 billion domestic parcels and India's 9 billion shipments in 2025. Mobile-wallet penetration of 87% in China and 72% in India erodes cash-on-delivery friction, while Indonesia, Vietnam, and the Philippines collectively delivered 6 billion parcels in 2025, a 28% jump. Labor scarcity in Japan and Australia drives autonomous-delivery pilots, from Yamato's wage-linked robot trials to Australia Post's suburban rovers.
Europe generated 28% of revenue in 2025 but grows more slowly at a 4.1% CAGR as e-commerce penetration plateaus near 19% and the Packaging Waste Regulation mandates 90% recyclable materials by 2030. Compliance costs and rising labor rates trim margins, while Eastern Europe posts double-digit parcel growth on back of German and Dutch cross-border exports. Middle East and Africa deliver 7% of revenue, constrained by customs delays and address ambiguity, though Gulf states improve air-lane connectivity. South America adds 5% of revenue, with Brazil's 3.2 billion parcels leading but dampened by currency volatility.
- All Cargo Logistics
- Aramex
- Australia Post
- Blue Dart Express, Ltd.
- Cainiao Network Technology Co., Ltd.
- Canada Post (including Purolator, Inc.)
- CJ Logistics Corporation
- Correios de Portugal S.A. (CTT)
- DHL Express
- DSV A/S
- FedEx
- International Distribution Services plc
- Japan Post Holdings Co., Ltd.
- JD Logistics, Inc.
- Korea Post
- La Poste Group (GeoPost / DPDgroup)
- Osterreichische Post AG
- Otto Group
- Pos Indonesia
- Poste Italiane
- Posten Norge AS (Bring)
- PostNL
- Seino Holdings Co., Ltd.
- SF Holdings (SF Express)
- Singapore Post, Ltd.
- TFI International, Inc.
- United Parcel Service of America, Inc. (UPS)
- Yamato Holdings Co., Ltd.
- ZTO Express (Cayman) Inc.
Additional Benefits:
- The market estimate (ME) sheet in Excel format
- 3 months of analyst support
TABLE OF CONTENTS
1 Introduction
- 1.1 Study Assumptions and Market Definition
- 1.2 Scope of the Study
2 Research Methodology
3 Executive Summary
4 Market Landscape
- 4.1 Market Overview
- 4.2 Demographics
- 4.3 GDP Distribution by Economic Activity
- 4.4 GDP Growth by Economic Activity
- 4.5 Inflation
- 4.6 Economic Performance and Profile
- 4.6.1 Trends in E-Commerce Industry
- 4.6.2 Trends in Manufacturing Industry
- 4.7 Transport and Storage Sector GDP
- 4.8 Export Trends
- 4.9 Import Trends
- 4.10 Fuel Price
- 4.11 Logistics Performance
- 4.12 Infrastructure
- 4.13 Regulatory Framework
- 4.14 Value Chain and Distribution Channel Analysis
- 4.15 Market Drivers
- 4.15.1 Explosive B2C E-Commerce Parcel Volumes
- 4.15.2 Same-Day and On-Demand Delivery Expectations
- 4.15.3 Liberalization of Cross-Border Trade and De-Minimis Thresholds
- 4.15.4 Automation and IoT Adoption in Sortation Hubs
- 4.15.5 Crowd-Shipping and Gig-Economy Delivery Networks
- 4.15.6 Urban Consolidation-Center Mandates by City Councils
- 4.16 Market Restraints
- 4.16.1 Fuel-Price Volatility and Rising Surcharges
- 4.16.2 Acute Labor Shortages and Wage Inflation in Last-Mile
- 4.16.3 Regulatory Delays on Commercial UAV/Drone Delivery
- 4.16.4 Zoning Limits on Micro-Fulfillment Centres Near City Cores
- 4.17 Technology Innovations in the Market
- 4.18 Porter's Five Forces Analysis
- 4.18.1 Threat of New Entrants
- 4.18.2 Bargaining Power of Buyers
- 4.18.3 Bargaining Power of Suppliers
- 4.18.4 Threat of Substitutes
- 4.18.5 Competitive Rivalry
5 Market Size and Growth Forecasts (Value, USD)
- 5.1 By Destination
- 5.1.1 Domestic
- 5.1.2 International
- 5.2 By Speed of Delivery
- 5.2.1 Express
- 5.2.2 Non-Express
- 5.3 By Model
- 5.3.1 Business-to-Business (B2B)
- 5.3.2 Business-to-Consumer (B2C)
- 5.3.3 Consumer-to-Consumer (C2C)
- 5.4 By Shipment Weight
- 5.4.1 Heavy Weight Shipments
- 5.4.2 Light Weight Shipments
- 5.4.3 Medium Weight Shipments
- 5.5 By Mode of Transport
- 5.5.1 Air
- 5.5.2 Road
- 5.5.3 Others
- 5.6 By End User Industry
- 5.6.1 E-Commerce
- 5.6.2 Financial Services (BFSI)
- 5.6.3 Healthcare
- 5.6.4 Manufacturing
- 5.6.5 Primary Industry
- 5.6.6 Wholesale and Retail Trade (Offline)
- 5.6.7 Others
- 5.7 By Region
- 5.7.1 Asia-Pacific
- 5.7.1.1 By Country
- 5.7.1.1.1 Australia
- 5.7.1.1.2 China
- 5.7.1.1.3 India
- 5.7.1.1.4 Indonesia
- 5.7.1.1.5 Japan
- 5.7.1.1.6 Malaysia
- 5.7.1.1.7 Pakistan
- 5.7.1.1.8 Philippines
- 5.7.1.1.9 Thailand
- 5.7.1.1.10 Vietnam
- 5.7.1.1.11 Rest of Asia-Pacific
- 5.7.1.1 By Country
- 5.7.2 Europe
- 5.7.2.1 By Country
- 5.7.2.1.1 Albania
- 5.7.2.1.2 Bulgaria
- 5.7.2.1.3 Croatia
- 5.7.2.1.4 Czech Republic
- 5.7.2.1.5 Denmark
- 5.7.2.1.6 Estonia
- 5.7.2.1.7 Finland
- 5.7.2.1.8 France
- 5.7.2.1.9 Germany
- 5.7.2.1.10 Hungary
- 5.7.2.1.11 Iceland
- 5.7.2.1.12 Italy
- 5.7.2.1.13 Latvia
- 5.7.2.1.14 Lithuania
- 5.7.2.1.15 Netherlands
- 5.7.2.1.16 Norway
- 5.7.2.1.17 Poland
- 5.7.2.1.18 Romania
- 5.7.2.1.19 Russia
- 5.7.2.1.20 Slovak Republic
- 5.7.2.1.21 Slovenia
- 5.7.2.1.22 Spain
- 5.7.2.1.23 Sweden
- 5.7.2.1.24 Switzerland
- 5.7.2.1.25 United Kingdom
- 5.7.2.1.26 Rest of Europe
- 5.7.2.1 By Country
- 5.7.3 Middle East and Africa
- 5.7.3.1 By Country
- 5.7.3.1.1 Egypt
- 5.7.3.1.2 Nigeria
- 5.7.3.1.3 Qatar
- 5.7.3.1.4 Saudi Arabia
- 5.7.3.1.5 South Africa
- 5.7.3.1.6 GCC
- 5.7.3.1.7 UAE
- 5.7.3.1.8 Rest of Middle East and Africa
- 5.7.3.1 By Country
- 5.7.4 North America
- 5.7.4.1 By Country
- 5.7.4.1.1 Canada
- 5.7.4.1.2 Mexico
- 5.7.4.1.3 United States
- 5.7.4.1.4 Rest of North America
- 5.7.4.1 By Country
- 5.7.5 South America
- 5.7.5.1 By Country
- 5.7.5.1.1 Argentina
- 5.7.5.1.2 Brazil
- 5.7.5.1.3 Chile
- 5.7.5.1.4 Rest of South America
- 5.7.5.1 By Country
- 5.7.6 Rest of World
- 5.7.1 Asia-Pacific
6 Competitive Landscape
- 6.1 Market Concentration
- 6.2 Key Strategic Moves
- 6.3 Market Share Analysis
- 6.4 Company Profiles (Includes Global Level Overview, Market Level Overview, Core Segments, Financials as Available, Strategic Information, Market Rank/Share for Key Companies, Products and Services, and Recent Developments)
- 6.4.1 All Cargo Logistics
- 6.4.2 Aramex
- 6.4.3 Australia Post
- 6.4.4 Blue Dart Express, Ltd.
- 6.4.5 Cainiao Network Technology Co., Ltd.
- 6.4.6 Canada Post (including Purolator, Inc.)
- 6.4.7 CJ Logistics Corporation
- 6.4.8 Correios de Portugal S.A. (CTT)
- 6.4.9 DHL Express
- 6.4.10 DSV A/S
- 6.4.11 FedEx
- 6.4.12 International Distribution Services plc
- 6.4.13 Japan Post Holdings Co., Ltd.
- 6.4.14 JD Logistics, Inc.
- 6.4.15 Korea Post
- 6.4.16 La Poste Group (GeoPost / DPDgroup)
- 6.4.17 Osterreichische Post AG
- 6.4.18 Otto Group
- 6.4.19 Pos Indonesia
- 6.4.20 Poste Italiane
- 6.4.21 Posten Norge AS (Bring)
- 6.4.22 PostNL
- 6.4.23 Seino Holdings Co., Ltd.
- 6.4.24 SF Holdings (SF Express)
- 6.4.25 Singapore Post, Ltd.
- 6.4.26 TFI International, Inc.
- 6.4.27 United Parcel Service of America, Inc. (UPS)
- 6.4.28 Yamato Holdings Co., Ltd.
- 6.4.29 ZTO Express (Cayman) Inc.
7 Market Opportunities and Future Outlook
- 7.1 White-Space and Unmet-Need Assessment


