
|
시장보고서
상품코드
2122940
핀테크 시장 : 시장 점유율 분석, 업계 동향 및 통계, 성장 예측(2025-2030년)Fintech - Market Share Analysis, Industry Trends & Statistics, Growth Forecasts (2025 - 2030) |
||||||
 Mordor Intelligence
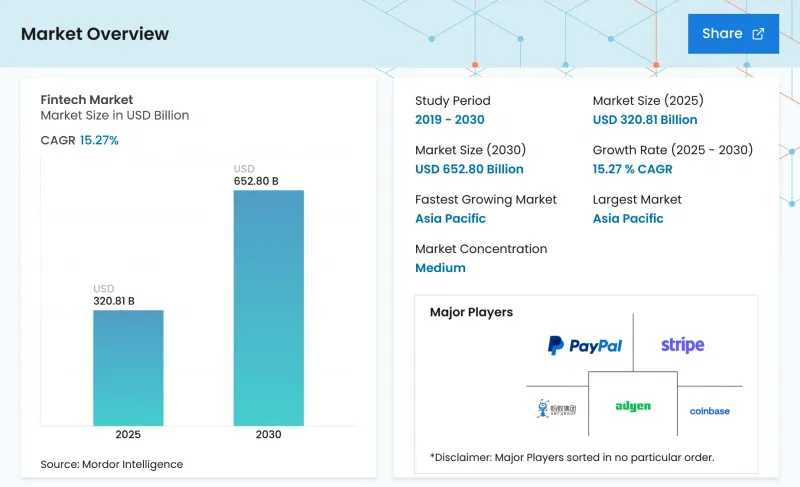
Mordor Intelligence에 의하면, 핀테크 시장 규모는 2025년에 2,783억 1,000만 달러로 평가되었고, 2025년 3,208억 1,000만 달러에서 2030년까지 6,528억 달러에 이를 것으로 예측되며, 예측 기간(2025-2030년) CAGR은 15.27%를 나타낼 전망입니다.
본 보고서는 서비스 유형별(디지털 결제, 디지털 대출·자금 조달, 디지털 투자, 인슈어테크, 네오뱅킹), 최종 사용자별(개인 및 기업), 사용자 인터페이스별(모바일 애플리케이션, 웹/브라우저, POS/IoT 기기), 지역별(북미, 남미, 유럽, 아시아태평양, 중동 및 아프리카)로 분류되어 있습니다. 시장 예측은 금액(달러) 기준으로 제시되어 있습니다.
세계의 핀테크 시장 동향 및 인사이트
실시간 결제 의무화가 핀테크 도입을 가속화하고 있습니다.
미국의 ‘FedNow’나 유럽의 ‘SEPA 인스턴트 크레딧 이체’와 같은 중앙은행 시스템을 통해 결제에 소요되는 시간이 몇 시간에서 몇 초로 극적으로 단축되고 있습니다. 결제 처리의 고속화는 자금 관리, 소액 대출, 현금 흐름 분석 분야에서 새로운 가치 제안을 뒷받침하고 있으며, 과거에는 처리 속도가 느린 일괄 처리에 의존하던 기업 고객층까지 핀테크 시장이 도달할 수 있게 되었습니다. 2025년에는 미국의 실시간 거래 건수가 74억 건에 달할 것으로 예상되며, 중국, 영국, 홍콩에서도 유사한 추세가 나타나고 있습니다. ‘Request to Pay’, 자동 대조, 저스트-인-타임 파이낸스(Just-in-Time Finance)와 같은 오버레이 서비스를 통합하는 제공업체들은 동일한 결제 인프라를 기반으로 안정성이 높은 수익원을 확보하고 있습니다. 규제 당국이 명확한 전환 기한을 설정하고 결제 확정 관련 규정을 개정하고 있는 지역에서는 도입이 가장 빠르게 진행되고 있습니다. 결제 네트워크 간의 상호 운용성은 여전히 해결해야 할 과제이지만, 국내 고속 결제 시스템을 연계하는 시범 사업은 이미 실행 가능한 국경 간 모델을 보여주고 있습니다.
오픈 뱅킹과 API 표준화를 통한 데이터 접근성 확대
유럽의 PSD2와 브라질의 오픈 파이낸스 제도는 통일된 API 사양을 통해 계좌 통합, 잔액 조회, 은행을 통한 직접 결제를 대규모로 실현할 수 있음을 입증하고 있습니다. 표준화된 동의 절차를 통해 경쟁의 초점은 데이터 축적에서 데이터 활용으로 이동하고 있으며, 예측 기반 신용 심사 및 고도로 개인화된 예산 관리 도구의 개발이 촉진되고 있습니다. 규제 당국은 현재 오픈 파이낸스를 중요한 디지털 인프라로 간주하고 있으며, 이는 북미·남미 및 아시아태평양 일부에서 도입을 촉진하고 있습니다. 은행에서 얻는 데이터와 가맹점, 통신사, 혹은 소셜 미디어에서 얻는 신호를 결합하는 핀테크 플랫폼은 보다 정교한 리스크 모델을 구축하여 부도율을 낮추고 신용 접근성을 확대되고 있습니다. 이러한 추세는 상호 운용 가능한 핀테크 시장 생태계를 조성하고 있으며, 이 생태계에서 소규모 제공업체들은 제3자 분석을 활용하여 고객 기반의 규모가 아닌 서비스의 질 측면에서 기존 기업들과 경쟁할 수 있게 되었습니다.
BNPL 모델에 대한 규제 당국의 규제 강화
영국, 미국, 호주의 소비자 보호 기관은 BNPL 상품을 신용 상품으로 분류하고, 상환 능력 심사, 표준화된 정보 공개, 그리고 경제적 어려움 발생 시의 대응 절차를 의무화하는 규정을 마련 중입니다. 서비스 제공업체는 소프트 풀 방식의 신용정보기관과의 연계, 분쟁 해결 워크플로우 강화, 연체 수수료 의존에서 벗어난 수익 모델 조정이 요구됩니다. 규정 준수 비용 증가로 인해 업계 재편, 이미 대출 면허를 보유한 규제 대상 대출 기관과의 제휴가 진행될 것입니다. 소매업체의 경우, 단기적으로는 BNPL 결제 도입 속도가 둔화될 가능성이 있지만, 투명성이 높은 이용 조건을 통해 장기적으로는 대상 고객층을 확대할 수 있을 것입니다. 규제 요건을 충족하는 데이터 필드와 상환 분석 기능을 선제적으로 도입한 핀테크 기업은 통일된 프레임워크가 확립될 때 견고한 경쟁 우위를 확보할 수 있을 것입니다.
부문 분석
네오뱅크는 핀테크 시장 규모에서 차지하는 비중이 미미하지만, 2030년까지의 연평균 성장률(CAGR)은 18.7%로 가장 높아, 지점 중심의 은행 업무에서 앱 중심의 은행 업무로의 결정적인 전환을 보여주고 있습니다. 신속한 기능 확충, 투명한 가격 책정, 개인화된 인사이트를 통해 네오뱅크는 젊은 층의 ‘모바일 퍼스트’ 소비자를 확보하고 있습니다. 기존 금융 기관들은 디지털 자회사 설립 및 핵심 뱅킹 시스템 현대화를 가속화하여 대응하고 있으며, 사용자 경험 격차는 줄어들고 있지만 기술 예산은 증가하고 있습니다. 디지털 결제 솔루션은 2024년 핀테크 시장 점유율의 46.2%를 차지했으며, 고객 유치를 위한 중요한 진입점으로 자리 잡고 있습니다. 각 제공업체는 결제 인프라에 부정 분석, 로열티 프로그램 통합, 운전자금 대출을 접목하여, 낮은 마진의 결제 처리를 고객 생애 가치(CLV)를 향상시키는 번들형 가치 제안으로 전환하고 있습니다.
지갑이나 카드에 그치지 않고, 인슈어테크, 웰스테크, 레그테크는 데이터 사이언스과 자동화를 통해 기존 프로세스를 혁신할 수 있는 전문 분야를 개척하고 있습니다. 이용량에 따른 보험이나 AI를 활용한 보험금 청구 우선순위 지정을 통해 보험사의 손해율은 낮아지고 있으며, 보험사와 클라우드 벤더 간의 합작 사업이 활발해지고 있습니다. 자산 운용 분야에서는 분할 소유권과 자동 리밸런싱이 투자를 민주화하는 한편, 컴플라이언스 자동화 도구는 새로운 보고 의무를 수익화하고 있습니다. 단일 사용자 경험 내에서 여러 서비스 제안을 통합하는 능력야말로 미래의 승자를 결정짓는 요소이며, 핀테크 플랫폼은 사용자가 결제, 신용, 저축, 보장 사이를 자유롭게 전환할 수 있는 모듈형 아키텍처로 전환되고 있습니다.
지역별 분석
아시아태평양은 2024년 핀테크 시장의 44.86%를 차지한 것으로 평가되었으며, 2030년까지 연평균 성장률(CAGR) 16.02%로 성장할 전망입니다. 중국의 슈퍼앱 생태계와 인도의 UPI 인프라가 이 지역의 성장을 뒷받침하고 있으며, 진입 장벽을 낮추는 동남아시아의 디지털 은행 라이선스 프로그램도 이에 힘을 보태고 있습니다. 각국 정부는 핀테크를 경제적 포용의 수단으로 간주하며, e-KYC(전자 본인 확인) 기준의 합리화와 샌드박스 육성을 추진하고 있습니다. 이 지역의 기존 기업들은 스타트업에 자본을 투입하는 전략적 벤처 부문을 출범시켜, 파괴적 혁신의 위험을 헤지하면서 새로운 역량을 활용하고 있습니다.
북미는 사용자 보급률이 성숙 단계에 있음에도 불구하고 여전히 혁신의 중심지로 자리 잡고 있습니다. AI를 활용한 개인화, 암호화폐 서비스, 클라우드 네이티브 핵심 뱅킹이 서비스 차별화 요인으로 작용하고 있으며, 규제 당국은 스테이블코인과 디지털 자산의 보관에 대해 보다 명확한 지침을 제시하고 있습니다. 벤처 자금은 안전한 데이터 교환 프로토콜을 보유한 기업에 집중되고 있으며, 이는 주목을 받은 사이버 사고에서 얻은 교훈을 반영한 것입니다. 이 지역의 핀테크 시장은 검증된 수익 유지율과 교차 판매 지표를 평가하는 깊이 있는 자본 시장으로부터 계속해서 혜택을 받고 있습니다.
유럽의 규제 측면에서의 리더십이 이 지역의 핀테크 진로를 형성하고 있습니다. PSD2는 오픈 뱅킹 플랫폼을 촉진하고, MiCA는 암호화폐 발행에 명확성을 부여하며, DORA는 엄격한 업무 복원력 규정을 정하고 있습니다. 이러한 프레임워크는 전문적인 레그테크(RegTech) 벤더와 컴플라이언스-어즈-어-서비스(CaaS) 제품을 탄생시켜 새로운 수익원을 창출하고 있습니다. 유럽 대륙의 네오뱅크는 다중 통화 체제 하에서 서비스를 현지화하면서, 라이선스 패스포트 제도를 활용해 사업 규모를 확대되고 있습니다. 또한, 그린 파이낸스의 필요성으로 인해 거래 수준에서 스코프 3 배출량을 측정하는 기후 데이터 핀테크 플랫폼이 활성화되고 있습니다.
남미에서는 브라질의 즉시 결제 네트워크 ‘PIX’를 중심으로 이용이 급속히 확대되고 있습니다. 은행 계좌를 보유하지 않은 대규모 인구층과 ‘모바일 퍼스트’ 행동 양식이 지갑 제공업체, 디지털 대출업체, 그리고 소액 보험 제도에 있어 비옥한 토양이 되고 있습니다. 샌드박스 시험에 대한 규제 당국의 개방적인 태도가 국제 자본을 유치하고 있으며, 국내 유력 기업들은 저비용 송금 서비스와 공공요금 납부 내역을 기반으로 한 신용 점수 산정 서비스를 제공함으로써 지역 차원의 사업 확대를 도모하고 있습니다. 인프라가 성숙해짐에 따라 이 지역은 인재와 제품 프레임워크를 다른 신흥 시장으로 수출하고 있습니다.
중동 및 아프리카에서는 다양한 비즈니스 기회가 나타나고 있습니다. 걸프협력회의(GCC) 회원국들은 디지털 은행 라이선스를 발급하고, 정부 지원 핀테크 액셀러레이터를 운영하며, AI 중심의 금융 벤처 기업에 정부 계열 펀드를 투자하고 있습니다. 아프리카의 모바일 머니 네트워크는 거래량 측면에서 여전히 세계를 선도하고 있으며, 송금 경로는 해외 디아스포라를 위한 지갑과 연동되어 있습니다. 이 지역의 핀테크 주요 테마로는 샤리아(Sharia) 준거 임베디드 금융, 저수수료 국제 송금, 위성 농업 데이터를 활용한 농업 자재 대출 등이 있습니다.
기타 혜택 :
- 엑셀 형식 시장 예측(ME) 시트
- 3개월간 애널리스트 지원
자주 묻는 질문
목차
제1장 서론
제2장 조사 방법
제3장 주요 요약
제4장 시장 구도
제5장 시장 규모 및 성장 예측
제6장 경쟁 구도
제7장 시장 기회 및 향후 전망
AJY 26.09.07According to Mordor Intelligence, the fintech market size was valued at USD 278.31 billion in 2025 and is estimated to grow from USD 320.81 billion in 2025 to reach USD 652.80 billion by 2030, at a CAGR of 15.27% during the forecast period (2025-2030).
This report is Segmented by Service Proposition (Digital Payments, Digital Lending and Financing, Digital Investments, Insurtech, and Neobanking), by End-User (Retail and Businesses), by User Interface (Mobile Applications, Web / Browser, and POS / IoT Devices), and by Region (North America, South America, Europe, Asia-Pacific, & Middle East and Africa). The Market Forecasts are Provided in Terms of Value (USD).
Global Fintech Market Trends and Insights
Real-time payments mandates accelerating fintech adoption
Central-bank systems such as FedNow in the United States and SEPA Instant Credit Transfer in Europe are transforming settlement expectations from hours to seconds. Faster clearing underpins new value propositions in treasury management, micro-lending, and cash-flow analytics, helping the fintech market reach enterprise customers that once relied on slower batch processes. In 2025, U.S. real-time transactions are expected to hit 7.4 billion, and similar momentum is visible in China, the United Kingdom, and Hong Kong. Providers that integrate overlay services - request to pay, automated reconciliation, and just-in-time financing - gain sticky revenue streams grounded in the same rails. Adoption is most rapid where regulators set explicit migration deadlines and update settlement finality rules. Payment-network interoperability remains the next hurdle, but pilots linking domestic faster-payment systems already demonstrate viable cross-border models.
Open-banking & API standardization broadening data access
PSD2 in Europe and Brazil's Open Finance regime prove that uniform API specifications can unlock account aggregation, balance verification, and direct-from-bank payments at scale. Standardized consent flows shift competition away from data hoarding toward data utilization, encouraging predictive underwriting and hyper-personalized budgeting tools. Regulators now treat open finance as critical digital infrastructure, prompting adoption across the Americas and parts of Asia-Pacific. Fintech platforms that pair bank-sourced data with merchant, telecom, or social signals create richer risk models, lowering default rates and broadening credit access. The pattern is fostering interoperable fintech market ecosystems where smaller providers tap third-party analytics to compete against incumbents on service quality rather than raw customer reach.
Regulatory clamp-down on BNPL models
Consumer-protection agencies in the United Kingdom, the United States, and Australia are drafting rules that classify BNPL products as credit, mandating affordability checks, standardized disclosures, and hardship protocols. Providers must integrate soft-pull credit bureaus, upgrade dispute-resolution workflows, and adjust revenue models away from late-fee dependency. Compliance costs rise, encouraging consolidation and alliances with regulated lenders that already hold lending licenses. Retailers may experience slower BNPL checkout adoption in the near term, but transparent terms could expand the addressable base over time. Fintech firms that pre-emptively embed regulation-ready data fields and repayment analytics create defensible positions once uniform frameworks crystallize.
Other drivers and restraints analyzed in the detailed report include:
- CBDC pilots in China & India driving infrastructure upgrades
- Rise of embedded finance among Asian e-commerce platforms
- Sophisticated fraud & deepfake-based identity risks
For complete list of drivers and restraints, kindly check the Table Of Contents.
Segment Analysis
Neobanking accounts for a modest slice of the fintech market size yet posts the fastest 18.7% CAGR to 2030, signaling a decisive shift from branch-centric to app-centric banking. Feature velocity, transparent pricing, and personalized insights allow neobanks to capture young, mobile-first consumers. Established lenders react with digital subsidiaries and accelerated core-bank modernization, narrowing the experiential gap but raising technology budgets. Digital-payments solutions hold 46.2% of the fintech market share in 2024 and remain vital gateways for customer acquisition. Providers layer fraud-analytics, loyalty integrations, and working-capital loans onto payment rails, turning low-margin processing into bundled value propositions that lift customer lifetime revenue.
Expanding beyond wallets and cards, insurtech, wealth-tech, and reg-tech carve specialized lanes where data science and automation can upend legacy processes. Usage-based insurance and AI-driven claims triage cut carrier loss ratios, attracting joint ventures between insurers and cloud vendors. In wealth management, fractional ownership and automated rebalancing democratize investing, while compliance-automation tools monetize new reporting mandates. The ability to orchestrate multiple service propositions within a single experience defines future winners, pushing fintech platforms toward modular architectures that let users toggle between payments, credit, savings, and protection.
Complete Report Scope:
- By Service Proposition
- Digital Payments
- Digital Lending and Financing
- Digital Investments
- Insurtech
- Neobanking
- By End-User
- Retail
- Businesses
- By User Interface
- Mobile Applications
- Web / Browser
- POS / IoT Devices
- By Region
- North America
- United States
- Canada
- Mexico
- South America
- Brazil
- Argentina
- Chile
- Colombia
- Rest of South America
- Europe
- United Kingdom
- Germany
- France
- Spain
- Italy
- Benelux (Belgium, Netherlands, and Luxembourg)
- Nordics (Sweden, Norway, Denmark, Finland, and Iceland)
- Rest of Europe
- Asia-Pacific
- China
- India
- Japan
- South Korea
- Australia
- South-East Asia (Singapore, Indonesia, Malaysia, Thailand, Vietnam, and Philippines)
- Rest of Asia-Pacific
- Middle East and Africa
- United Arab Emirates
- Saudi Arabia
- South Africa
- Nigeria
- Rest of Middle East and Africa
- North America
Geography Analysis
Asia-Pacific commanded 44.86% of the fintech market in 2024 and is on track for a 16.02% CAGR through 2030. China's super-app ecosystem and India's UPI rails anchor regional growth, joined by Southeast Asian digital-bank license programs that lower entry barriers. Governments treat fintech as a lever for economic inclusion, streamlining e-KYC norms and nurturing sandboxes. Regional incumbents respond with strategic venture arms that inject capital into start-ups, hedging disruption risk while tapping novel capabilities.
North America remains an innovative powerhouse despite maturing user penetration. AI-driven personalization, crypto-asset services, and cloud-native core banking differentiate offerings as regulators provide clearer guidance on stablecoins and digital-asset custody. Venture funding gravitates toward firms with secure data-exchange protocols, reflecting lessons from high-profile cyber incidents. The fintech market in the region continues to benefit from deep capital markets that reward proven revenue retention and cross-selling metrics.
Europe's regulatory leadership shapes its fintech trajectory. PSD2 catalyzed open-banking platforms, MiCA brings clarity to crypto-asset issuance, and DORA sets stringent operational-resilience rules. These frameworks spawn specialized reg-tech vendors and compliance-as-a-service products, adding new revenue layers. Continental neobanks localize services across multi-currency regimes while passporting licenses to scale. Additionally, green-finance imperatives stimulate climate-data fintech platforms that measure scope-3 emissions at the transaction level.
South America showcases rising adoption curves anchored by Brazil's PIX instant-payment network. Large unbanked populations and mobile-first behavior create fertile ground for wallet providers, digital lenders, and micro-insurance schemes. Regulatory openness to sandbox testing attracts international capital, and domestic champions scale regionally by offering low-cost remittances and credit scoring tied to utility-bill histories. As the infrastructure matures, the region exports talent and product frameworks to other emerging markets.
Middle East and Africa present heterogeneous opportunity sets. Gulf Cooperation Council states issue digital-bank licenses, host government-backed fintech accelerators, and invest sovereign wealth in AI-centric finance ventures. Africa's mobile-money rails remain world-leading in transaction volume, and remittance corridors integrate with diaspora wallets abroad. Regional fintech themes include Sharia-compliant embedded finance, low-fee cross-border transfers, and agricultural-input lending facilitated via satellite agronomy data.
List of Companies Covered in this Report:
- PayPal Holdings Inc.
- Ant Group Co. Ltd.
- Stripe Inc.
- Block Inc. (Square, Cash App)
- Adyen N.V.
- Coinbase Global Inc.
- Robinhood Markets Inc.
- Revolut Ltd.
- Klarna Bank AB
- N26 GmbH
- SoFi Technologies Inc.
- Nubank (Nu Holdings)
- Wise plc
- Juspay
- FIS Global
- Fiserv Inc.
- Intuit Inc.
- M-PESA (Vodafone / Safaricom)
- Paytm Digital Payments Ltd.
- Razorpay Software Pvt Ltd.
Additional Benefits:
- The market estimate (ME) sheet in Excel format
- 3 months of analyst support
TABLE OF CONTENTS
1 Introduction
- 1.1 Study Assumptions & Market Definition
- 1.2 Scope of the Study
2 Research Methodology
3 Executive Summary
4 Market Landscape
- 4.1 Market Overview
- 4.2 Market Drivers
- 4.2.1 Real-time Payments Mandates (FedNow, SEPA Instant Credit Transfer) Accelerating Fintech Adoption
- 4.2.2 Open-Banking & API Standardization (PSD2, Brazil Open Finance) Broadening Data Access
- 4.2.3 CBDC Pilots in China & India Driving Fintech Infrastructure Upgrades
- 4.2.4 Rise of Embedded-Finance Among Asian E-commerce Platforms
- 4.2.5 SME Credit Gap in MENA & South America Fueling Digital Lending Platforms
- 4.2.6 ESG-Linked Fintech Solutions Attracting Green-Investment Funds in Europe
- 4.3 Market Restraints
- 4.3.1 Regulatory Clamp-down on BNPL Models
- 4.3.2 Sophisticated Fraud & Deepfake?based Identity Risks
- 4.3.3 Cloud-Concentration Risk Creating Single Points-of-Failure
- 4.3.4 Funding Winter & Valuation Corrections Curbing Scale-ups
- 4.4 Value / Supply-Chain Analysis
- 4.5 Regulatory Outlook
- 4.6 Technological Outlook
- 4.7 Porter's Five Forces
- 4.7.1 Threat of New Entrants
- 4.7.2 Bargaining Power of Buyers/Consumers
- 4.7.3 Bargaining Power of Suppliers
- 4.7.4 Threat of Substitutes
- 4.7.5 Intensity of Competitive Rivalry
- 4.8 Investment & Funding Trend Analysis
5 Market Size & Growth Forecasts (Value)
- 5.1 By Service Proposition
- 5.1.1 Digital Payments
- 5.1.2 Digital Lending and Financing
- 5.1.3 Digital Investments
- 5.1.4 Insurtech
- 5.1.5 Neobanking
- 5.2 By End-User
- 5.2.1 Retail
- 5.2.2 Businesses
- 5.3 By User Interface
- 5.3.1 Mobile Applications
- 5.3.2 Web / Browser
- 5.3.3 POS / IoT Devices
- 5.4 By Region
- 5.4.1 North America
- 5.4.1.1 United States
- 5.4.1.2 Canada
- 5.4.1.3 Mexico
- 5.4.2 South America
- 5.4.2.1 Brazil
- 5.4.2.2 Argentina
- 5.4.2.3 Chile
- 5.4.2.4 Colombia
- 5.4.2.5 Rest of South America
- 5.4.3 Europe
- 5.4.3.1 United Kingdom
- 5.4.3.2 Germany
- 5.4.3.3 France
- 5.4.3.4 Spain
- 5.4.3.5 Italy
- 5.4.3.6 Benelux (Belgium, Netherlands, and Luxembourg)
- 5.4.3.7 Nordics (Sweden, Norway, Denmark, Finland, and Iceland)
- 5.4.3.8 Rest of Europe
- 5.4.4 Asia-Pacific
- 5.4.4.1 China
- 5.4.4.2 India
- 5.4.4.3 Japan
- 5.4.4.4 South Korea
- 5.4.4.5 Australia
- 5.4.4.6 South-East Asia (Singapore, Indonesia, Malaysia, Thailand, Vietnam, and Philippines)
- 5.4.4.7 Rest of Asia-Pacific
- 5.4.5 Middle East and Africa
- 5.4.5.1 United Arab Emirates
- 5.4.5.2 Saudi Arabia
- 5.4.5.3 South Africa
- 5.4.5.4 Nigeria
- 5.4.5.5 Rest of Middle East and Africa
- 5.4.1 North America
6 Competitive Landscape
- 6.1 Market Concentration
- 6.2 Strategic Moves
- 6.3 Market Share Analysis
- 6.4 Company Profiles (includes Global level Overview, Market Level Overview, Core Segments, Financials as available, Strategic Information, Market Rank/Share for Key Companies, Products & Services, and Recent Developments)
- 6.4.1 PayPal Holdings Inc.
- 6.4.2 Ant Group Co. Ltd.
- 6.4.3 Stripe Inc.
- 6.4.4 Block Inc. (Square, Cash App)
- 6.4.5 Adyen N.V.
- 6.4.6 Coinbase Global Inc.
- 6.4.7 Robinhood Markets Inc.
- 6.4.8 Revolut Ltd.
- 6.4.9 Klarna Bank AB
- 6.4.10 N26 GmbH
- 6.4.11 SoFi Technologies Inc.
- 6.4.12 Nubank (Nu Holdings)
- 6.4.13 Wise plc
- 6.4.14 Juspay
- 6.4.15 FIS Global
- 6.4.16 Fiserv Inc.
- 6.4.17 Intuit Inc.
- 6.4.18 M-PESA (Vodafone / Safaricom)
- 6.4.19 Paytm Digital Payments Ltd.
- 6.4.20 Razorpay Software Pvt Ltd.
7 Market Opportunities & Future Outlook
- 7.1 White-space & Unmet-Need Assessment