

|
시장보고서
상품코드
2123014
데이터센터 랙 배전 유닛(PDU) 시장 : 점유율 분석, 업계 동향과 통계, 성장 예측(2026-2031년)Data Center Rack Power Distribution Unit (PDU) - Market Share Analysis, Industry Trends & Statistics, Growth Forecasts (2026 - 2031) |
||||||
 Mordor Intelligence
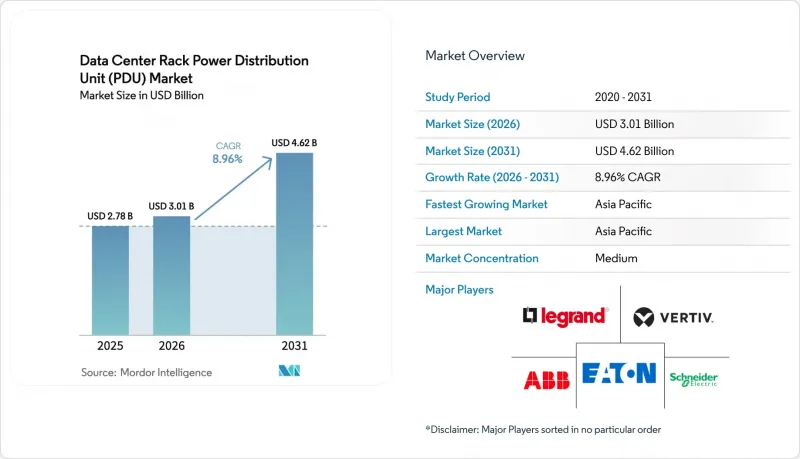
Mordor Intelligence에 의하면, 데이터센터 랙 배전 유닛(PDU) 시장 규모는 2025년 27억 8,000만 달러에서 2026년에는 30억 1,000만 달러로 확대되어 2031년까지 46억 2,000만 달러에 이를 것으로 예상되고 있어 2026-2031년까지 CAGR 8.96%로 성장할 전망입니다.
본 보고서는 구조별(스마트 PDU, 베이직 PDU), 상별(단상, 3상), 티어 유형별(Tier 1·2, Tier 3, 티어 4), 데이터센터 규모별(소규모, 중규모, 대규모, 하이퍼스케일), 데이터센터 유형별(코로케이션, 기타),랙 밀도별(10kW 이하, 10-20kW, 20kW 초과), 지역별로 분류되어 있습니다. 시장 예측은 금액(달러) 기준으로 제시되어 있습니다.
전 세계 데이터센터 랙 배전 유닛(PDU) 시장 동향 및 인사이트
하이퍼스케일 데이터센터에 대한 투자가 스마트 PDU 도입 수요를 지속적으로 견인
하이퍼스케일 사업자들은 자본 계획을 가속화하고 있으며, 단일 캠퍼스 내 건설 규모는 현재 1GW를 초과하고 있습니다. 각 사이트에는 수천 대의 지능형 PDU가 도입되어 있으며, 이들은 고해상도 원격 측정 데이터를 클라우드 분석 플랫폼으로 전송합니다. 이를 통해 사업자는 부하 균형 조정, 친환경 에너지 일정 관리, 종량제 모델에서 전력 데이터의 수익화를 실현할 수 있습니다. 3상 콘센트 수준의 스위칭 하드웨어 가격은 기본 모델에 비해 평균 40-60% 더 비싸지만, 원격 펌웨어 업데이트를 통해 기술자의 현장 방문이 불필요해지므로 총 소유 비용은 낮아집니다. 이 솔루션은 버지니아주, 도쿄, 프랑크푸르트의 기존 클러스터에 도입되고 있으며, 소버린 클라우드 규제로 인해 국내 인프라 구축이 의무화된 아부다비와 쿠알라룸푸르로도 확대되고 있습니다.
랙 수준의 배전에서의 AI 기반 에너지 관리 통합
차세대 PDU에 내장된 엣지 AI 칩은 전압, 고조파, 온도의 측정값을 로컬에서 처리하고, 마이크로초 단위로 명령을 발행하여 중요도가 낮은 부하를 억제하거나 전력이 더 건전한 상으로 공급되도록 합니다. 이를 통해 컴퓨팅 오케스트레이션과 배전 간의 루프가 완성되어, 컨테이너 플랫폼이 에너지를 실시간 스케줄링 제약 조건으로 반영할 수 있게 됩니다. 코로케이션 제공업체는 ±1%의 정확도를 가진 서브랙 단위의 계측을 활용하여 테넌트에 대한 투명한 과금을 실현하는 동시에, 보다 친환경적인 포트폴리오 파이낸싱을 지원하고 있습니다.
랙 전력 밀도 상승으로 인한 기존 데이터센터의 층별 정격 초과
2020년 이전에 건설된 시설은 5-8kW의 설계 허용 범위와 평방피트당 200W 이하의 바닥 하중을 특징으로 했으나, 현재는 20-30kW 수요에 직면하여 구조 보강, 버스웨이 교체, 유틸리티 변압기 업그레이드가 필요합니다. 개보수 예산은 평방피트당 500-800달러에 달하는 경우가 많으며, 공사 기간은 6-12개월에 이르러 수익을 창출하는 업무에 차질을 빚게 됩니다. 싱가포르나 런던 등 부지가 제한된 대도시권의 사업자들은 업그레이드 비용과 엣지 데이터센터 또는 그린필드에서의 확장을 비교 검토하고 있으며, 그 결과 PDU 교체 시기가 지연되어 전체적인 판매량이 억제되고 있습니다.
부문 분석
스마트 유닛은 2025년 시점에서 이미 61.42%의 시장 점유율을 차지하고 있으며, 높은 평균 판매 가격 덕분에 이 부문의 데이터센터 랙 배전 유닛(PDU) 시장 규모는 계속해서 확대되고 있습니다. 지능형 스트립은 세밀한 kW시 단위 추적, 콘센트 단위 스위칭, 예측 유지보수를 가능하게 하며, 이러한 기능은 사용량 기반의 코로케이션 요금 체계와 하이브리드 클라우드 오케스트레이션을 뒷받침하는 기반이 되고 있습니다. 각 서비스 제공업체들은 랙 내 단위 과금을 도입한 후 캐비닛당 수익이 12-18% 증가했다고 보고하고 있습니다. 기본 PDU는 2031년까지 연평균 성장률(CAGR) 9.43%를 나타낼 것으로 예측되며, 저밀도 및 비용 중심의 사이트에서는 여전히 유효하지만, 클라우드 호스팅형 관리 포털을 통해 스마트 제품의 총 소유 비용(TCO)이 절감됨에 따라 그 시장 점유율은 감소하고 있습니다. 예측 기간 동안 펌웨어 구독 모델 덕분에 소규모 기업에게도 경제적으로 매력적인 선택지가 될 것으로 예상되므로, 스마트 유닛 시장 점유율은 매년 꾸준히 확대될 전망입니다.
PDU는 현재 VMware vRealize 및 Red Hat Ansible과 같은 오케스트레이션 도구와 통합되어 IT 워크로드와 전력 용량 사이에 피드백 루프를 형성하고 있습니다. 실시간 전력 데이터를 기반으로 서버 가동을 제어함으로써 운영 담당자는 유휴 용량을 줄이고 변압기 업그레이드를 미룰 수 있습니다. 이는 전력 회사의 납기 기간이 18-24개월에 달하는 경우 큰 이점이 됩니다. AI 분석, 보안 연결성, PUE 투명성을 요구하는 규제의 추진이 맞물리면서 스마트화의 추세가 더욱 확고해지고 있으며, 데이터센터 랙 배전 유닛(PDU) 시장이 이러한 프리미엄 지위를 유지할 것으로 확실시되고 있습니다.
2025년에는 3상 기기가 데이터센터 랙 배전 유닛(PDU) 시장에서 58.32%의 점유율을 차지할 것으로 보이며, 2031년까지 연평균 성장률(CAGR) 9.26%를 달성할 전망입니다. 3상 아키텍처는 부하를 여러 도체에 분산시키고 공급 전압을 415V 또는 480V로 높임으로써 현대 랙의 전력 수요를 충족시킵니다. 이를 통해 단상 208V에 비해 저항 손실을 절반으로 줄일 수 있습니다. 하이퍼스케일 클라우드는 15kW를 초과하는 밀도를 실현하고, 향후 수냉식 AI 서버를 위한 여유를 확보하기 위해 2025년에 이 토폴로지를 표준화했습니다. 캘리포니아주, 뉴욕주, 독일의 인센티브 프로그램은 PUE 1.2 이하의 기준을 충족하는 시설에 보상을 제공함으로써 이러한 전환을 더욱 가속화하고 있습니다. 이 기준을 충족하려면 일반적으로 3상 배전이 필요합니다. 그 결과, 3상 배전은 용량 확대 및 신규 건설의 기반으로 계속 자리 잡고 있으며, 데이터센터 랙 배전 유닛(PDU) 시장에서 압도적인 입지를 공고히 하고 있습니다.
반면, 엣지 환경이나 소규모 기업용 서버실에서는 전기 기술자의 3상 관련 전문 지식이 부족한 경우나 지역 규제로 인해 고전압 피더 사용이 제한되는 경우가 있어, 단상이 여전히 중요한 역할을 수행하고 있습니다. 현재 벤더의 로드맵에는 공통 펌웨어 및 관리 프레임워크 내에서 단상과 3상의 변형이 포함되어 있어, 운영자가 혼합된 환경을 관리하는 데 도움이 되고 있습니다. 그러나 AI 도입으로 지사 수준에서도 랙당 10kW를 초과하는 사례가 늘어남에 따라 수요는 계속해서 3상으로 이동할 것이며, 총 출하 대수에서 단상의 점유율은 필연적으로 축소될 것으로 예측됩니다.
지역별 분석
아시아태평양은 2025년에 시장 점유율의 40.13%를 차지했습니다. 이는 토지와 청정 에너지가 풍부한 내륙 지역에 하이퍼스케일 시설 건설을 촉진하는 각국의 클라우드 프로그램과 재생에너지 전략에 힘입은 결과입니다. 중국의 ‘동부 데이터, 서부 컴퓨팅’ 정책만으로도 PDU 출하를 두 자릿수 기가와트 규모의 프로젝트로 견인하고 있는 반면, 인도의 1,000MW 규모 파이프라인은 국내 SaaS 기업 및 다국적 기업의 전용 데이터센터를 뒷받침하고 있습니다. 일본에서는 자동차 제조업체가 센서 데이터를 실시간 분석 클러스터로 전송하는 특히 아이치현과 가나가와현 주변의 자동차 테스트 코스 및 스마트 제조 에지 노드를 통해 출하량이 서서히 증가하고 있습니다. 이러한 동향이 해당 지역의 연평균 성장률(CAGR) 10.14%를 뒷받침하며, 데이터센터 랙 배전 유닛(PDU) 시장 규모에서 해당 지역의 우위를 강화하고 있습니다.
북미는 이에 이어 2024-2025년까지 1,000억 달러를 넘는 하이퍼스케일용 설비 투자가 예정되어 있습니다. 버지니아주 라우던 카운티에서는 기록적인 건설이 잇따르고 있으며, 오리건주의 재생에너지 비율이 높은 전력망은 그린 클라우드 크레딧을 목표로 하는 GPU 팜을 유치하고 있습니다. 지역 전력 회사의 납기 기간이 2년을 초과함에 따라, 각 하이퍼스케일러 기업들은 변압기를 사전 구매하고 PDU를 일괄 발주함으로써 2027년까지공급을 확보하고 있습니다. 아시아태평양에 비해 성장은 완만하지만, 압도적인 규모 덕분에 데이터센터 랙 배전 유닛(PDU) 시장공급량은 견조한 추세를 보이고 있습니다.
유럽에서는 에너지 비용 급등에 더해, EU 에너지 효율 지침에 따른 엄격한 효율화 요건으로 인해 성장이 둔화되고 있습니다. 해당 지침에서는 사업자에게 PUE 1.3 이하의 성능 달성 및 분기별 소비량 보고를 의무화하고 있습니다. 투자는 용량 확충보다는 기존 설비의 효율화로 전환되고 있으며, 세밀한 원격 측정 기능을 갖춘 지능형 PDU가 선호되고 있지만, 전체적인 출하량 증가세는 억제되고 있습니다. 한편, 중동 및 아프리카는 대륙 간 연결의 허브로 부상하고 있습니다. 아랍에미리트와 사우디아라비아의 ‘소버린 클라우드’ 정책이 현지 내 하이퍼스케일 시설 건설을 뒷받침하고 있으며, NEOM과 같은 그린필드형 스마트시티 구상에는 100% 재생에너지로 가동되는 5GW 규모의 데이터센터가 포함되어 있어,대용량 3상 유닛에 대한 새로운 수요의 주축이 되고 있습니다. 남미에서는 브라질이 국내 데이터 현지화 정책을 시행하고 있는 것이 클라우드 사업자 시장 진입을 촉진하고 지역 시설 설립을 뒷받침하고 있어, 거시경제의 변동에도 불구하고 PDU 수요를 끌어올리고 있습니다.
기타 혜택
- 엑셀 형식 시장 예측(ME) 시트
- 3개월간의 애널리스트 지원
자주 묻는 질문
목차
제1장 서론
제2장 조사 방법
제3장 주요 요약
제4장 시장 구도
제5장 시장 규모와 성장 예측
제6장 경쟁 구도
제7장 시장 기회와 향후 전망
JHS 26.09.09According to Mordor Intelligence, the data center rack power distribution unit (PDU) market size is expected to increase from USD 2.78 billion in 2025 to USD 3.01 billion in 2026 and reach USD 4.62 billion by 2031, growing at a CAGR of 8.96% over 2026-2031.
This report is Segmented by Construction (Smart PDU, and Basic PDU), Phase (Single-Phase, and Three-Phase), Tier Type (Tier 1 and 2, Tier 3, and Tier 4), Data Center Size (Small, Medium, Large, and Hyperscale), Data Center Type (Colocation, and More), Rack Density (Up To 10 KW, 10-20 KW, and Above 20 KW), and Geography. The Market Forecasts are Provided in Terms of Value (USD).
Global Data Center Rack Power Distribution Unit (PDU) Market Trends and Insights
Investments in Hyperscale Data Centers Continuing to Spur Demand for Smart PDU Installations
Hyperscale operators have accelerated capital plans, with single-campus builds now topping 1 GW. Each site deploys thousands of intelligent PDUs that stream high-resolution telemetry into cloud analytics platforms, letting operators balance phase load, enforce green-energy scheduling, and monetize power data within usage-based billing models. Price premiums on three-phase outlet-level switching hardware average 40-60% over basic units, yet total cost of ownership falls as remote firmware updates eliminate technician truck rolls. Adoption permeates established clusters in Virginia, Tokyo, and Frankfurt, and is spreading to Abu Dhabi and Kuala Lumpur, where sovereign-cloud rules require in-country infrastructure.
Integration of AI-Driven Energy Management for Rack-Level Distribution
Edge AI chips embedded inside next-generation PDUs process voltage, harmonic, and thermal readings locally, issuing commands in microseconds to curtail non-critical loads or route power to healthier phases. This closes the loop between compute orchestration and electrical distribution, allowing container platforms to incorporate energy as a real-time scheduling constraint. Colocation providers capitalize on sub-rack metering within +-1% accuracy, enabling transparent tenant billing and supporting greener portfolio financing.
Rising Rack Power Densities Exceeding Legacy Data Center Floor Ratings
Facilities built before 2020 feature 5-8 kW design envelopes and floor loading below 200 W per square foot; they now confront 20-30 kW demands that require structural reinforcement, busway replacement, and utility transformer upgrades. Retrofit budgets often reach USD 500-800 per square foot, extend over 6-12 months, and interrupt revenue-generating operations. Operators in land-constrained metros such as Singapore and London weigh the cost of upgrades against edge or greenfield deployment, delaying PDU revamps and suppressing overall unit volume.
Other drivers and restraints analyzed in the detailed report include:
- Increasing Adoption of High-Density Compute Accelerators Demanding Advanced PDUs
- Shift to Liquid Cooling Requiring PDU Redesign for Hybrid Power and Cooling Delivery
- Cybersecurity Concerns Around Networked PDUs
For complete list of drivers and restraints, kindly check the Table Of Contents.
Segment Analysis
Smart units already command with 61.42% market share in 2025, and their higher average selling price continues to lift the data center rack power distribution unit market size for this segment. Intelligent strips enable granular kilowatt-hour tracking, outlet-level switching, and predictive maintenance, capabilities that underpin usage-based colocation pricing and hybrid-cloud orchestration. Service providers report revenue-per-cabinet gains of 12-18% after enabling sub-rack billing. Basic PDUs forecast to advance at a 9.43% CAGR to 2031, viable in low-density and cost-sensitive sites, yet their share erodes as cloud-hosted management portals reduce the total cost of ownership for smart options. Over the forecast horizon, smart units accrue incremental share each year as firmware subscription models make them financially attractive even for small enterprises.
PDUs now integrate with orchestration tools such as VMware vRealize and Red Hat Ansible, creating a feedback loop between IT workloads and electrical capacity. By controlling server spin-up based on real-time power data, operators lower stranded capacity and defer transformer upgrades, a major incentive when utility lead times stretch to 18-24 months. The convergence of AI analytics, secure connectivity, and regulatory push toward PUE transparency further locks in the smart trajectory, ensuring that the data center rack power distribution unit (PDU) market retains this premium profile.
In 2025, three-phase equipment held a 58.32% share of the data center rack power distribution unit market and is set to achieve a 9.26% CAGR through 2031. Three-phase architectures satisfy modern rack power needs by distributing load across multiple conductors and elevating the supply voltage to 415 V or 480 V, which halves resistive losses relative to single-phase 208 V. Hyperscale clouds standardized on this topology in 2025 to achieve densities beyond 15 kW and maintain headroom for future liquid-cooled AI servers. Incentive programs in California, New York, and Germany further accelerate transition by rewarding sites that meet sub-1.2 PUE thresholds, which typically require three-phase distribution. Consequently, three-phase remains the cornerstone of capacity expansions and greenfield builds, solidifying its majority position in the data center rack power distribution unit (PDU) market.
Single-phase remains relevant at the edge and in small enterprise rooms because electricians may lack three-phase expertise, and local codes sometimes restrict high-voltage feeders. Vendor roadmaps now include single- and three-phase variants within common firmware and management frameworks, helping operators manage mixed estates. Yet as AI adoption pushes even branch offices beyond 10 kW per rack, demand will continue to tilt toward three-phase, inevitably shrinking single-phase share in total shipment terms.
Complete Report Scope:
- By Construction
- Smart PDU
- Basic PDU
- By Phase
- Single-Phase
- Three-Phase
- By Tier Type
- Tier 1 and 2
- Tier 3
- Tier 4
- By Data Center Size
- Small Data Center
- Medium Data Center
- Large Data Center
- Hyperscale Data Center
- By Data Center Type
- Colocation Data Center
- Hyperscalers Data Center/CSPs
- Enterprise and Edge Data Center
- By Rack Density (kW per Rack)
- Up to 10 kW
- 10-20 kW
- Above 20 kW
- By Geography
- North America
- United States
- Canada
- Mexico
- South America
- Brazil
- Argentina
- Rest of South America
- Europe
- Germany
- United Kingdom
- France
- Italy
- Spain
- Rest of Europe
- Asia-Pacific
- China
- India
- Japan
- South Korea
- Australia and New Zealand
- Rest of Asia-Pacific
- Middle East
- Saudi Arabia
- United Arab Emirates
- Turkey
- Rest of Middle East
- Africa
- South Africa
- Nigeria
- Egypt
- Rest of Africa
- North America
Geography Analysis
Asia-Pacific accounted for 40.13% of the market share in 2025, helped by national cloud programs and renewable-energy strategies that funnel hyperscale builds to inland provinces where land and clean power are abundant. China's Eastern Data Western Computing policy alone drives PDU shipments into double-digit gigawatt projects, while India's 1,000 MW pipeline supports domestic SaaS and multinational captives. Japan adds incremental volume through automotive test tracks and smart-manufacturing edge nodes, particularly around Aichi and Kanagawa prefectures, where automakers feed sensor data into real-time analytics clusters. These dynamics underpin the region's 10.14% CAGR and reinforce its lead in the data center rack power distribution unit market size.
North America follows, supported by USD 100 billion-plus hyperscale capex commitments in 2024-2025. Virginia's Loudoun County continues to absorb record-setting builds, and Oregon's renewable-heavy grid attracts GPU farms that target green cloud credits. Because local utility lead times stretch beyond two years, hyperscalers pre-purchase transformers and contract PDUs in bulk, securing unit allocations through 2027. While growth moderates relative to Asia-Pacific, sheer scale keeps volume robust in the data center rack power distribution unit (PDU) market.
Europe lags on account of energy-cost inflation and strict efficiency mandates under the EU Energy Efficiency Directive, which press operators to demonstrate sub-1.3 PUE performance and quarterly consumption reporting. Investment shifts toward retrofit efficiency rather than capacity addition, favoring intelligent PDUs with granular telemetry but tempering overall shipment growth. Middle East and Africa, meanwhile, emerge as intercontinental connectivity hubs. Sovereign-cloud policies in the United Arab Emirates and Saudi Arabia spur local hyperscale builds, and greenfield smart-city initiatives such as NEOM incorporate fully renewable 5 GW data centers, adding a fresh vector of demand for high-capacity three-phase units. South America rounds out the picture as Brazil enforces in-country data localization, motivating cloud entrants to establish regional facilities that push PDU demand upward despite macro volatility.
- ABB Ltd.
- Schneider Electric SE
- Vertiv Group Corp.
- Eaton Corporation plc
- Legrand SA
- nVent Electric plc (Enlogic)
- Rittal GmbH & Co. KG
- Cyber Power Systems Inc.
- Aten International Co. Ltd.
- Conteg spol. s r.o.
- Server Technology Inc.
- Geist Global
- Tripp Lite
- Huawei Technologies Co., Ltd.
- Panduit Corp.
- PDU eXpert
- The Siemon Company
- Starline
- Leviton Manufacturing Co., Inc.
Additional Benefits:
- The market estimate (ME) sheet in Excel format
- 3 months of analyst support
TABLE OF CONTENTS
1 INTRODUCTION
- 1.1 Study Assumptions and Market Definition
- 1.2 Scope of the Study
2 RESEARCH METHODOLOGY
3 EXECUTIVE SUMMARY
4 MARKET LANDSCAPE
- 4.1 Market Overview
- 4.2 Market Drivers
- 4.2.1 Investments in Hyperscale Data Centers Continuing to Spur Demand for Smart PDU Installations
- 4.2.2 Industry Mandates for Power Availability and Demand for Software-Defined Data Centers
- 4.2.3 Rising Deployment of Edge Data Centers
- 4.2.4 Integration of AI-Driven Energy Management for Rack-Level Distribution
- 4.2.5 Increasing Adoption of High-Density Compute Accelerators Demanding Advanced PDUs
- 4.2.6 Shift to Liquid Cooling Requiring PDU Redesign for Hybrid Power and Cooling Delivery
- 4.3 Market Restraints
- 4.3.1 Faster Refresh Life Cycle than Data Center Profitable Life Expectancy
- 4.3.2 Supply Chain Volatility for Semiconductor Components in Intelligent PDUs
- 4.3.3 Rising Rack Power Densities Exceeding Legacy Data Center Floor Ratings
- 4.3.4 Cybersecurity Concerns Around Networked PDUs
- 4.4 Industry Value Chain Analysis
- 4.5 Regulatory Landscape
- 4.6 Technological Outlook
- 4.7 Impact of Macroeconomic Factors
- 4.8 Porter's Five Forces Analysis
- 4.8.1 Threat of New Entrants
- 4.8.2 Bargaining Power of Suppliers
- 4.8.3 Bargaining Power of Buyers
- 4.8.4 Threat of Substitutes
- 4.8.5 Competitive Rivalry
5 MARKET SIZE AND GROWTH FORECASTS (VALUE)
- 5.1 By Construction
- 5.1.1 Smart PDU
- 5.1.2 Basic PDU
- 5.2 By Phase
- 5.2.1 Single-Phase
- 5.2.2 Three-Phase
- 5.3 By Tier Type
- 5.3.1 Tier 1 and 2
- 5.3.2 Tier 3
- 5.3.3 Tier 4
- 5.4 By Data Center Size
- 5.4.1 Small Data Center
- 5.4.2 Medium Data Center
- 5.4.3 Large Data Center
- 5.4.4 Hyperscale Data Center
- 5.5 By Data Center Type
- 5.5.1 Colocation Data Center
- 5.5.2 Hyperscalers Data Center/CSPs
- 5.5.3 Enterprise and Edge Data Center
- 5.6 By Rack Density (kW per Rack)
- 5.6.1 Up to 10 kW
- 5.6.2 10-20 kW
- 5.6.3 Above 20 kW
- 5.7 By Geography
- 5.7.1 North America
- 5.7.1.1 United States
- 5.7.1.2 Canada
- 5.7.1.3 Mexico
- 5.7.2 South America
- 5.7.2.1 Brazil
- 5.7.2.2 Argentina
- 5.7.2.3 Rest of South America
- 5.7.3 Europe
- 5.7.3.1 Germany
- 5.7.3.2 United Kingdom
- 5.7.3.3 France
- 5.7.3.4 Italy
- 5.7.3.5 Spain
- 5.7.3.6 Rest of Europe
- 5.7.4 Asia-Pacific
- 5.7.4.1 China
- 5.7.4.2 India
- 5.7.4.3 Japan
- 5.7.4.4 South Korea
- 5.7.4.5 Australia and New Zealand
- 5.7.4.6 Rest of Asia-Pacific
- 5.7.5 Middle East
- 5.7.5.1 Saudi Arabia
- 5.7.5.2 United Arab Emirates
- 5.7.5.3 Turkey
- 5.7.5.4 Rest of Middle East
- 5.7.6 Africa
- 5.7.6.1 South Africa
- 5.7.6.2 Nigeria
- 5.7.6.3 Egypt
- 5.7.6.4 Rest of Africa
- 5.7.1 North America
6 COMPETITIVE LANDSCAPE
- 6.1 Market Concentration
- 6.2 Strategic Moves
- 6.3 Market Share Analysis
- 6.4 Company Profiles (Includes Global Level Overview, Market Level Overview, Core Segments, Financials as Available, Strategic Information, Market Rank/Share, Products and Services, and Recent Developments)
- 6.4.1 ABB Ltd.
- 6.4.2 Schneider Electric SE
- 6.4.3 Vertiv Group Corp.
- 6.4.4 Eaton Corporation plc
- 6.4.5 Legrand SA
- 6.4.6 nVent Electric plc (Enlogic)
- 6.4.7 Rittal GmbH & Co. KG
- 6.4.8 Cyber Power Systems Inc.
- 6.4.9 Aten International Co. Ltd.
- 6.4.10 Conteg spol. s r.o.
- 6.4.11 Server Technology Inc.
- 6.4.12 Geist Global
- 6.4.13 Tripp Lite
- 6.4.14 Huawei Technologies Co., Ltd.
- 6.4.15 Panduit Corp.
- 6.4.16 PDU eXpert
- 6.4.17 The Siemon Company
- 6.4.18 Starline
- 6.4.19 Leviton Manufacturing Co., Inc.
7 MARKET OPPORTUNITIES AND FUTURE OUTLOOK
- 7.1 White-Space and Unmet-Need Assessment


