|
시장보고서
상품코드
2123104
중국의 폐기물 관리 시장 : 점유율 분석, 산업 동향 및 통계 데이터, 성장 예측(2026-2031년)China Waste Management - Market Share Analysis, Industry Trends & Statistics, Growth Forecasts (2026 - 2031) |
||||||
 Mordor Intelligence
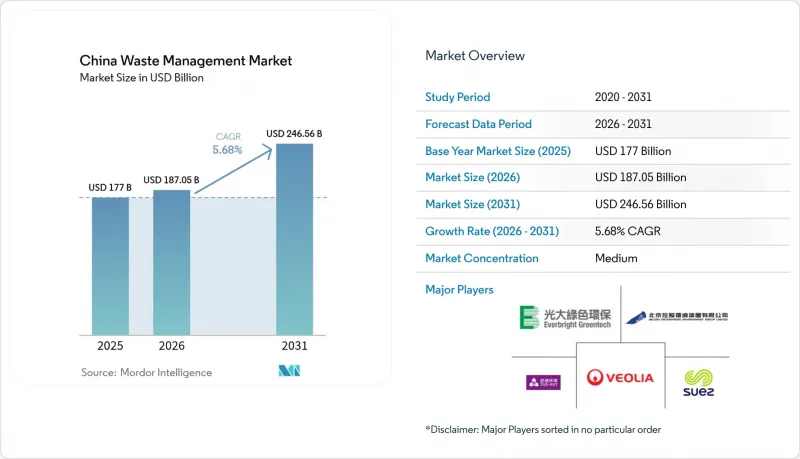
Mordor Intelligence에 의하면, 중국 폐기물 관리 시장 규모는 2025년에 1,770억 달러로 평가되었고 2026년 1,870억 5,000만 달러에서 2031년까지 2,465억 6,000만 달러에 이를 것으로 예측되며, 예측 기간(2026-2031년) CAGR은 5.68%를 나타낼 전망입니다.
본 보고서는 발생원별(주거, 상업 등), 서비스 유형별(폐기/처리 등), 폐기물 유형별(도시 고형 폐기물, 산업 유해 폐기물 등), 지역별(동부, 북부 등)로 분류되어 있습니다. 본 보고서에서는 상기 모든 부문에 대해 시장 규모 및 예측치(달러)를 제시하고 있습니다.
중국 폐기물 관리 시장 동향 및 인사이트
고정가격 임베디드 제도에 힘입은 폐기물 발전 능력 확대
1,010곳 이상의 소각 시설이 전 세계 처리 능력의 거의 절반을 차지하고 있지만, 원료 공급의 불안정성으로 인해 많은 시설이 설계 부하보다 낮은 가동률을 보이고 있습니다. 2025년 개혁에 따라 고정 가격 임베디드 제도는 시장 기반 가격 책정으로 전환되며, 동시에 녹색 전력 인증서가 도입될 예정입니다. 열효율 70.9%를 달성한 시설의 경우, 투자 회수 기간은 약 4.8년으로, 제한된 보조금으로도 수익성을 확보할 수 있습니다. 공급 과잉을 배경으로 중국 기업들은 베트남 및 걸프 연안 국가들에 대한 투자를 추진하며, 턴키 플랜트 및 운영·유지보수(O&M) 전문 지식을 수출하고 있습니다.
도시화에 따른 2·3급 도시의 일반 폐기물량 급증
급속한 인구 이동으로 인해 도시 고형 폐기물 발생량이 인프라 정비 속도를 앞지르는 속도로 증가하고 있습니다. 2024년 국가발전개혁위원회의 보고서에 따르면, 농촌 지역의 수거율은 90%에 달하지만, 도시화가 진행되는 지역에서는 여전히 처리 능력 부족에 직면해 있습니다. 스마트 쓰레기통과 모듈식 중계 스테이션을 결합한, 확장성이 높고 자산 부담이 적은 시스템에 대한 수요가 증가하고 있습니다. 중부 및 남부 도시에서는 2030년까지 모든 도시 지역에서 폐기물의 100% 안전한 처분을 실현하겠다는 국가 목표에 힘입어, 폐기물과 전력 문제를 동시에 해결하는 이중 해결책으로서 폐기물 발전이 도입되고 있습니다. 기술 공급업체들은 설비와 디지털 O&M 서비스를 패키지로 묶은 계약을 통해 혜택을 보고 있으며, 이를 통해 도입 주기가 가속화되고 초기 자본 위험이 완화되고 있습니다.
지방 자치단체의 재정적 제약이 PPP 지급을 제한
예산 부족으로 인해 중규모 도시들이 PPP 연금 지급을 보장할 수 있는 능력이 제한되고 있어, 프로젝트 실행이 지연되고 거래 상대방 위험이 높아지고 있습니다. 이에 대응하여 개발업체들은 지자체의 현금 지출을 줄이면서도 서비스 수준을 유지하는 자산 부담이 적은 서비스 모델이나 수익 분배 계약을 제안하고 있습니다. 자금 부족을 보완하기 위해 그린본드나 탄소 크레딧을 결합한 하이브리드형 자금 조달 수단이 등장하고 있습니다.
부문별 분석
2025년, 중국 폐기물 관리 시장에서 가정 쓰레기가 40.12%를 차지하며, 수거 네트워크 계획의 기반으로서 그 역할을 확고히 했습니다. 도시 지역의 가구 증가와 개인 소비 증가로 인해 쓰레기통에서 수거 차량으로 옮겨지는 양이 증가하는 추세이며, 지자체는 IoT 기반 스마트 쓰레기통 도입을 피할 수 없게 되었습니다. 이 스마트 쓰레기통은 용량의 80%에 도달했을 때만 수거를 요청하므로, 수거 경로의 효율을 30% 향상시키고 있습니다. 전자상거래용 포장재와 음식 배달 서비스의 동향에 힘입어 사업계 폐기물은 2031년까지 연평균 성장률(CAGR) 10.95%를 나타낼 것으로 예측되며, 이는 모든 폐기물 발생원 중 가장 높은 성장률입니다. 광둥성과 장쑤성의 소매 풀필먼트 센터에서는 이미 제3자 사업자와 계약을 체결하여 골판지 압축 포장 및 플라스틱 파쇄를 전문적으로 수행하게 하고 있으며, 이는 폐기물 흐름의 집중에 따라 서비스의 전문화가 진행되고 있음을 보여줍니다.
강화된 가정 쓰레기 분리 수거 규정에 따라, 집 앞에서 재활용 가능 쓰레기, 음식물 쓰레기, 유해 쓰레기, 일반 쓰레기 등 4가지 유형로 분리해야 합니다. 이 규제의 추진으로 인해 색상별로 구분된 수거 용기의 도입과 중계소에서 분리 수거 정확도를 확인하는 AI 비전 시스템에 대한 수요가 증가하고 있습니다. 도시 지역의 민관협력(PPP)에서는 수거, 계몽 활동, 데이터 보고가 단일 계약으로 통합되어 있어, 민간 기업 입장에서는 수년에 걸친 수익 전망이 확보되고 있습니다. 이와 병행하여, 산업 클러스터에서는 유해 폐기물 관리를 발생부터 처분까지 전 과정에 걸친 매니페스트의 추적 가능성을 제공하는 인증 업체에 위탁하고 있어, 서비스 범위가 가정 쓰레기를 넘어 확대되고 있습니다.
기타 혜택:
- Excel 형식 시장 예측(ME) 시트
- 3개월간의 애널리스트 지원
자주 묻는 질문
목차
제1장 서론
제2장 분석 방법
제3장 주요 요약
제4장 시장 구도
제5장 시장 규모 및 성장률 예측
제6장 경쟁 구도
제7장 시장 기회와 향후 전망
JHS 26.09.09According to Mordor Intelligence, the China waste management market size was valued at USD 177 billion in 2025 and estimated to grow from USD 187.05 billion in 2026 to reach USD 246.56 billion by 2031, at a CAGR of 5.68% during the forecast period (2026-2031).
This report is Segmented by Source (Residential, Commercial, and More), by Service Type (Disposal/Treatment and More), by Waste Type (Municipal Solid Waste, Industrial Hazardous Waste, and More), and by Region (Eastern China, Northern China, and More). The Report Offers Market Size and Forecasts in Value (USD) for all the Above Segments.
China Waste Management Market Trends and Insights
Expansion of Waste-to-Energy Capacity Backed by Feed-in Tariffs
More than 1,010 incineration plants form almost half of global capacity, yet many run below design load because of uneven feedstock supply. The 2025 reform moves feed-in tariffs toward market-based pricing while integrating green electricity certificates. Facilities achieving 70.9% thermal efficiency show payback periods near 4.8 years, enabling profitability with limited subsidies. Overcapacity is driving Chinese firms to invest in Vietnam and the Gulf states, exporting turnkey plants and O&M expertise.
Urbanization-driven MSW Volume Surge in Tier-2 and Tier-3 Cities
Rapid migration is lifting municipal solid waste output faster than infrastructure can keep pace. The 2024 National Development and Reform Commission report confirms 90% rural collection coverage, yet urbanizing districts still face capacity shortfalls. Demand is rising for scalable, asset-light systems that combine smart bins with modular transfer stations. Central and Southern cities are adopting waste-to-energy as a dual solution for waste and electricity, supported by a national goal of 100% safe disposal in all urban areas by 2030. Technology suppliers benefit from contracts that bundle equipment with digital O&M services, accelerating deployment cycles and reducing upfront capital risks.
Local-Government Fiscal Constraints Limiting PPP Payments
Budget pressures restrict the ability of mid-sized cities to guarantee PPP annuities, delaying project execution and raising counterparty risk. Developers respond with asset-light service models and revenue-sharing arrangements that reduce municipal cash outlay yet preserve service standards. Blended-finance vehicles incorporating green bonds and carbon credits are emerging to close funding gaps.
Other drivers and restraints analyzed in the detailed report include:
- Corporate ESG Mandates Driving Industrial Waste Outsourcing
- Zero-Waste City Program Scaling Nationwide
- Community Opposition to Incinerator Siting in Dense Provinces
For complete list of drivers and restraints, kindly check the Table Of Contents.
Segment Analysis
Residential waste contributed 40.12% of the Chinese waste management market in 2025, cementing its role as the backbone for collection network planning. Continuous urban household formation and rising consumer spending push bin-to-truck volumes upward, compelling municipalities to deploy IoT-enabled smart bins that trigger pickups only when 80% full, lifting route efficiency by 30%. Commercial waste, propelled by e-commerce packaging and food delivery trends, is forecast to register an 10.95% CAGR to 2031, the fastest among all sources. Retail fulfillment centers in Guangdong and Jiangsu have already contracted third-party operators for dedicated cardboard baling and plastics shredding, illustrating how service specialization follows waste-stream concentration.
Enhanced residential segregation rules require four-stream sorting that separates recyclables, food, hazardous, and residual waste at the doorstep. This regulatory push spurs demand for color-coded container fleets and AI vision systems that verify sorting accuracy at transfer stations. Urban neighborhood PPPs bundle collection, outreach, and data reporting under single contracts, creating multi-year revenue visibility for private firms. In parallel, industrial clusters outsource hazardous waste management to certified handlers offering cradle-to-grave manifest traceability, expanding service scope beyond household waste.
Complete Report Scope:
- By Source
- Residential
- Commercial (Retail, Office, etc.)
- Industrial
- Medical (Health and Pharmaceutical)
- Construction & Demolition
- Others (Institutional, Agricultural, etc.)
- By Service Type
- Collection, Trasportation, Sorting & Seggregation
- Disposal / Treatment
- Landfill
- Recycling & Resource Recovery
- Incineration & Waste-to-Energy
- Others (Chemical Treatment, Composting, etc.)
- Others (Consulting, Audit & Training, etc.)
- By Waste Type
- Municipal Solid Waste
- Industrial Hazardous Waste
- E-waste
- Plastic Waste
- Biomedical Waste
- Construction & Demolition Waste
- Agricultural Waste
- Other Specialized Waste (Radio Active, etc.)
- By Region
- Eastern China
- Northern China
- Central China
- Southern China
- Others
List of Companies Covered in this Report:
- Veolia Environment SA (Veolia China)
- China Everbright Environment Group Ltd.
- Suez SA (SUEZ NWS)
- Beijing Enterprises Environment Group Ltd.
- Tus-Sound Environmental Resources Co., Ltd.
- Capital Environment Holdings Ltd.
- Canvest Environmental Protection Group Co., Ltd.
- Grandblue Environment Co., Ltd.
- Dynagreen Environmental Protection Group Co., Ltd.
- Shanghai Environment Group Co., Ltd.
- Shenzhen Energy Environmental Co., Ltd.
- China Jinjiang Environment Holding Co., Ltd.
- Weiming Environmental Protection Co., Ltd.
- CITIC Envirotech Ltd.
- Sound Global Ltd.
- Guangxi Bossco Environmental Protection Co., Ltd.
- Hangzhou Jinjiang Group Co., Ltd.
- Anhui Shengyun Environment-Protection Group Co., Ltd.
- C&G Environmental Protection Holdings Ltd.
- Resou Resources Recovery Co., Ltd.
Additional Benefits:
- The market estimate (ME) sheet in Excel format
- 3 months of analyst support
TABLE OF CONTENTS
1 Introduction
- 1.1 Study Assumptions & Market Definition
- 1.2 Scope of the Study
2 Research Methodology
3 Executive Summary
4 Market Landscape
- 4.1 Market Overview
- 4.2 Market Drivers
- 4.2.1 Urbanization-Driven MSW Volume Surge in Tier-2 & Tier-3 Cities
- 4.2.2 Zero-Waste City Pilot Program Scaling Nationwide
- 4.2.3 Expansion of Waste-to-Energy Capacity Backed by Feed-in Tariffs
- 4.2.4 Corporate ESG Mandates Driving Industrial Waste Outsourcing
- 4.2.5 E-commerce Packaging Waste & Single-Use Plastic Ban Enforcement
- 4.2.6 Capital-Market Preference for Environmental PPPs Lowering Cost of Capital
- 4.3 Market Restraints
- 4.3.1 Local-Government Fiscal Constraints Limiting PPP Payments
- 4.3.2 Community Opposition to Incinerator Siting in Dense Provinces
- 4.3.3 SME Non-Compliance with Hazardous-Waste Manifest System
- 4.3.4 Fragmented Recycling Logistics Inflating Reverse-Haul Costs
- 4.4 Value / Supply-Chain Analysis
- 4.5 Regulatory Outlook
- 4.6 Technological Outlook
- 4.7 Industry Attractiveness - Porter's Five Forces
- 4.7.1 Bargaining Power of Buyers
- 4.7.2 Bargaining Power of Suppliers
- 4.7.3 Threat of New Entrants
- 4.7.4 Threat of Substitutes
- 4.7.5 Competitive Rivalry
- 4.8 Logistics Support & Development in Chinese Waste Management
- 4.9 Strategies of Rising Start-ups in Chinese Waste Management
- 4.10 Technological Innovation in Effective Waste Management
5 Market Size & Growth Forecasts (Value, In USD Billion)
- 5.1 By Source
- 5.1.1 Residential
- 5.1.2 Commercial (Retail, Office, etc.)
- 5.1.3 Industrial
- 5.1.4 Medical (Health and Pharmaceutical)
- 5.1.5 Construction & Demolition
- 5.1.6 Others (Institutional, Agricultural, etc.)
- 5.2 By Service Type
- 5.2.1 Collection, Trasportation, Sorting & Seggregation
- 5.2.2 Disposal / Treatment
- 5.2.2.1 Landfill
- 5.2.2.2 Recycling & Resource Recovery
- 5.2.2.3 Incineration & Waste-to-Energy
- 5.2.2.4 Others (Chemical Treatment, Composting, etc.)
- 5.2.3 Others (Consulting, Audit & Training, etc.)
- 5.3 By Waste Type
- 5.3.1 Municipal Solid Waste
- 5.3.2 Industrial Hazardous Waste
- 5.3.3 E-waste
- 5.3.4 Plastic Waste
- 5.3.5 Biomedical Waste
- 5.3.6 Construction & Demolition Waste
- 5.3.7 Agricultural Waste
- 5.3.8 Other Specialized Waste (Radio Active, etc.)
- 5.4 By Region
- 5.4.1 Eastern China
- 5.4.2 Northern China
- 5.4.3 Central China
- 5.4.4 Southern China
- 5.4.5 Others
6 Competitive Landscape
- 6.1 Market Concentration
- 6.2 Strategic Moves
- 6.3 Market Share Analysis
- 6.4 Company Profiles {(includes Global-level Overview, Market-level Overview, Core Segments, Financials as available, Strategic Information, Products & Services, and Recent Developments)}
- 6.4.1 Veolia Environment SA (Veolia China)
- 6.4.2 China Everbright Environment Group Ltd.
- 6.4.3 Suez SA (SUEZ NWS)
- 6.4.4 Beijing Enterprises Environment Group Ltd.
- 6.4.5 Tus-Sound Environmental Resources Co., Ltd.
- 6.4.6 Capital Environment Holdings Ltd.
- 6.4.7 Canvest Environmental Protection Group Co., Ltd.
- 6.4.8 Grandblue Environment Co., Ltd.
- 6.4.9 Dynagreen Environmental Protection Group Co., Ltd.
- 6.4.10 Shanghai Environment Group Co., Ltd.
- 6.4.11 Shenzhen Energy Environmental Co., Ltd.
- 6.4.12 China Jinjiang Environment Holding Co., Ltd.
- 6.4.13 Weiming Environmental Protection Co., Ltd.
- 6.4.14 CITIC Envirotech Ltd.
- 6.4.15 Sound Global Ltd.
- 6.4.16 Guangxi Bossco Environmental Protection Co., Ltd.
- 6.4.17 Hangzhou Jinjiang Group Co., Ltd.
- 6.4.18 Anhui Shengyun Environment-Protection Group Co., Ltd.
- 6.4.19 C&G Environmental Protection Holdings Ltd.
- 6.4.20 Resou Resources Recovery Co., Ltd.
7 Market Opportunities & Future Outlook
- 7.1 White-Space & Unmet-Need Assessment