|
시장보고서
상품코드
2123139
아프리카의 폐기물 관리 시장 : 점유율 분석, 산업 동향 및 통계 데이터, 성장 예측(2026-2031년)Africa Waste Management - Market Share Analysis, Industry Trends & Statistics, Growth Forecasts (2026 - 2031) |
||||||
 Mordor Intelligence
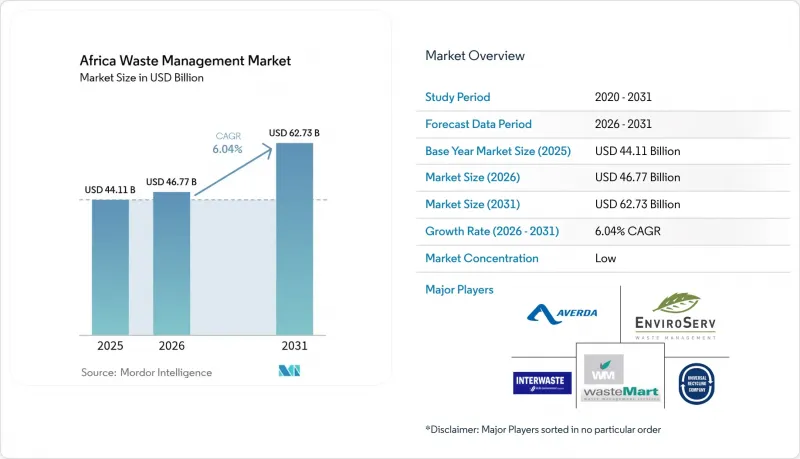
Mordor Intelligence에 의하면, 2026년 아프리카 폐기물 관리 시장 규모는 467억 7,000만 달러로 추정되고 있어 2025년 441억 1,000만 달러에서 확대해, 2031년에는 627억 3,000만 달러에 이를 것으로 예측됩니다.
2026년부터 2031년까지의 연평균 성장률(CAGR)은 6.04%를 나타낼 전망입니다.
본 보고서는 발생원별(가정, 상업, 산업, 의료 등), 서비스 유형별(수집, 운송, 선별·분리 등), 폐기물 유형별(도시 고형 폐기물, 유해 산업 폐기물, 전자 폐기물, 플라스틱 등), 지역별(나이지리아, 남아프리카공화국, 이집트,케냐, 기타 아프리카 국가)별로 분류되어 있습니다. 시장 전망은 금액(달러) 기준으로 제시되어 있습니다.
아프리카 폐기물 관리 시장 동향 및 인사이트
도시 인구 증가로 인해 일반 폐기물 발생량이 증가하고 있습니다.
아프리카 도시에서는 매년 약 2,200만 명의 신규 주민이 증가하고 있으며, 이로 인해 가정 내 소비량과 일일 폐기물 발생량이 증가하고 있습니다. 라고스시만 해도 하루에 13,000-14,000톤의 폐기물이 발생하고 있지만, 공식적인 재활용을 통한 자원 회수율은 고작 0.37%에 그치고 있어 인프라의 심각한 부족이 드러나고 있습니다. 수거 차량 체계가 수요를 따라가지 못해, 지자체는 업무를 외부에 위탁하는 한편 중계 스테이션 및 자원 회수 시설에 대한 민간 투자를 유치하고 있습니다. 도시 지역에 집중되는 폐기물 흐름으로 인해 1톤당 처리 비용이 낮아져, 폐기물 발전(WtE) 및 분리 수거 플랜트의 사업 수익성이 향상되고 있습니다. 따라서 인구 동향에 비추어 볼 때, 2030년을 훨씬 넘어서도 도시 고형 폐기물(MSW)이 아프리카 폐기물 관리 시장의 핵심 축으로 남아 있을 것입니다.
재활용 목표 상향 및 EPR 체계를 위한 정부의 이니셔티브
케냐의 2024년 EPR 규정은 생산자에게 사용 후 제품의 회수 및 재활용 비용을 부담할 것을 의무화하고 있으며, 이는 남아프리카공화국의 ‘국가 환경 관리 폐기물법’에 기반한 의무화 제도를 반영한 것입니다. 이집트에서는 비공식 수거업자와 인가받은 처리업자를 연결하는 지속 가능한 재활용 이니셔티브가 전개되고 있으며, 생계 수단을 확보하는 동시에 재료의 품질 향상을 도모하고 있습니다. 규정 준수 비용 증가로 인해 재활용은 자발적인 프로그램에서 법적으로 강제되는 의무로 전환되고 있으며, 브랜드 소유자는 인증 사업자와의 장기 서비스 계약 체결을 서둘러야 하는 상황에 처해 있습니다. 이러한 의무화로 인해 플라스틱, 금속, 전자 폐기물의 재활용 시설로 공급되는 원자재량은 꾸준히 증가하고 있으며, 이는 아프리카 폐기물 관리 시장 전체의 수익을 뒷받침하고 있습니다.
부족한 매립 규제 및 집행
동아프리카 폐기물의 90% 이상은 여전히 노천 매립지에 버려지고 있으며, 지하수를 위협하는 메탄 가스와 침출수를 방출하고 있습니다. 아디스아바바의 레피 매립지만 해도 검사 없이 폐기물을 수용하고 있지만, 이 도시의 폐기물 중 공식적으로 수거되는 비율은 고작 65%에 불과합니다. 규제 집행이 미흡하기 때문에 무허가 운송업자들은 입구 통행료를 회피함으로써 규정을 준수하는 사업자의 가격보다 낮은 가격을 제시하고, 적절하게 설계된 매립지의 경제성을 훼손하고 있습니다. 통합된 검사 체계가 없다면, 지자체는 운영 비용을 회수할 수 없고, ‘오염자 부담 원칙’을 집행할 수도 없어, 아프리카 폐기물 관리 시장 전체의 처리 인프라 현대화가 지연될 것입니다.
부문 분석
2025년에는 도시 지역으로의 인구 유입에 따라 가계 소비가 확대됨에 따라, 가정 쓰레기 부문이 아프리카 폐기물 관리 시장 점유율의 60.45%를 차지했습니다. 한편, 상업 폐기물의 처리량은 쇼핑몰과 사무실의 확대로 인해 정기적인 수거 및 안전한 문서 파기에 대한 수요가 증가하고 있는 것을 배경으로 연평균 성장률(CAGR) 8.52%를 나타낼 것으로 예측됩니다. 소매 체인들은 EPR(생산자 책임)에 따른 회수 의무를 이행하기 위해 다년 계약을 체결하고 있으며, 이를 통해 통합 서비스 제공업체에게는 예측 가능한 처리량이 확보되고 있습니다. 산업 폐기물 배출업체들은 특히 남아프리카공화국에서 유해 폐기물 규제가 강화됨에 따라 인가받은 처리 파트너에 대한 의존도가 높아지고 있습니다. 의료 폐기물 또한 의료 분야에 대한 투자 확대에 따라 증가하고 있으며, 인증된 소각 업체에게 높은 수익률을 보장하는 틈새 시장을 형성하고 있습니다.
아프리카의 폐기물 관리 시장은 다양한 원료의 혜택을 받고 있습니다. 인프라 예산 증가에 따라 건설 및 해체 잔재물이 늘어나는 한편, 도시 주변 지역에서는 농업 잔재물이 바이오가스 생산의 기회를 제공합니다. 아프리카 여러 국가에서 전개되고 있는 베올리아의 다원형 서비스 모델은 주거 및 상업 계약을 결합함으로써 처리량과 수익성이 높은 특수 폐기물의 균형을 맞추는 가치를 입증하고 있습니다. 플라스틱 수거 분야에서는 비공식 네트워크가 여전히 중요한 역할을 하고 있지만, 표준화된 안전 교육과 모바일 결제를 통한 투명성을 제공하는 프랜차이즈 제도를 통해 공식 수거 업체들이 이러한 네트워크를 흡수하기 시작하고 있습니다.
기타 혜택:
- Excel 형식 시장 예측(ME) 시트
- 3개월간의 애널리스트 지원
자주 묻는 질문
목차
제1장 서론
제2장 분석 방법
제3장 주요 요약
제4장 시장 구도
제5장 시장 규모 및 성장률 예측
제6장 경쟁 구도
제7장 시장 기회와 향후 전망
JHS 26.09.09According to Mordor Intelligence, the Africa waste management market size in 2026 is estimated at USD 46.77 billion, growing from 2025 value of USD 44.11 billion with 2031 projections showing USD 62.73 billion, growing at 6.04% CAGR over 2026-2031.
This report is Segmented by Source (Residential, Commercial, Industrial, Medical, and More), by Service Type (Collection, Transportation, Sorting & Segregation, and More), by Waste Type (Municipal Solid, Industrial Hazardous, E-Waste, Plastic, and More), and by Geography (Nigeria, South Africa, Egypt, Kenya, Rest of Africa). The Market Forecasts are Provided in Terms of Value (USD).
Africa Waste Management Market Trends and Insights
Rising Urban Population Driving Municipal Solid Waste Volumes
Africa's cities gain roughly 22 million new residents every year, elevating household consumption and daily waste flows. Lagos alone generates 13,000-14,000 tons of refuse each day, yet formal recycling diverts just 0.37%, underscoring severe infrastructure gaps. Collection fleets struggle to keep pace, prompting municipalities to outsource operations and invite private investment in transfer stations and material-recovery facilities. Concentrated urban waste streams lower per-ton processing costs, improving project economics for WtE and sorting plants. Demographic trends will therefore keep municipal solid waste (MSW) the anchor of the Africa waste management market well beyond 2030.
Government Push for Higher Recycling Targets & EPR Frameworks
Kenya's 2024 EPR regulations oblige producers to finance end-of-life collection and recycling, mirroring South Africa's mandatory schemes under the National Environmental Management Waste Act. Egypt has rolled out a sustainable recycling initiative that links informal pickers to licensed processors, raising material quality while preserving livelihoods. Compliance costs are shifting recycling from voluntary programs to legally enforced obligations, pushing brand owners to sign long-term service contracts with certified operators. These mandates steadily enlarge feedstock volumes for plastic, metal, and e-waste recycling facilities, bolstering revenues across the Africa waste management market.
Weak Landfill Regulation & Enforcement
More than 90% of East Africa's waste still winds up in open dumps, releasing methane and leachate that threaten groundwater. Addis Ababa's Repi site alone receives wastes unchecked, yet only 65% of the city's refuse is formally collected. Non-enforcement allows unlicensed haulers to undercut compliant operators by dodging gate fees, eroding the economics of engineered landfills. Without uniform inspection regimes, municipalities cannot recover operating costs or enforce polluter-pays principles, delaying modernization of disposal infrastructure across the Africa waste management market.
Other drivers and restraints analyzed in the detailed report include:
- Growing Investor Interest in Waste-to-Energy Projects
- Digitized Collection & Route-Optimization Platforms
- Capital Scarcity for Large-Scale Treatment Assets
For complete list of drivers and restraints, kindly check the Table Of Contents.
Segment Analysis
Residential streams secured 60.45% of the Africa waste management market share in 2025 as household consumption grew alongside urban migration. Commercial volumes, however, are projected to post an 8.52% CAGR, fueled by mall and office expansion that heightens demand for scheduled pickups and secure document destruction. Retail chains sign multi-year contracts to meet EPR take-back obligations, adding predictable tonnage for integrated service providers. Industrial generators confront tighter hazardous-waste regulations, particularly in South Africa, pushing them toward licensed disposal partners. Medical waste also rises with increased healthcare investment, creating a high-margin niche for certified incineration firms.
The Africa waste management market benefits from diverse feedstocks: construction and demolition debris escalates as infrastructure budgets climb, while agricultural residues present biogas opportunities in peri-urban zones. Veolia's multi-source service model across several African countries showcases the value of bundling residential and commercial contracts to balance volume with higher-yield specialty waste. Informal networks remain pivotal for plastics retrieval, yet formalized aggregators are beginning to absorb them via franchise schemes that deliver standardized safety training and mobile-payment transparency.
Complete Report Scope:
- By Source
- Residential
- Commercial (retail, office, etc.)
- Industrial
- Medical (Health and Pharmaceutical)
- Construction & Demolition
- Others (institutional, agricultural, etc)
- By Service Type
- Collection, Transportation, Sorting & Segregation
- Disposal / Treatment
- Landfill
- Recycling & Resource Recovery
- Incineration & Waste-to-Energy
- Others (Chemical Treatment, Composting, etc.)
- Others (Consulting, Audit & Training, etc.)
- By Waste Type
- Municipal Solid Waste
- Industrial Hazardous Waste
- E-waste
- Plastic Waste
- Biomedical Waste
- Construction & Demolition Waste
- Agricultural Waste
- Other Specialized Waste (radio active, etc)
- By Geography
- Nigeria
- South Africa
- Egypt
- Kenya
- Rest of Africa
List of Companies Covered in this Report:
- Averda
- EnviroServ
- Interwaste
- WasteMart
- Universal Recycling Company
- Desco
- PETCO
- The Glass Recycling Company
- Oricol Environmental Services
- WeCyclers
- The Waste Group
- SA Waste
- Veolia Africa
- SUEZ Recycling & Recovery Africa
- Biffa South Africa
- Mr Green Africa
- TakaTaka Solutions
- EcoPost
- Stericycle (MedWaste Africa)
- Dangote Recycling
Additional Benefits:
- The market estimate (ME) sheet in Excel format
- 3 months of analyst support
TABLE OF CONTENTS
1 Introduction
- 1.1 Study Assumptions & Market Definition
- 1.2 Scope of the Study
2 Research Methodology
3 Executive Summary
4 Market Landscape
- 4.1 Market Overview
- 4.2 Market Drivers
- 4.2.1 Rising urban population driving municipal solid waste volumes
- 4.2.2 Government push for higher recycling targets & EPR frameworks
- 4.2.3 Growing investor interest in waste-to-energy (WtE) projects
- 4.2.4 Digitised collection & route-optimisation platforms
- 4.2.5 Off-grid micro-pyrolysis for plastics-to-fuel in remote mines
- 4.3 Market Restraints
- 4.3.1 Weak landfill regulation & enforcement
- 4.3.2 Capital scarcity for large-scale treatment assets
- 4.3.3 Informal sector lock-in that deters formal private investment
- 4.3.4 Climate-linked insurance gaps for WtE plants
- 4.4 Value / Supply-Chain Analysis
- 4.5 Regulatory Landscape
- 4.6 Technological Outlook
- 4.7 Industry Attractiveness - Porter's Five Force Analysis
- 4.7.1 Threat of New Entrants
- 4.7.2 Bargaining Power of Suppliers
- 4.7.3 Bargaining Power of Buyers
- 4.7.4 Threat of Substitutes
- 4.7.5 Intensity of Competitive Rivalry
- 4.8 Logistics Infrastructure Insights
- 4.9 Startup & Innovation Spotlight
5 Market Size & Growth Forecasts (Value, In USD Billion)
- 5.1 By Source
- 5.1.1 Residential
- 5.1.2 Commercial (retail, office, etc.)
- 5.1.3 Industrial
- 5.1.4 Medical (Health and Pharmaceutical)
- 5.1.5 Construction & Demolition
- 5.1.6 Others (institutional, agricultural, etc)
- 5.2 By Service Type
- 5.2.1 Collection, Transportation, Sorting & Segregation
- 5.2.2 Disposal / Treatment
- 5.2.2.1 Landfill
- 5.2.2.2 Recycling & Resource Recovery
- 5.2.2.3 Incineration & Waste-to-Energy
- 5.2.2.4 Others (Chemical Treatment, Composting, etc.)
- 5.2.3 Others (Consulting, Audit & Training, etc.)
- 5.3 By Waste Type
- 5.3.1 Municipal Solid Waste
- 5.3.2 Industrial Hazardous Waste
- 5.3.3 E-waste
- 5.3.4 Plastic Waste
- 5.3.5 Biomedical Waste
- 5.3.6 Construction & Demolition Waste
- 5.3.7 Agricultural Waste
- 5.3.8 Other Specialized Waste (radio active, etc)
- 5.4 By Geography
- 5.4.1 Nigeria
- 5.4.2 South Africa
- 5.4.3 Egypt
- 5.4.4 Kenya
- 5.4.5 Rest of Africa
6 Competitive Landscape
- 6.1 Market Concentration
- 6.2 Strategic Moves
- 6.3 Market Share Analysis
- 6.4 Company Profiles (includes Global level Overview, Market level overview, Core Segments, Financials as available, Strategic Information, Products & Services, and Recent Developments)
- 6.4.1 Averda
- 6.4.2 EnviroServ
- 6.4.3 Interwaste
- 6.4.4 WasteMart
- 6.4.5 Universal Recycling Company
- 6.4.6 Desco
- 6.4.7 PETCO
- 6.4.8 The Glass Recycling Company
- 6.4.9 Oricol Environmental Services
- 6.4.10 WeCyclers
- 6.4.11 The Waste Group
- 6.4.12 SA Waste
- 6.4.13 Veolia Africa
- 6.4.14 SUEZ Recycling & Recovery Africa
- 6.4.15 Biffa South Africa
- 6.4.16 Mr Green Africa
- 6.4.17 TakaTaka Solutions
- 6.4.18 EcoPost
- 6.4.19 Stericycle (MedWaste Africa)
- 6.4.20 Dangote Recycling
7 Market Opportunities & Future Outlook
- 7.1 White-space & Unmet-need Assessment