
|
시장보고서
상품코드
2123285
확장 현실(XR) 시장 : 점유율 분석, 업계 동향과 통계, 성장 예측(2026-2031년)Extended Reality (XR) - Market Share Analysis, Industry Trends & Statistics, Growth Forecasts (2026 - 2031) |
||||||
 Mordor Intelligence
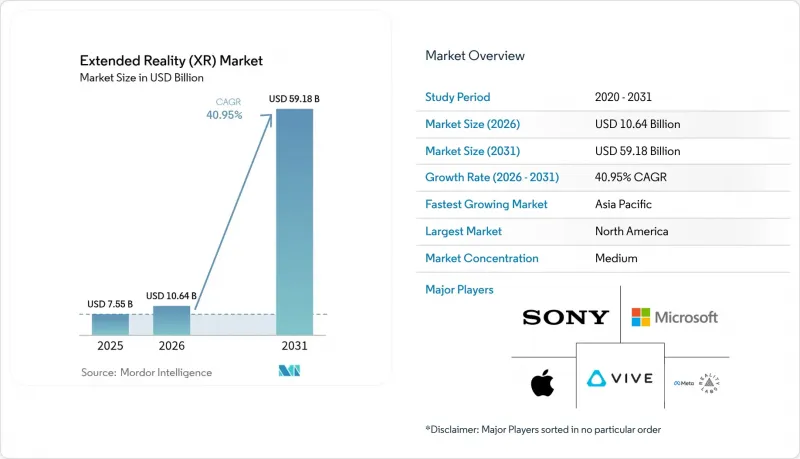
확장 현실(XR) 시장 규모는 2026년에 106억 4,000만 달러로 추정되고 있어 2025년 75억 5,000만 달러에서 확대해, 2031년에는 591억 8,000만 달러에 이를 것으로 예측됩니다.
2026년부터 2031년까지 연평균 성장률(CAGR) 40.95%로 성장할 것으로 전망됩니다.
본 보고서는 제공 형태(하드웨어, 소프트웨어, 서비스), 기기 유형(헤드마운트 디스플레이(유선형, 독립형), 헤드업 디스플레이 등), 기술(가상현실(VR), 증강현실(AR), 혼합현실(MR)), 최종 사용자 산업(게임 및 엔터테인먼트,헬스케어 및 생명과학 등)별로 세분화되어 있습니다. 시장 예측은 금액(달러) 기준으로 제시되어 있습니다.
전 세계 확장 현실(XR) 시장 동향 및 인사이트
5G 커버리지 확대와 엣지 컴퓨팅의 시너지 효과
에릭슨, AT&T, 드림스케이프, 퀄컴의 실증 실험에서 드러났듯이, 20밀리초 미만의 지연 시간 덕분에 유선 백팩형 PC를 사용하지 않고도 다중 사용자 VR 협업이 가능해졌습니다. 차이나 스틸(China Steel Corporation)의 5G 지원 가상 공장 견학에서는 85개의 생산 노드에서 수집된 실시간 데이터가 통합되어, 중공업 분야에서 그 가치가 입증되었습니다. DHL의 스마트 글라스 실증 실험은 실시간 피킹 안내를 통한 물류상의 이점을 보여주고 있습니다. 연산 처리가 네트워크 에지로 이동함에 따라 기기의 무게가 줄어들어 근무 중 착용 편의성이 향상되고 있습니다. 이에 따라 통신 사업자들은 몰입형 처리량을 유지하기 위해 사용자 반경 50km 이내에 마이크로 데이터센터를 설치하고 있습니다.
디지털 트윈 및 인더스트리 4.0 프레임워크에 XR 통합의 진전
페가트론의 ‘PEGAVERSE’는 NVIDIA Omniverse 상에 5개의 가상 공장을 구축하여 원격 진단 및 시나리오 테스트에 활용함으로써 가동 중단 시간과 출장 횟수를 줄이고 있습니다. BASF의 AR을 활용한 공장 계획에서는 센서 데이터와 몰입형 시각화를 연계하여 위험 구역을 효율적으로 파악하고 있습니다. 지멘스와 소니는 픽셀 단위의 정밀도로 설계 협업을 실현하는 엔지니어링용 헤드셋 ‘SRH-S1’을 4,750달러에 출시했습니다. OpenUSD를 통한 정렬을 통해 서로 다른 CAD, PLM, IoT 데이터를 단일 공간 레이어로 통합할 수 있게 됩니다. 이를 통해 플랫폼 벤더는 일회성 라이선스 비용이 아닌 구독형 시각화 서비스를 통해 수익화를 도모하고 있습니다.
고해상도 광학 시스템 및 프로세서의 높은 초기 비용
갈륨과 게르마늄공급 부족으로 인해 광학 부품 가격은 최대 25%나 급등하고 있습니다. Meta의 Reality Labs는 2020년 이후 600억 달러의 손실을 기록한 반면, 2024년 4분기에는 11억 달러 상당의 XR 하드웨어를 판매하여 수익성 문제가 부각되고 있습니다. 자본이나 명확한 ROI가 없는 중소기업들은 시장 진입을 주저하고 있습니다. 클라우드 렌더링을 활용한 XR은 기기의 경량화를 실현하지만, 지연이라는 단점이 발생하기 때문에 이용은 5G 통신 환경이 갖춰진 지역으로 제한됩니다.
부문별 분석
2024년에는 매출의 53.2%를 하드웨어가 차지했으나, 서비스 부문은 연평균 성장률(CAGR) 42.5%로 가장 빠르게 성장할 전망입니다. 기기, 소프트웨어, 관리형 지원을 결합한 구독 번들은 자본 지출(CAPEX)을 운영 비용(OPEX)으로 전환하는 것으로, 재무 부서의 지지를 받는 구조입니다. 이러한 변화는 공급업체에게는 예측 가능한 지속적인 수익을 가져다주고, 고객에게는 진입 장벽을 낮춰줍니다. 메타(Meta)의 플랫폼 전략 전환은 하드웨어 개편과 병행하여 기업용 구독 모델을 모색하고 있다는 점에서 이러한 추세를 여실히 보여줍니다.
관리형 훈련 및 시뮬레이션 서비스는 전문적인 컨텐츠가 필요하기 때문에 높은 단가로 제공됩니다. Vertex Solutions사만 해도 전 세계에 500대 이상의 군용 등급 시뮬레이터를 출하하며, 이 분야의 전문성을 돋보이게 하고 있습니다. 이러한 계약은 대개 수년에 걸쳐 체결되므로, 벤더는 더 높은 평생 가치(LTV)를 확보할 수 있습니다. 따라서 하드웨어 제조업체들은 정면으로 경쟁하기보다는 통합 업체와 제휴하고 있으며, 이는 서비스 주도형 확장 현실(XR) 시장이 성숙해 가고 있음을 반영합니다.
2024년에는 헤드마운트 디스플레이(HMD)가 매출의 42.7%를 차지했으나, 성장의 주축은 현재 연평균 성장률(CAGR) 43.1%를 목표로 하는 공간 디스플레이 및 홀로그래픽 디스플레이로 이동하고 있습니다. 공유 뷰잉 월은 개인용 헤드셋에서 볼 수 있는 위생 및 편의성상의 한계를 극복하여, 공동 기술 검토 및 고객 대상 시연을 지원합니다. 삼성의 ‘프로젝트 무한(Project Moohan)’은 산업용도로 최적화된 차세대 독립형 기기의 대표적인 사례입니다.
또한 안경이 필요 없는 솔루션도 등장하고 있으며, 디스턴스 테크놀로지스(Distance Technologies)는 차량 창문을 역동적인 혼합 현실의 캔버스로 바꾸기 위해 1,000만 유로(1,173만 달러)를 조달했습니다. 현장 유지보수에서는 스마트폰과 연동되는 핸드헬드 기기가 여전히 일반적이지만, 헤드업 디스플레이는 항공기나 자동차의 조종석에서 틈새 시장을 확보하고 있습니다. 장기적으로는 XPANCEO사의 프로토타입과 같은 스마트 콘택트렌즈가 확장 현실(XR) 시장을 ‘눈에 보이지 않는 웨어러블’ 영역으로 확장시킬 가능성이 있습니다.
지역별 분석
북미에서는 의료, 항공우주, 방위 분야의 꾸준한 조달로 인해 도입 대수가 증가하고 있습니다. Infinite Reality는 3억 5,000만 달러의 신규 자금 조달을 완료하고, Landvault를 4억 5,000만 달러에 인수했습니다. 이는 공간 컴퓨팅 플랫폼에 대한 투자자들의 낙관적인 전망을 뒷받침하는 것입니다. 미국 국방혁신단(DIU)은 공군 각 기지에 225대의 몰입형 트레이너를 도입하여 기업 내 XR 활용을 더욱 정착시켰습니다. 항공 분야의 대체 인증에 대한 규제적 지원으로 시뮬레이터의 충실도가 실제 조종석 기준에 가까워짐에 따라 장비 수주가 활발해지고 있습니다.
아시아태평양이 가장 빠르게 성장하고 있습니다. 중국에서만 2024년에 100건 이상의 VR 프로젝트가 시작되었습니다. 한국에서는 국내 거의 전역을 커버하는 5G 네트워크를 활용하여 삼성의 ‘Project Moohan’ 출시 준비가 진행되고 있습니다. 인도에서는 메타(Meta) 및 HCLTech와 협력한 민관 공동 인큐베이터가 풀뿌리 수준의 애플리케이션 개발자를 육성하고 있습니다. 광범위한 제조 거점이 지속적인 가치 입증(PoV) 파일럿을 뒷받침하고 있어, 아시아태평양은 하드웨어 양산 경제에서 매우 중요한 역할을 수행하고 있습니다. 유럽은 책임 있는 혁신의 거점으로서 입지를 다져가고 있습니다. 디스턴스 테크놀로지스(Distance Technologies)에 대한 1,000만 유로(1,173만 달러) 규모의 시드 펀딩은 자동차 등급의 혼합 현실(MR) 디스플레이에 대한 수요가 높음을 보여줍니다. BASF, 지멘스, 소니는 엄격한 CE 안전 기준을 준수하는 헤드셋 개발을 위해 협력하고 있습니다. EU의 개인정보 보호 규제는 데이터 처리 아키텍처를 형성하고 있으며, 세계 벤더들이 GDPR(EU 개인정보보호규정)에 부합하는 분석 모듈을 구축하도록 촉진하고 있습니다.
기타 혜택:
- 엑셀 형식 시장 예측(ME) 시트
- 3개월간의 애널리스트 지원
자주 묻는 질문
목차
제1장 서론
제2장 조사 방법
제3장 주요 요약
제4장 시장 구도
제5장 시장 규모와 성장 예측
제6장 경쟁 구도
제7장 시장 기회와 향후 전망
JHS 26.09.09According to Mordor Intelligence, extended reality market size in 2026 is estimated at USD 10.64 billion, growing from 2025 value of USD 7.55 billion with 2031 projections showing USD 59.18 billion, growing at 40.95% CAGR over 2026-2031.

This report is Segmented by Offering (Hardware, Software, Services), Device Type (Head-Mounted Displays (Tethered, Stand-Alone), Head-Up Displays and More), Technology (Virtual Reality (VR), Augmented Reality (AR), Mixed Reality (MR)), End User Industry (Gaming and Entertainment Healthcare and Life Sciences, and More). The Market Forecasts are Provided in Terms of Value (USD).
Global Extended Reality (XR) Market Trends and Insights
Expanding 5G Coverage and Edge Computing Synergy
Sub-20 ms latency now enables multi-user VR collaboration without tethered backpack PCs, as trials by Ericsson, AT&T, Dreamscape, and Qualcomm have shown. China Steel Corporation's 5G-enabled virtual factory tours integrate live data from 85 production nodes, proving value for heavy industry. DHL smart-glasses pilots illustrate logistics gains from real-time pick guidance. Device weight drops as compute moves to the network edge, boosting shift-length comfort. Telcos therefore place micro-data-centers within 50 km of users to sustain immersive throughput.
Increased Integration of XR into Digital Twin and Industry 4.0 Frameworks
Pegatron's PEGAVERSE builds five virtual factories on NVIDIA Omniverse for remote diagnostics and scenario testing, lowering downtime and travel. BASF's AR-enabled plant planning links sensor data with immersive visualization to streamline hazard identification. Siemens and Sony priced the SRH-S1 engineering headset at USD 4,750 to deliver pixel-accurate design collaboration. OpenUSD alignment lets disparate CAD, PLM, and IoT feeds merge into a single spatial layer. Platform vendors thus monetize subscription-based visualization rather than one-off license fees.
High Upfront Costs of High-Fidelity Optics and Processors
Gallium and germanium shortages have inflated optics prices by up to 25%. Meta's Reality Labs has accumulated USD 60 billion losses since 2020 while selling USD 1.1 billion in Q4 2024 XR hardware, underscoring profitability challenges. Smaller firms hesitate without capital or clear ROI. Cloud-rendered XR lightens devices yet introduces latency trade-offs that limit usage to well-served 5G zones.
Other drivers and restraints analyzed in the detailed report include:
- Rising Enterprise Demand for Immersive Remote Training
- Mass-Market Smartphone Integration of Spatial Sensors
- User Motion-Sickness and Ergonomic Limitations
For complete list of drivers and restraints, kindly check the Table Of Contents.
Segment Analysis
Hardware controlled 53.2% of revenue in 2024, yet Services is set to grow fastest at 42.5% CAGR. Subscription bundles that combine devices, software, and managed support convert capex into opex, a structure favored by finance departments. The shift drives predictable recurring income for suppliers and lowers barrier-to-entry for customers. Meta's platform pivot illustrates this movement, exploring enterprise-grade subscriptions alongside hardware refreshes.
Managed training and simulation services command premium rates thanks to specialized content needs. Vertex Solutions alone shipped more than 500 military-grade simulators worldwide, highlighting vertical expertise. As these contracts often span multi-year periods, vendors capture higher lifetime value. Hardware makers therefore partner with integrators rather than compete head-on, reflecting a maturing services-led Extended Reality market.
Head-Mounted Displays captured 42.7% revenue in 2024 but growth now shifts to Spatial and Holographic Displays, which head toward a 43.1% CAGR. Shared viewing walls overcome hygiene and comfort limits found in personal headsets, supporting collaborative engineering reviews and customer demonstrations. Samsung's Project Moohan exemplifies next-generation standalone units optimized for industrial deployment.
Glasses-free solutions also emerge, with Distance Technologies raising EUR 10 million (USD 11.73 million) to transform vehicle windows into dynamic mixed-reality canvases. Smartphone-tethered handheld devices remain common in field maintenance, while head-up displays secure niche positions in aviation and automotive cockpits. Longer term, smart contact lenses such as XPANCEO's prototype could push the Extended Reality market into invisible wearables.
Complete Report Scope:
- By Offering
- Hardware
- Software
- Services
- By Device Type
- Head-Mounted Displays (Tethered, Stand-alone)
- Head-Up Displays
- Handheld and Mobile Devices
- Others
- By Technology
- Virtual Reality (VR)
- Augmented Reality (AR)
- Mixed Reality (MR)
- By End-user Industry
- Gaming and Entertainment
- Healthcare and Life Sciences
- Industrial and Manufacturing
- Retail and E-commerce
- Education and Training
- Aerospace and Defense
- Architecture, Engineering and Construction
- Others
- By Geography
- North America
- United States
- Canada
- Mexico
- South America
- Brazil
- Argentina
- Rest of South America
- Europe
- United Kingdom
- Germany
- France
- Italy
- Spain
- Rest of Europe
- Asia-Pacific
- China
- Japan
- South Korea
- India
- Australia
- Rest of Asia-Pacific
- Middle East and Africa
- Middle East
- Saudi Arabia
- United Arab Emirates
- Turkey
- Rest of Middle East
- Africa
- South Africa
- Nigeria
- Egypt
- Rest of Africa
- Middle East
- North America
Geography Analysis
North America's installed base expands through steady healthcare, aerospace, and defense procurement. Infinite Reality closed USD 350 million in new capital and bought Landvault for USD 450 million, underscoring investor optimism in spatial computing platforms. The US Defense Innovation Unit fielded 225 immersive trainers across Air Force sites, further entrenching enterprise XR usage. Regulatory support for alternative certification in aviation spurs equipment orders as simulator fidelity approaches physical cockpit standards.
Asia-Pacific scales fastest. China alone launched more than 100 VR projects in 2024. South Korea readies Samsung's Project Moohan release, leveraging the country's near-universal 5G coverage. India's public-private incubator with Meta and HCLTech cultivates grassroots application developers. Wide manufacturing bases feed continuous proof-of-value pilots, making APAC pivotal to hardware volume economics. Europe positions itself as the responsible innovation hub. Distance Technologies' EUR 10 million (USD 11.73 million) seed illustrates appetite for automotive-grade mixed-reality surfaces. BASF, Siemens, and Sony collaborate on engineering headsets that comply with strict CE safety norms. The EU's privacy regime shapes data-handling architectures, influencing global vendors to build GDPR-ready analytics modules.
- Meta Platforms Inc. (Reality Labs)
- Sony Group Corp.
- Microsoft Corp.
- Apple Inc.
- HTC Corp. (Vive)
- Qualcomm Technologies Inc.
- Samsung Electronics Co. Ltd.
- Alphabet Inc. (Google XR)
- Pico Interactive Inc. (ByteDance)
- Varjo Technologies Oy
- Magic Leap Inc.
- Nvidia Corp.
- Unity Technologies Inc.
- Vuzix Corp.
- Lenovo Group Ltd.
- Snap Inc.
- Niantic Inc.
- Ultraleap Ltd.
- HP Inc.
- Immersion Corp.
Additional Benefits:
- The market estimate (ME) sheet in Excel format
- 3 months of analyst support
TABLE OF CONTENTS
1 INTRODUCTION
- 1.1 Study Assumptions and Market Definition
- 1.2 Scope of the Study
2 RESEARCH METHODOLOGY
3 EXECUTIVE SUMMARY
4 MARKET LANDSCAPE
- 4.1 Market Overview
- 4.2 Market Drivers
- 4.2.1 Expanding 5G coverage and edge computing synergy
- 4.2.2 Increased integration of XR into digital twin and Industry 4.0 frameworks
- 4.2.3 Rising enterprise demand for immersive remote-training
- 4.2.4 Mass-market smartphone integration of spatial sensors
- 4.2.5 Government funding for metaverse-related Rand
- 4.2.6 Adoption of open XR standards lowering vendor lock-in
- 4.3 Market Restraints
- 4.3.1 High upfront costs of high-fidelity optics and processors
- 4.3.2 User motion-sickness and ergonomic limitations
- 4.3.3 Data-privacy gaps in eye- and hand-tracking analytics
- 4.3.4 Fragmented content-authoring tool ecosystem
- 4.4 Supply-Chain Analysis
- 4.5 Regulatory Landscape
- 4.6 Technological Outlook
- 4.7 Porter's Five Forces
- 4.7.1 Bargaining Power of Suppliers
- 4.7.2 Bargaining Power of Consumers
- 4.7.3 Threat of New Entrants
- 4.7.4 Threat of Substitutes
- 4.7.5 Intensity of Competitive Rivalry
- 4.8 Assesment of Macroeconomic Factors on the market
5 MARKET SIZE AND GROWTH FORECASTS (VALUE)
- 5.1 By Offering
- 5.1.1 Hardware
- 5.1.2 Software
- 5.1.3 Services
- 5.2 By Device Type
- 5.2.1 Head-Mounted Displays (Tethered, Stand-alone)
- 5.2.2 Head-Up Displays
- 5.2.3 Handheld and Mobile Devices
- 5.2.4 Others
- 5.3 By Technology
- 5.3.1 Virtual Reality (VR)
- 5.3.2 Augmented Reality (AR)
- 5.3.3 Mixed Reality (MR)
- 5.4 By End-user Industry
- 5.4.1 Gaming and Entertainment
- 5.4.2 Healthcare and Life Sciences
- 5.4.3 Industrial and Manufacturing
- 5.4.4 Retail and E-commerce
- 5.4.5 Education and Training
- 5.4.6 Aerospace and Defense
- 5.4.7 Architecture, Engineering and Construction
- 5.4.8 Others
- 5.5 By Geography
- 5.5.1 North America
- 5.5.1.1 United States
- 5.5.1.2 Canada
- 5.5.1.3 Mexico
- 5.5.2 South America
- 5.5.2.1 Brazil
- 5.5.2.2 Argentina
- 5.5.2.3 Rest of South America
- 5.5.3 Europe
- 5.5.3.1 United Kingdom
- 5.5.3.2 Germany
- 5.5.3.3 France
- 5.5.3.4 Italy
- 5.5.3.5 Spain
- 5.5.3.6 Rest of Europe
- 5.5.4 Asia-Pacific
- 5.5.4.1 China
- 5.5.4.2 Japan
- 5.5.4.3 South Korea
- 5.5.4.4 India
- 5.5.4.5 Australia
- 5.5.4.6 Rest of Asia-Pacific
- 5.5.5 Middle East and Africa
- 5.5.5.1 Middle East
- 5.5.5.1.1 Saudi Arabia
- 5.5.5.1.2 United Arab Emirates
- 5.5.5.1.3 Turkey
- 5.5.5.1.4 Rest of Middle East
- 5.5.5.2 Africa
- 5.5.5.2.1 South Africa
- 5.5.5.2.2 Nigeria
- 5.5.5.2.3 Egypt
- 5.5.5.2.4 Rest of Africa
- 5.5.5.1 Middle East
- 5.5.1 North America
6 COMPETITIVE LANDSCAPE
- 6.1 Market Concentration
- 6.2 Strategic Moves
- 6.3 Market Share Analysis
- 6.4 Company Profiles (includes Global level Overview, Market level overview, Core Segments, Financials as available, Strategic Information, Market Rank/Share for key companies, Products and Services, and Recent Developments)
- 6.4.1 Meta Platforms Inc. (Reality Labs)
- 6.4.2 Sony Group Corp.
- 6.4.3 Microsoft Corp.
- 6.4.4 Apple Inc.
- 6.4.5 HTC Corp. (Vive)
- 6.4.6 Qualcomm Technologies Inc.
- 6.4.7 Samsung Electronics Co. Ltd.
- 6.4.8 Alphabet Inc. (Google XR)
- 6.4.9 Pico Interactive Inc. (ByteDance)
- 6.4.10 Varjo Technologies Oy
- 6.4.11 Magic Leap Inc.
- 6.4.12 Nvidia Corp.
- 6.4.13 Unity Technologies Inc.
- 6.4.14 Vuzix Corp.
- 6.4.15 Lenovo Group Ltd.
- 6.4.16 Snap Inc.
- 6.4.17 Niantic Inc.
- 6.4.18 Ultraleap Ltd.
- 6.4.19 HP Inc.
- 6.4.20 Immersion Corp.
7 MARKET OPPORTUNITIES AND FUTURE OUTLOOK
- 7.1 White-space and Unmet-Need Assessment