
|
시장보고서
상품코드
2123319
와이어 및 케이블 시장 : 점유율 분석, 업계 동향과 통계, 성장 예측(2026-2031년)Wire And Cable - Market Share Analysis, Industry Trends & Statistics, Growth Forecasts (2026 - 2031) |
||||||
 Mordor Intelligence
Mordor Intelligence에 의하면, 와이어 및 케이블 시장 규모는 2026년에 2,454억 4,000만 달러에 이르고, 2031년까지 3,157억 8,000만 달러에 이를 것으로 예측되며, CAGR은 5.17%로 추이할 전망입니다.
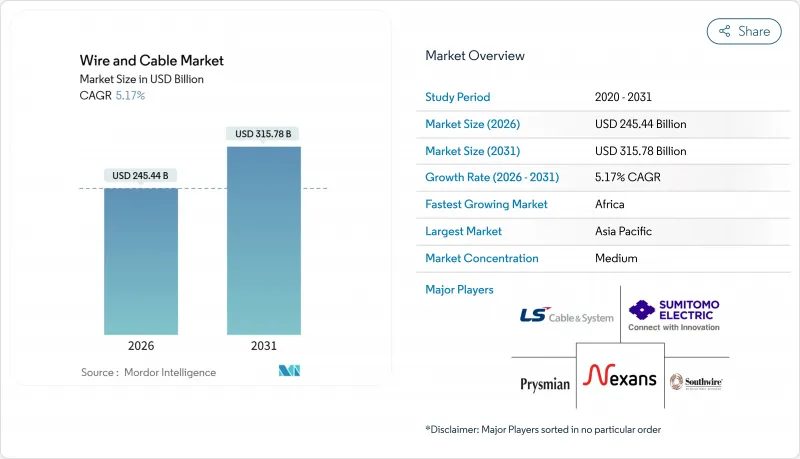
본 보고서는 전압(초고압·고압, 중압, 저압), 케이블 유형(전력 케이블, 광섬유 케이블 등), 도체 재료(구리, 알루미늄,광학 유리/폴리머), 매설 방식(가공, 지하, 해저), 최종 사용자 산업(건설, 전력 인프라, 통신·데이터센터 등), 지역(북미, 남미 등)별로 분류되어 있습니다. 시장 예측은 금액(달러) 기준으로 제시되어 있습니다.
세계 와이어 및 케이블 시장 동향 및 인사이트
북해 및 동아시아의 해상 풍력 발전용 고압 케이블 수요 급증
북해 및 발트해 지역의 해상 풍력 발전 송전선로 계획이 사상 최대를 기록함에 따라, 320킬로볼트 및 525킬로볼트 직류 케이블의 생산 일정이 앞당겨지고 있습니다. 전력 회사는 다국적 송전망 전체의 신뢰성을 확보하기 위해 국제전기표준회의(IEC) 62067 규격 준수를 규정하고 있습니다. Prysmian의 사우스캐롤라이나 공장용 3억 유로(3억 3,900만 달러) 규모의 계약과 NKT의 본홀름 에너지 아일랜드용 5억 유로(5억 6,500만 달러)가 넘는 송전 패키지 등,수주 실적을 통해 지역별 생산 능력이 확대되고 있습니다. 동아시아 수요는 유럽의 동향과 유사하며, LS케이블이 대만에서 4억 달러 수주와 타이한의 한국 내 부유식 해상 풍력 발전 프로젝트는 고전압 해저 케이블 공급 확보의 시급성을 여실히 보여주고 있습니다. 개발 사업자들은 100킬로미터를 초과하는 거리에서 교류 방식에서 직류 방식으로의 전환을 추진하고 있으며, 그 결과 1킬로미터당 절연재 소비량이 약 30% 증가하여 가교 폴리에틸렌공급 리스크가 높아지고 있습니다. 규제의 명확화와 설치 준비가 완료된 설계 카탈로그 덕분에 입찰 주기가 단축되어, 유럽 및 아시아의 Tier 1 공급업체들에게 기존 기업의 우위가 더욱 공고해지고 있습니다.
신흥 디지털 허브에서의 데이터센터 상호 연결의 급속한 확대
하이퍼스케일 사업자들은 싱가포르, 뭄바이, 두바이, 상파울루 전역에 장거리 광섬유를 자체적으로 구축하여 용도 지연 시간을 수 밀리초 단위로 단축하고 있습니다. 이는 인공지능(AI) 추론 및 실시간 거래 워크로드에 필수적인 조건입니다. 2024년에 가동을 시작한 총 길이 45,000킬로미터의 2Africa 루프는 유럽과 아프리카 간의 지연을 40% 줄였으며, 임대 용량보다 자사 소유 인프라가 경제적으로 더 우수함을 입증했습니다. Meta의 Echo 및 Bifrost 시스템은 각각 16쌍 이상의 광섬유를 갖추고 있어 채널 수의 새로운 기준을 수립하는 동시에, 혼잡한 병목 지점을 우회하는 다양한 경로를 제공합니다. NEOM이나 Khazna의 100메가와트급 아부다비 캠퍼스와 같은 중동의 메가 프로젝트에서는 가동률 99.999%를 달성하기 위해 마스터 플랜에 이중화된 육상 및 해저 경로가 포함되어 있습니다. 400기가비트 및 800기가비트 코히런트 광통신으로의 전환을 통해 비트당 비용이 절감되고, 다중 광섬유 케이블의 투자 자본 수익률(ROIC)이 향상되어 조기 수익 확보가 가능해집니다.
XLPE 수지 공급 병목 현상이 EHV 출력을 제한
220킬로볼트 이상의 구조물을 위해 특별 제작된 가교 폴리에틸렌(XLPE) 절연재는 주요 석유화학 기업들이 수익성이 높은 포장용 수지를 우선시하고 있어 원자재 공급 부족에 직면해 있으며, 2024년에는 리드 타임이 18개월로 늘어남에 따라유럽 전역의 해상 송전망에서 프로젝트 일정 변경을 불가피하게 만들고 있습니다. 프라이스미안(Prysmian)은 이탈리아 아르코 펠리체에 전용 컴파운딩 라인을 증설했으나, 업계 전체의 증설량은 여전히 증가하는 수요를 따라가지 못하고 있습니다. Borealis나 Dow 등 극소수의 인증 공급업체만이 525킬로볼트 직류 설계에 필요한 배합을 보유하고 있으며, IEC 규격에 따른 재료 인증에는 수년이 소요됩니다. 정격 전압이 높아질수록 1킬로미터당 절연체 사용량은 약 30% 증가하기 때문에 수지 부족이 더욱 심각해지고 있습니다. 슬러리 할당량을 사전 예약할 수 있는 개발사는 조기 통전 개시를 확보할 수 있지만, 대응이 늦어진 업체는 선박 재동원에 따른 비용 초과 위험을 감수해야 합니다.
부문 분석
35킬로볼트를 초과하는 초고압·고압 송전선은 2031년까지 연평균 성장률(CAGR) 7.91%로 성장하여, 와이어 및 케이블 시장 전체를 상회하는 성장세를 보일 것으로 예측됩니다. 저압 분야의 기존 기업들은 주로 주거용 및 상업용 회로를 기반으로 2025년에도 매출 점유율 46.12%를 차지하며 계속해서 지배적인 위치를 유지하고 있습니다. 그러나 중국과 유럽의 주택 착공이 둔화되면서 그 성장세는 완만해지고 있습니다. 개발업체들은 100킬로미터를 초과하는 연선 구간에서 고전압 직류(HVDC) 방식을 선호하여 채택하고 있으며, 600킬로볼트 시험실을 보유한 공급업체로 조달처가 이동하고 있습니다. 이러한 변화로 인해 진입 장벽이 높아지고 납기가 단축됨에 따라 기존 기업들의 우위가 더욱 공고해지고 있습니다.
저압 제품의 와이어 및 케이블 시장 점유율은 수량 기준으로는 여전히 큰 비중을 차지하고 있지만, 상품화(commoditization)로 인해 이익률은 압박을 받고 있습니다. 1킬로볼트에서 35킬로볼트에 이르는 중압 용도는 도시 지역 송전망이나 산업단지에서 안정적인 기반을 유지하고 있습니다. 초고압 분야의 발전은 가교 폴리에틸렌의 개량과 과도 부하 시 열 분포를 모델화하는 실시간 디지털 트윈 기술에 힘입고 있습니다. 중국과 인도는 재생에너지를 연안의 부하 센터로 수송하기 위한 800킬로볼트 송전선로 구축을 주도하고 있으며, 이를 위해서는 더 두꺼운 절연벽과 해상 설치를 간소화하는 공장 접합 섹션이 필요합니다.
광섬유 케이블은 5G 백홀, 클라우드 상호 연결 및 FTTH(Fiber-to-the-Home) 의무화에 힘입어 연평균 성장률(CAGR) 8.62%로 증가할 것으로 예상되며, 이는 와이어 및 케이블 시장 내에서 가장 강력한 성장세입니다. 전력 케이블은 2025년 매출의 38.27%를 차지하고 있지만, 북미 및 서유럽에서는 성숙한 성장 궤도에 접어들었습니다. 신호 및 제어용 케이블은 인더스트리 4.0 업그레이드의 물결을 타고 있는 반면, 영상 전송이 OTT 스트리밍으로 전환됨에 따라 동축 케이블 수요는 감소 추세를 보이고 있습니다.
광섬유 분야의 와이어 및 케이블 시장 규모는 400기가비트 코히런트 광통신에 대한 수요가 초저손실 유리를 필요로 함에 따라 더욱 확대되고 있습니다. 코닝(Corning)의 굽힘에 강한 단일 모드 광섬유는 기존 도관에 더 많은 가닥을 수용할 수 있게 함으로써 도관의 혼잡을 완화합니다. 전력 케이블의 혁신은 실시간 상태 모니터링을 위한 광섬유 센서 통합에 초점을 맞추고 있으며, 데이터와 전력을 하나의 피복에 통합하고 있습니다. 비트당 비용 감소에 더해, 새로운 해저 루프의 스펙트럼 공유 기술이 결합되어 대용량 경로에서 광섬유의 우위가 확고해지고 있습니다.
지역별 분석
아시아태평양은 중국의 초고압 회랑, 인도의 BharatNet 광섬유 추진 사업, 그리고 동남아시아의 도시화 추진에 힘입어 2025년 매출의 38.71%를 차지했습니다. 중국공급업체인 Hengtong과 ZTT는 대규모 광섬유 생산량을 활용하여 가격을 안정화하고 있는 반면, 인도의 기존 기업인 Polycab과 KEI는 증가하는 주거 수요에 대응하기 위해 국내 회선 확장을 추진하고 있습니다. 일본과 한국에서는 해상 풍력 발전과의 연계 및 송전망 업그레이드가 가속화되고 있는 반면, 호주에서는 장거리 송전 경로가 필요한 재생에너지 구역의 정비가 진행되고 있습니다.
유럽은 북해 및 발트해 지역의 활발한 해상 풍력 발전 움직임에 힘입어 여전히 주요 시장으로서의 지위를 유지하고 있습니다. Prysmian, Nexans, NKT는 라이온링크, 도거뱅크, 본홀름 에너지 아일랜드와 같은 프로젝트를 위해 수억 달러 규모의 수출 계약을 체결했습니다. 독일, 프랑스,스페인은 노후화된 송전 루프의 현대화를 추진하고 있는 반면, 이탈리아와 동유럽에서는 취약한 배전 설비의 개량이 진행되고 있습니다. C-Lion 1이나 Estlink 2와 같은 발트해에서의 파괴 공작 사건은 경로의 이중화와 감시의 중요성을 부각시키고 있습니다.
다자간 금융기관이 국경을 초월한 전력 풀과 각국의 전기화 계획을 자금 면에서 지원하는 가운데, 아프리카는 7.23%라는 지역 내 가장 높은 연평균 성장률(CAGR)을 나타낼 전망입니다. 서아프리카 전력 풀이나 동부 전력 고속도로는 번들형 자금 조달이 중·고압 송전선 수요를 어떻게 촉진하는지를 보여주는 좋은 사례입니다. 지급 주기나 규제상의 장벽은 여전히 높지만, 이를 극복하려는 의지를 가진 사업자들은 많은 경제권에서 전력 보급률이 50% 미만인 상황에서 선점 우위를 확보하고 있습니다.
북미에서는 고압 케이블 생산이 국내 복귀(리쇼어링) 추세를 보이고 있으며, Prysmian과 Nexans는 사우스캐롤라이나주 공장에 총 5억 달러 이상을 투자하여 대서양 연안의 해상 풍력 발전 임대 구역 근처에 거점을 마련하고 있습니다. 인플레이션 억제법(Inflation Reduction Act)의 인센티브가 국내 조달을 촉진하는 한편, 미국 및 캐나다의 송전망 운영 사업자들은 재생에너지 유입에 대비해 네트워크 현대화를 추진하고 있습니다. 남미에서는 브라질에 성장이 집중되고 있으며, 브라질 규제 당국은 2024년에 15,000킬로미터에 달하는 신규 송전선 건설을 승인했습니다. 중동에서는 구리 가격 급등을 완화하기 위해 알루미늄으로의 전환이 진행되고 있으며, 이는 NEOM과 같이 첨단 열가소성 절연 시스템이 필요한 메가 프로젝트와 발맞추고 있습니다.
기타 혜택:
- 엑셀 형식 시장 예측(ME) 시트
- 3개월간의 애널리스트 지원
자주 묻는 질문
목차
제1장 서론
제2장 조사 방법
제3장 주요 요약
제4장 시장 구도
제5장 시장 규모와 성장 예측
제6장 경쟁 구도
제7장 시장 기회와 향후 전망
JHS 26.09.09According to Mordor Intelligence, the wire and cable market size reached USD 245.44 billion in 2026 and is projected to attain USD 315.78 billion by 2031, advancing at a 5.17% CAGR.
This report is Segmented by Voltage (Extra/High, Medium, and Low), Cable Type (Power, Fiber-Optic, and More), Conductor Material (Copper, Aluminum, and Optical), Installation (Overhead, Underground, and Submarine), End-User (Construction, Power, Telecom/Data Centers, and More), and Geography (North America, South America, and More). The Market Forecasts are Provided in Terms of Value (USD).
Global Wire And Cable Market Trends and Insights
Surging Offshore Wind HV Cable Demand In North Sea And East Asia
A record pipeline of North Sea and Baltic Sea offshore wind export corridors is pulling forward manufacturing slots for 320-kilovolt and 525-kilovolt direct-current cables, with utilities stipulating International Electrotechnical Commission 62067 compliance to assure reliability across multinational grids. Contract awards, such as Prysmian's EUR 300 million (USD 339 million) commitment for its South Carolina facility and NKT's Bornholm Energy Island export package exceeding EUR 500 million (USD 565 million), are widening regional manufacturing capacity. East Asian demand mirrors Europe's trajectory; LS Cable's USD 400 million Taiwan awards and Taihan's floating wind scope in South Korea underscore the urgency to secure high-voltage submarine supply. Developers are migrating from alternating-current to direct-current topologies for distances exceeding 100 kilometers, resulting in approximately 30% higher insulation consumption per kilometer and intensifying the risk of cross-linked polyethylene supply. Regulatory clarity and ready-to-install design catalogs shorten tender cycles, reinforcing incumbent advantage for European and Asian tier-one suppliers.
Rapid Build-Out of Data Center Interconnects In Emerging Digital Hubs
Hyperscale operators are self-provisioning long-haul fiber across Singapore, Mumbai, Dubai, and Sao Paulo to shave milliseconds from application latency, a prerequisite for artificial-intelligence inference and real-time trading workloads. The 45,000-kilometer 2Africa loop, which went live in 2024, lowered Europe-Africa latency by 40%, validating the economics of owned infrastructure over leased capacity. Meta's Echo and Bifrost systems, each with more than 16 fiber pairs, set a new baseline for channel count while providing route diversity outside congested chokepoints. Middle East mega-projects, such as NEOM and Khazna's 100-megawatt Abu Dhabi campus, are incorporating redundant terrestrial and subsea paths into their master plans to achieve five-nines uptime. Transitioning to 400-gigabit and 800-gigabit coherent optics compresses the cost per bit, lifting the return on invested capital for high-fiber-count cables and enabling faster revenue capture.
XLPE Resin Supply Bottlenecks Limiting EHV Output
Cross-linked polyethylene insulation bespoke to 220 kilovolt and above constructions faces feedstock tightness as petrochemical majors favor higher-margin packaging resins, stretching lead times to 18 months in 2024 and forcing project rescheduling across European offshore grids. Prysmian has added a dedicated compounding line in Arco Felice, Italy; however, overall industry additions still trail incremental demand. Only a handful of qualified suppliers, such as Borealis and Dow, hold the formulations required for 525 kilovolt direct-current designs, and material qualification under IEC regimes is a multi-year exercise. Higher voltage ratings consume roughly 30% more insulation per kilometer, amplifying resin scarcity. Developers that can pre-book slurry allocations secure earlier energization dates, while laggards risk cost overruns tied to vessel re-mobilization.
Other drivers and restraints analyzed in the detailed report include:
- Accelerated Fiber-To-The-Home Roll-Outs In India and ASEAN
- Electrification of Automotive Harnesses For EV Platforms
- Copper Price Volatility Squeezing Contractor Margins In MENA
For complete list of drivers and restraints, kindly check the Table Of Contents.
Segment Analysis
Extra- and high-voltage lines above 35 kilovolts are expected to grow at a 7.91% CAGR to 2031, outperforming the overall wire and cable market. Low-voltage incumbents continue to dominate, with a 46.12% revenue share in 2025, primarily anchored in residential and commercial circuits. However, growth moderates as China and Europe cool housing starts. Developers prefer high-voltage direct-current topologies for links exceeding 100 kilometers, redirecting procurement to suppliers that possess 600-kilovolt test chambers. The shift elevates the barrier-to-entry thresholds and compresses delivery windows, reinforcing the incumbent's advantage.
The wire and cable market share for low-voltage products remains substantial in terms of units, but commoditization is squeezing margins. Medium-voltage applications, ranging from 1 kilovolt to 35 kilovolts, maintain a stable base in urban grids and industrial parks. Extra-high-voltage advances rest on cross-linked polyethylene enhancements and real-time digital twins that model thermal profiles during transient loads. China and India are pioneering 800 kilovolt corridors to shuttle renewables to coastal load centers, requiring thicker insulation walls and factory-jointed sections that simplify offshore installation.
Fiber-optic cables are projected to rise at an 8.62% CAGR, the strongest growth within the wire and cable market, driven by 5G backhaul, cloud interconnects, and fiber-to-the-home mandates. Power cables held 38.27% of 2025 revenue but face mature trajectories in North America and Western Europe. Signal and control variants ride the crest of Industry 4.0 upgrades, while coaxial demand tapers as video migrates to over-the-top streaming.
The wire and cable market size for fiber optics is expanding further as demand for 400-gigabit coherent optics requires ultra-low-loss glass. Corning's bend-insensitive single-mode fiber reduces duct congestion by allowing more strands to be squeezed into existing conduits. Power cable innovations focus on integrating fiber sensors for real-time condition monitoring, blending data and electricity in one sheath. Declining cost per bit, coupled with spectrum-sharing techniques on new subsea loops, cements fiber's ascendancy in high-capacity routes.
Complete Report Scope:
- By Voltage
- Extra- and High-Voltage (Greater Than 35 kV)
- Medium-Voltage (1-35 kV)
- Low-Voltage (Less Than 1 kV)
- By Cable Type
- Power Cable
- Fiber-Optic Cable
- Signal and Control Cable
- Coaxial and Data Cable
- By Conductor Material
- Copper
- Aluminum
- Optical Glass / Polymer
- By Installation
- Overhead
- Underground
- Submarine
- By End-User Vertical
- Construction - Residential
- Construction - Commercial
- Power Infrastructure (Utilities and Renewables)
- Telecommunications and Data Centers
- Oil and Gas and Petrochemicals
- Automotive and Mobility
- Industrial Manufacturing
- By Geography
- North America
- United States
- Canada
- Mexico
- South America
- Brazil
- Argentina
- Rest of South America
- Europe
- United Kingdom
- Germany
- France
- Spain
- Italy
- Rest of Europe
- Asia Pacific
- China
- India
- Japan
- Australia
- South Korea
- Rest of Asia-Pacific
- Middle East and Africa
- Middle East
- Saudi Arabia
- United Arab Emirates
- Turkey
- Rest of Middle East
- Africa
- South Africa
- Kenya
- Rest of Africa
- Middle East
- North America
Geography Analysis
Asia Pacific held 38.71% of 2025 revenue, buoyed by China's ultra-high-voltage corridors, India's BharatNet fiber drives, and Southeast Asia's urbanization push. Chinese suppliers Hengtong and ZTT utilize large-scale optical-fiber output to anchor pricing, while Indian incumbents Polycab and KEI expand domestic lines to meet rising residential demand. Japan and South Korea are escalating offshore wind tie-ins and grid upgrades, while Australia advances renewable energy zones that require long-distance transfer paths.
Europe remains a powerhouse due to North Sea and Baltic offshore wind activity. Prysmian, Nexans, and NKT lock in multi-hundred-million-dollar export packages for projects such as LionLink, Dogger Bank, and Bornholm Energy Island. Germany, France, and Spain modernize their aging transmission loops, while Italy and Eastern Europe replace their brittle distribution assets. Baltic Sea sabotage cases, such as C-Lion1 and Estlink 2, highlight the importance of redundant routing and monitoring.
Africa is forecast to post the strongest regional CAGR at 7.23% as multilateral lenders bankroll cross-border power pools and national electrification agendas. The West Africa Power Pool and Eastern Electricity Highway exemplify how bundled financing unlocks demand for medium- and high-voltage links. Payment cycles and regulatory hurdles remain steep, but players willing to navigate them secure first-mover advantages amid electrification levels under 50% in many economies.
North America witnesses reshoring of high-voltage production as Prysmian and Nexans commit more than USD 500 million combined to South Carolina factories, positioning themselves near Atlantic offshore wind leases. Inflation Reduction Act incentives stimulate domestic sourcing, while grid operators in the United States and Canada modernize networks for renewable influx. South America concentrates growth in Brazil where the regulator cleared 15,000 kilometers of new lines in 2024. The Middle East shifts toward aluminum to mitigate copper spikes, aligning with megaprojects such as NEOM that demand advanced thermoplastic insulation systems.
- Prysmian Group
- Nexans SA
- Sumitomo Electric Industries Ltd.
- LS Cable and System Ltd.
- Southwire Company LLC
- Fujikura Ltd.
- Furukawa Electric Co. Ltd.
- NKT A/S
- Belden Inc.
- CommScope Holding Company Inc.
- TE Connectivity Ltd.
- Corning Incorporated
- Leoni AG
- Amphenol Corporation
- HELUKABEL GmbH
- Jiangsu Zhongtian Technology Co. Ltd.
- Hengtong Optic-Electric Co. Ltd.
- Riyadh Cables Group Company
- Polycab India Ltd.
- KEI Industries Ltd.
- ZTT Group
Additional Benefits:
- The market estimate (ME) sheet in Excel format
- 3 months of analyst support
TABLE OF CONTENTS
1 INTRODUCTION
- 1.1 Study Assumptions and Market Definition
- 1.2 Scope of the Study
2 RESEARCH METHODOLOGY
3 EXECUTIVE SUMMARY
4 MARKET LANDSCAPE
- 4.1 Market Overview
- 4.2 Market Drivers
- 4.2.1 Surging Offshore Wind HV Cable Demand in North Sea and East Asia
- 4.2.2 Accelerated Fiber-To-The-Home Roll-Outs in India and ASEAN
- 4.2.3 Electrification of Automotive Harnesses for EV Platforms
- 4.2.4 Sub-Saharan Grid Interconnect Projects Unlocking Multilateral Funding
- 4.2.5 Rapid Build-Out of Data Center Interconnects in Emerging Digital Hubs
- 4.2.6 Corporate Net-Zero Procurement Driving Green Cable Materials Adoption
- 4.3 Market Restraints
- 4.3.1 XLPE Resin Supply Bottlenecks Limiting EHV Output
- 4.3.2 Copper Price Volatility Squeezing Contractor Margins in MENA
- 4.3.3 Vulnerability of Subsea Cables to Geopolitical Sabotage
- 4.3.4 Skilled Workforce Shortages in High-Voltage Cable Jointing
- 4.4 Industry Value Chain Analysis
- 4.5 Regulatory Landscape
- 4.6 Technological Outlook
- 4.7 The Impact of Macroeconomic Factors on the Market
- 4.8 Investment Analysis
- 4.9 Porter's Five Forces Analysis
- 4.9.1 Bargaining Power of Suppliers
- 4.9.2 Bargaining Power of Buyers
- 4.9.3 Threat of New Entrants
- 4.9.4 Threat of Substitutes
- 4.9.5 Intensity of Competitive Rivalry
5 MARKET SIZE AND GROWTH FORECASTS (VALUE)
- 5.1 By Voltage
- 5.1.1 Extra- and High-Voltage (Greater Than 35 kV)
- 5.1.2 Medium-Voltage (1-35 kV)
- 5.1.3 Low-Voltage (Less Than 1 kV)
- 5.2 By Cable Type
- 5.2.1 Power Cable
- 5.2.2 Fiber-Optic Cable
- 5.2.3 Signal and Control Cable
- 5.2.4 Coaxial and Data Cable
- 5.3 By Conductor Material
- 5.3.1 Copper
- 5.3.2 Aluminum
- 5.3.3 Optical Glass / Polymer
- 5.4 By Installation
- 5.4.1 Overhead
- 5.4.2 Underground
- 5.4.3 Submarine
- 5.5 By End-User Vertical
- 5.5.1 Construction - Residential
- 5.5.2 Construction - Commercial
- 5.5.3 Power Infrastructure (Utilities and Renewables)
- 5.5.4 Telecommunications and Data Centers
- 5.5.5 Oil and Gas and Petrochemicals
- 5.5.6 Automotive and Mobility
- 5.5.7 Industrial Manufacturing
- 5.6 By Geography
- 5.6.1 North America
- 5.6.1.1 United States
- 5.6.1.2 Canada
- 5.6.1.3 Mexico
- 5.6.2 South America
- 5.6.2.1 Brazil
- 5.6.2.2 Argentina
- 5.6.2.3 Rest of South America
- 5.6.3 Europe
- 5.6.3.1 United Kingdom
- 5.6.3.2 Germany
- 5.6.3.3 France
- 5.6.3.4 Spain
- 5.6.3.5 Italy
- 5.6.3.6 Rest of Europe
- 5.6.4 Asia Pacific
- 5.6.4.1 China
- 5.6.4.2 India
- 5.6.4.3 Japan
- 5.6.4.4 Australia
- 5.6.4.5 South Korea
- 5.6.4.6 Rest of Asia-Pacific
- 5.6.5 Middle East and Africa
- 5.6.5.1 Middle East
- 5.6.5.1.1 Saudi Arabia
- 5.6.5.1.2 United Arab Emirates
- 5.6.5.1.3 Turkey
- 5.6.5.1.4 Rest of Middle East
- 5.6.5.2 Africa
- 5.6.5.2.1 South Africa
- 5.6.5.2.2 Kenya
- 5.6.5.2.3 Rest of Africa
- 5.6.5.1 Middle East
- 5.6.1 North America
6 COMPETITIVE LANDSCAPE
- 6.1 Market Concentration
- 6.2 Strategic Moves
- 6.3 Market Share Analysis
- 6.4 Company Profiles (includes Global Level Overview, Market Level Overview, Core Segments, Financials as available, Strategic Information, Market Rank/Share for key companies, Products and Services, and Recent Developments)
- 6.4.1 Prysmian Group
- 6.4.2 Nexans SA
- 6.4.3 Sumitomo Electric Industries Ltd.
- 6.4.4 LS Cable and System Ltd.
- 6.4.5 Southwire Company LLC
- 6.4.6 Fujikura Ltd.
- 6.4.7 Furukawa Electric Co. Ltd.
- 6.4.8 NKT A/S
- 6.4.9 Belden Inc.
- 6.4.10 CommScope Holding Company Inc.
- 6.4.11 TE Connectivity Ltd.
- 6.4.12 Corning Incorporated
- 6.4.13 Leoni AG
- 6.4.14 Amphenol Corporation
- 6.4.15 HELUKABEL GmbH
- 6.4.16 Jiangsu Zhongtian Technology Co. Ltd.
- 6.4.17 Hengtong Optic-Electric Co. Ltd.
- 6.4.18 Riyadh Cables Group Company
- 6.4.19 Polycab India Ltd.
- 6.4.20 KEI Industries Ltd.
- 6.4.21 ZTT Group
7 MARKET OPPORTUNITIES AND FUTURE OUTLOOK
- 7.1 White-Space and Unmet-Need Assessment