

|
시장보고서
상품코드
2124513
유럽의 항공 연료 : 시장 점유율 분석, 업계 동향과 통계, 성장 예측(2026-2031년)Europe Aviation Fuel - Market Share Analysis, Industry Trends & Statistics, Growth Forecasts (2026 - 2031) |
||||||
 Mordor Intelligence
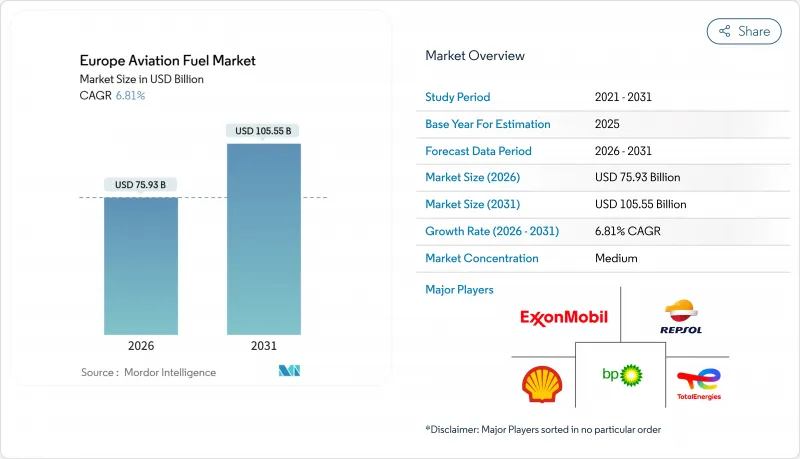
Mordor Intelligence에 의하면, 유럽의 항공 연료 시장 규모는 2026년에 759억 3,000만 달러로 추정되며, 예측 기간(2026-2031년)에 CAGR 6.81%로 확대되어 2031년에는 1,055억 5,000만 달러에 이를 전망입니다.
본 보고서는 연료 유형(기존 제트 연료, 지속 가능한 항공 연료, 항공용 가솔린), 항공기 유형(나로우드바디기, 와이드바디기, 리저널 제트 및 터보프롭기, 화물기),용도(민간 항공, 국방·군용 항공, 일반·비즈니스 항공), 지역(영국, 독일, 프랑스, 이탈리아, 스페인, 북유럽 국가, 러시아 및 기타 유럽)별로 분류되어 있습니다.
유럽 항공유 시장 동향 및 인사이트
코로나19 이후 항공 여객 수 회복
2024년, 유럽 항공사들은 11억 명의 승객을 수송하여 팬데믹 이전의 최고치를 넘어섰습니다. 저비용 항공사들은 억눌려 있던 여가 수요를 흡수하기 위해 운항 능력을 12% 확대했으나, 치열한 운임 경쟁으로 인해 주요 노선의 수익성은 압박을 받았습니다. 이에 반면, 기존 항공사들은 연료 소비량을 줄이기 위해 구형 와이드바디 기종의 퇴역을 진행하고, A321neo 및 737 MAX의 인도를 앞당겼습니다. 여객 수 증가와 연료 수요 간의 괴리로 인해, 분산된 공항 네트워크 전체의 연료 수요량을 정확하게 예측해야 하는 압박이 공급업체에 계속해서 가해지고 있습니다. 여객 수가 정상화를 이어가는 가운데, 유럽의 항공유 시장은 높은 탑승률의 혜택을 누리고 있지만, 항공사의 전체 밸류체인에서는 이익률 하락에 직면하고 있습니다.
EU 전역의 지속가능한 항공연료(SAF) 혼합 의무
‘ReFuelEU Aviation’ 규정이 2025년 1월에 발효되어 SAF 혼합 비율을 2%로 정하고, 2030년까지 6%, 2035년까지 20%로 단계적으로 높일 것을 의무화하고 있습니다. 규정을 위반할 경우 리터당 최대 5유로의 벌금이 부과되므로, 정유사나 유통업체는 가격이 비싸더라도 SAF를 확보할 수밖에 없는 상황입니다. 루프트한자가 쉘과 체결한 80만 톤 규모의 SAF 구매 계약이나 에어프랑스-KLM의 10% 조달 공약은 선구자들이 취한 헤지 전략의 한 예입니다. 그러나 원료 부족이 공급을 제약하고 있습니다. 유럽의 사용 후 식용유 공급량은 의무화된 수요의 극히 일부에 불과하여, 알코올-투-제트(ATJ)나 피셔-트로프스 공정에 대한 투자가 불가피한 상황입니다. 규제가 강화됨에 따라 유럽의 항공 연료 시장은 첨단 바이오연료의 확장성과 e-연료의 경제성에 점점 더 의존하게 될 것입니다.
원유 가격의 급격한 변동과 환율 리스크
2024년부터 2025년에 걸쳐 브렌트유 가격은 배럴당 70-95달러 사이에서 변동했습니다. 연료비는 라이언에어의 영업 지출의 38%까지 치솟아, 견고한 헤지 포지션을 확보하지 못한 항공사들의 예산을 압박했습니다. 동유럽 항공사들은 유로화에 대한 자국 통화의 가치 하락으로 어려움을 겪으며, 달러로 청구되는 연료 비용이 급증했습니다. 옵션 프리미엄의 급등으로 헤지 기간이 제한되면서, 소규모 항공사들은 현물 시장의 변동에 노출될 수밖에 없었습니다. 지속적인 변동성은 유럽 항공유 시장의 이익률을 압박하여, 재무 기반이 취약한 항공사들 간의 통합을 가속화할 가능성이 있습니다.
부문별 분석
지속 가능한 항공 연료(SAF)는 가장 빠른 성장세를 보이며, 2026-2031년 연평균 성장률(CAGR) 25.2%로 성장할 전망입니다. 그러나 2025년 소비량의 95.4%는 여전히 기존 등유가 차지하고 있어, 완전한 탈탄소화에 이르기까지 갈 길이 멀다는 점이 부각되고 있습니다. 쉘, 토탈에너지, 네스테는 2027년까지 유럽의 SAF 시설에 42억 유로를 할당했습니다. 네스테의 로테르담 복합 시설은 2028년까지 생산 능력 계획을 100만 톤으로 두 배로 늘렸습니다. 이는 제한된 사용 후 식용유 공급원에 의존하지 않도록, 동물성 폐유지 및 임업 잔여물을 활용하여 공급원을 다각화하기 위함입니다. EU 배출권 거래 제도(ETS)의 4단계에 따라 탄소 비용은 톤당 90유로로 인상되어 제트 연료 가격에 리터당 0.23유로가 추가됨에 따라, 항공사들에게 SAF 도입의 사업적 타당성이 더욱 명확해졌습니다.
2030년까지 1.2%로 설정된 합성 e-연료의 하위 할당량은 파워-투-리퀴드(P2L) 투자를 촉진하고 있지만, 현재 상업적으로 가동 중인 유럽의 공장은 3곳에 불과하며, 총 공급량은 1만 5,000톤 미만에 그치고 있습니다. Norsk e-Fuel사의 모쇼엔에 위치한 1만 톤 규모의 시설은 2025년에 첫 번째 배치를 납품하며 확장 가능성을 보여주었습니다. 기존 정유시설가 여전히 유통 인프라를 장악하고 있어 유럽의 항공 연료 시장에서 단기적인 우위를 공고히 하고 있습니다. 그러나 제재 강화와 기업의 ESG 목표에 힘입어 톤당 경제성이 높은 SAF에는 구조적인 수요 하한선이 확보되어 있습니다.
기타 혜택:
- 엑셀 형식 시장 예측(ME) 시트
- 3개월간의 애널리스트 지원
자주 묻는 질문
목차
제1장 서론
제2장 조사 방법
제3장 주요 요약
제4장 시장 구도
제5장 시장 규모와 성장 예측
제6장 경쟁 구도
제7장 시장 기회와 향후 전망
LSH 26.09.14According to Mordor Intelligence, the Europe aviation fuel market size is estimated at USD 75.93 billion in 2026, and is expected to reach USD 105.55 billion by 2031, at a CAGR of 6.81% during the forecast period (2026-2031).
This report is Segmented by Fuel Type (Conventional Jet Fuel, Sustainable Aviation Fuel, and Avgas), Aircraft Type (Narrow-Body, Wide-Body, Regional Jets and Turboprops, and Cargo/Freighters), Application (Commercial Airlines, Defense/Military Aviation, and General and Business Aviation), and Geography (United Kingdom, Germany, France, Italy, Spain, NORDIC Countries, Russia, and Rest of Europe).
Europe Aviation Fuel Market Trends and Insights
Rising Air-Passenger Traffic Rebound Post-COVID-19
European carriers moved 1.1 billion passengers in 2024, surpassing pre-pandemic peaks. Low-cost airlines lifted capacity by 12% to tap pent-up leisure demand, yet competitive fares compressed yields on trunk routes. Legacy operators responded by retiring older wide-bodies and accelerating A321neo and 737 MAX deliveries to cut fuel burn. The decoupling of passenger growth from fuel demand keeps pressure on suppliers to predict uplift volume accurately across a fragmented airport network. As traffic continues to normalize, the European aviation fuel market benefits from higher load factors but faces thinner margins across the airline value chain.
EU-Wide Sustainable Aviation Fuel Blending Mandates
The ReFuelEU Aviation regulation became effective in January 2025, requiring a 2% SAF share, rising to 6% by 2030 and 20% by 2035. Non-compliance triggers penalties of up to EUR 5 per liter, driving refiners and distributors to secure SAF even at premium prices. Lufthansa's 800,000-ton SAF offtake with Shell and Air France-KLM's 10% sourcing pledge illustrate early-mover hedging strategies. Feedstock scarcity, however, constrains supply; Europe's used-cooking-oil pool covers only a fraction of mandated demand, forcing investment in alcohol-to-jet and Fischer-Tropsch pathways. As mandates tighten, the European aviation fuel market will hinge increasingly on advanced biofuel scalability and e-fuel economics.
High Crude-Oil Price Volatility and FX Risk
Brent fluctuated between USD 70-95 per barrel during 2024-2025. Fuel costs climbed to 38% of Ryanair's operating outlays, squeezing budgets of carriers lacking robust hedging books. Eastern European airlines grappled with currency depreciation against the euro, inflating dollar-denominated fuel invoices. Elevated option premiums limited hedge tenors, exposing smaller operators to spot-market swings. Persistent volatility narrows margins in the European aviation fuel market and may accelerate consolidation among financially weaker carriers.
Other drivers and restraints analyzed in the detailed report include:
- Ramp-Up of Long-Haul Narrow-Body Fleets in Europe
- Boom in Cross-Border E-Commerce Air Cargo
- Capacity Bottlenecks in European SAF Feedstocks
For complete list of drivers and restraints, kindly check the Table Of Contents.
Segment Analysis
Sustainable aviation fuel posted the quickest advance, expanding at a 25.2% CAGR over 2026-2031. Yet conventional kerosene retained 95.4% of 2025 consumption, highlighting the distance to full decarbonization. Shell, TotalEnergies, and Neste earmarked EUR 4.2 billion for European SAF facilities through 2027. Neste's Rotterdam complex doubled capacity plans to 1 million tons by 2028, tapping waste animal fats and forestry residues to diversify away from limited used-cooking-oil pools. EU Emissions Trading System Phase 4 lifted carbon costs to EUR 90 per ton, adding EUR 0.23 per liter to jet-fuel prices and sharpening the airline business case for SAF.
The synthetic e-fuel sub-quota of 1.2% by 2030 spurs power-to-liquid investment, yet only three European plants are commercial today, jointly supplying below 15,000 tons. Norsk e-Fuel's 10,000-ton Mosjoen facility delivered its first batch in 2025, showcasing potential scalability. Conventional refineries still dominate distribution infrastructure, reinforcing their short-term hold on the European aviation fuel market. However, escalating penalties and corporate ESG targets ensure a structural demand floor for SAF despite higher per-ton economics.
Complete Report Scope:
- By Fuel Type
- Conventional Jet Fuel
- Sustainable Aviation Fuel (SAF)
- Avgas
- By Aircraft Type
- Narrow-body
- Wide-body
- Regional Jets and Turboprops
- Cargo/Freighters
- By Application
- Commercial Airlines
- Defense/Military Aviation
- General and Business Aviation
- By Geography
- United Kingdom
- Germany
- France
- Italy
- Spain
- NORDIC Countries
- Russia
- Rest of Europe
List of Companies Covered in this Report:
- BP plc
- Royal Dutch Shell plc
- TotalEnergies SE
- Repsol SA
- Exxon Mobil Corp.
- Gazprom Neft PJSC
- Neste Oyj
- OMV AG
- Eni SpA
- MOL Group
- Vitol Aviation
- LanzaJet Inc.
- World Energy LLC
- SkyNRG BV
- Preem AB
- PKN Orlen SA
- PKN Orlen - LOTOS Asfalt
- Air Total Aviation Services
- Air BP (bp Subsidiary)
- Gazpromneft-Aero
Additional Benefits:
- The market estimate (ME) sheet in Excel format
- 3 months of analyst support
TABLE OF CONTENTS
1 Introduction
- 1.1 Study Assumptions & Market Definition
- 1.2 Scope of the Study
2 Research Methodology
3 Executive Summary
4 Market Landscape
- 4.1 Market Overview
- 4.2 Market Drivers
- 4.2.1 Rising air-passenger traffic rebound post-COVID-19
- 4.2.2 EU-wide sustainable aviation fuel (SAF) blending mandates
- 4.2.3 Ramp-up of long-haul narrow-body fleets in Europe
- 4.2.4 Boom in cross-border e-commerce air cargo
- 4.2.5 Phase-4 EU-ETS cost pass-through to fuel-efficient fleets
- 4.2.6 Air-to-e-fuel PtL pilot plants reaching commercial scale
- 4.3 Market Restraints
- 4.3.1 High crude-oil price volatility and FX risk
- 4.3.2 Capacity bottlenecks in European SAF feedstocks
- 4.3.3 Airport hydrant-system conversion capex burden
- 4.3.4 Geopolitical disruptions to fuel logistics (Black Sea)
- 4.4 Supply-Chain Analysis
- 4.5 Regulatory Landscape
- 4.6 Technological Outlook
- 4.7 Porter's Five Forces
- 4.7.1 Bargaining Power of Suppliers
- 4.7.2 Bargaining Power of Buyers
- 4.7.3 Threat of New Entrants
- 4.7.4 Threat of Substitutes
- 4.7.5 Competitive Rivalry
5 Market Size & Growth Forecasts
- 5.1 By Fuel Type
- 5.1.1 Conventional Jet Fuel
- 5.1.2 Sustainable Aviation Fuel (SAF)
- 5.1.3 Avgas
- 5.2 By Aircraft Type
- 5.2.1 Narrow-body
- 5.2.2 Wide-body
- 5.2.3 Regional Jets and Turboprops
- 5.2.4 Cargo/Freighters
- 5.3 By Application
- 5.3.1 Commercial Airlines
- 5.3.2 Defense/Military Aviation
- 5.3.3 General and Business Aviation
- 5.4 By Geography
- 5.4.1 United Kingdom
- 5.4.2 Germany
- 5.4.3 France
- 5.4.4 Italy
- 5.4.5 Spain
- 5.4.6 NORDIC Countries
- 5.4.7 Russia
- 5.4.8 Rest of Europe
6 Competitive Landscape
- 6.1 Market Concentration
- 6.2 Strategic Moves (M&A, Partnerships, PPAs)
- 6.3 Market Share Analysis (Market Rank/Share for key companies)
- 6.4 Company Profiles (includes Global level Overview, Market level overview, Core Segments, Financials as available, Strategic Information, Products & Services, and Recent Developments)
- 6.4.1 BP plc
- 6.4.2 Royal Dutch Shell plc
- 6.4.3 TotalEnergies SE
- 6.4.4 Repsol SA
- 6.4.5 Exxon Mobil Corp.
- 6.4.6 Gazprom Neft PJSC
- 6.4.7 Neste Oyj
- 6.4.8 OMV AG
- 6.4.9 Eni SpA
- 6.4.10 MOL Group
- 6.4.11 Vitol Aviation
- 6.4.12 LanzaJet Inc.
- 6.4.13 World Energy LLC
- 6.4.14 SkyNRG BV
- 6.4.15 Preem AB
- 6.4.16 PKN Orlen SA
- 6.4.17 PKN Orlen - LOTOS Asfalt
- 6.4.18 Air Total Aviation Services
- 6.4.19 Air BP (bp Subsidiary)
- 6.4.20 Gazpromneft-Aero
7 Market Opportunities & Future Outlook
- 7.1 White-space & Unmet-need Assessment


