|
시장보고서
상품코드
2124517
태양에너지 : 시장 점유율 분석, 업계 동향과 통계, 성장 예측(2026-2031년)Solar Energy - Market Share Analysis, Industry Trends & Statistics, Growth Forecasts (2026 - 2031) |
||||||
 Mordor Intelligence
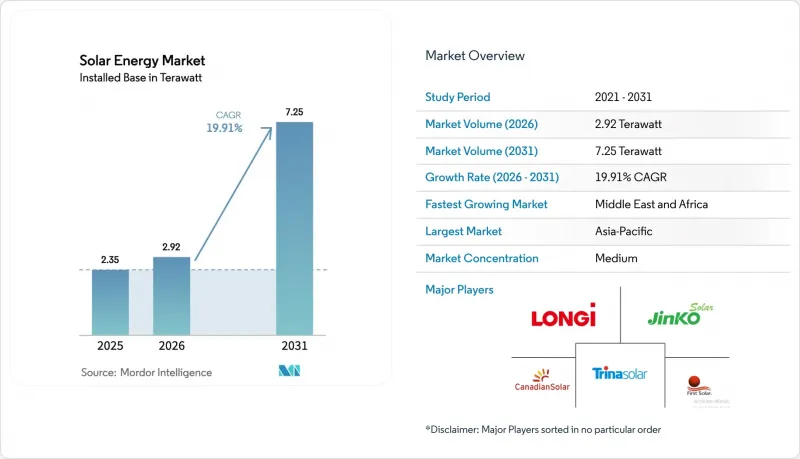
Mordor Intelligence에 의하면, 설치용량 기준 태양광발전 시장 규모는 2025년 2.35테라와트에서 2026년에는 2.92테라와트에 이르고, 2031년까지 7.25테라와트에 이를 것으로 예상되고 있어 2026-2031년 CAGR 19.91%를 기록할 전망입니다.
본 보고서는 기술별(태양광 발전 및 집광형 태양광 발전), 계통 연계 형태별(계통 연계형 및 독립형), 최종 사용자별(주거용, 상업 및 산업용 및 전력회사 규모), 지역별(북미, 유럽, 아시아태평양, 남미, 중동 및 아프리카)로 분류되어 있습니다. 시장 규모 및 전망은 설치 용량(GW) 기준으로 제시되어 있습니다.
전 세계 태양광 발전 시장 동향 및 인사이트
유틸리티 규모의 태양광 발전에서 비용 평등이 아시아에서의 조달을 가속화하고 있습니다.
2024년, 인도와 중국에서 진행된 벤치마크 입찰에서는 kW시당 0.03달러 미만의 가격으로 낙찰되어, 기존 석탄 화력 발전 요금을 최대 30% 밑돌았습니다. 2024년 중국에서 330GW, 인도에서 18GW라는 사상 최대의 연간 신규 도입량을 기록한 것은 이러한 경제성에 힘입은 급증세를 뒷받침합니다. 이에 대응해 각 성의 송전 사업자들은 서부의 자원 거점과 동부의 전력 수요지를 연결하는 초고압 송전선로 건설을 급속도로 추진했습니다. 동남아시아의 기획 담당자들은 태양광 발전의 균등화 발전 원가가 규제된 화력 발전 가격을 밑돌았다는 점을 감안하여, 2024년부터 2025년에 걸쳐 12GW 규모의 석탄 화력 발전 프로젝트를 중단하고, 자본을 태양광 발전과 축전지를 결합한 하이브리드 시스템으로 더욱 전환하고 있습니다.
IRA에 힘입은 미국의 국내 제조업 붐
IRA(인플레이션 억제법)에 근거한 제45X조의 생산 세액 공제에서는 셀에 대해 1와트당 0.04달러, 완성 모듈에 대해 1와트당 0.07달러가 지급되어, 비용 곡선을 현지 제조에 유리한 방향으로 기울게 했습니다. 2024년 말까지 미국의 모듈 생산 능력은 110개 프로젝트를 통해 4배인 42GW에 달할 전망이며, Qcells는 10여년만에 미국 최초로 폴리실리콘부터 모듈까지 완전히 통합된 생산 라인을 구축하기 위해 연방 정부로부터 14억 5,000만 달러의 대출 보증을 획득했습니다. 퍼스트 솔라(First Solar)는 오하이오주의 복합 시설을 6기가와트로 확장하고, 폴리실리콘 공급 병목 현상의 영향을 받지 않는 텔루륨-카드뮴 모듈을 활용하는 앨라배마주의 3.5기가와트 공장 착공에 들어갔습니다. 국내 폴리실리콘 생산량은 2024년 모듈 수요의 4분의 1에 불과했으나, 2032년 세액 공제 혜택이 만료되기 전에 선제적으로 이루어지는 설비 투자를 통해 이 격차는 줄어들 것으로 전망됩니다.
중국의 폴리실리콘 및 웨이퍼 공급망에 대한 과도한 의존
폴리실리콘 생산량의 80-90%, 웨이퍼 생산량의 95%를 중국이 차지하고 있으며, 그중 신장 위구르 자치구가 세계 생산 능력의 45%를 공급하고 있습니다. ‘위구르인 강제 노동 방지법’에 따라 2024년까지 미국 항구에서 3,800건 이상의 태양광 발전 관련 화물이 압류되어 납기일이 8-12주 지연되었습니다. 2024년에는 유럽에서도 관세 조사가 잇따르며 불확실성이 더욱 높아졌습니다. 중국의 신규 생산 능력이 가동됨에 따라 폴리실리콘 현물 가격은 2022년 kg당 35달러에서 2024년에는 kg당 6-8달러로 폭락하여, 많은 Tier 1 모듈 제조업체의 이익률을 압박했습니다. QCells의 조지아주 폴리실리콘 생산 라인이나 REC Silicon의 워싱턴주 생산 재개 등, 유럽과 미국공급원 다각화 노력은 2027년까지 중국 이외 지역 수요를 15% 미만만 충족시킬 것으로 전망됩니다.
부문별 분석
2025년, 태양광 발전은 태양에너지 시장 점유율의 99.7%를 차지했습니다. 2024년에 4.6% 하락한 균등화 발전 비용 덕분에, 많은 지역에서 태양광 발전은 피크용 가스 화력 발전이나 육상 풍력 발전을 능가하는 경쟁력을 확보하고 있습니다. 이 부문은 페로브스카이트-실리콘 탠덤 셀이 실험실에서 31.6%의 변환 효율을 달성하는 등 효율 향상이 원동력이 되어, 2030년까지 연평균 성장률(CAGR) 19.92%를 나타낼 것으로 예측됩니다. 다중 접합 설계를 통해 변환 효율이 40%를 넘어설 가능성이 있어, 공간이 제한된 옥상이나 차량 통합형과 같은 틈새 시장이 개척될 것입니다. 집광형 태양열 발전(CSP)의 점유율은 미미한 수준에 그치고 있지만, 이는 일사량이 많은 지역에서 태양광 발전과 축전지를 결합한 하이브리드 시스템의 균등화 발전 비용이 CSP의 절반 수준까지 낮아졌기 때문입니다.
실리콘 비용의 하락 추세로 인해 열탑형 및 트로프형 프로젝트 시장 규모는 계속 축소되고 있지만, CSP는 여전히 공정 열의 틈새 시장에서 활용되고 있습니다. 태양에너지 업계에서는 주류 제품 라인 전반에 걸쳐 효율을 25%에 가깝게 끌어올리기 위해 웨이퍼의 얇아짐, 메탈라이제이션이 필요 없는 접점, 그리고 백 컨택트 구조를 위한 연구 개발에 계속해서 주력하고 있습니다.
지역별 분석
2025년 시점에서 아시아태평양은 설치 용량의 64.5%를 계속 차지했습니다. 중국은 2024년에 330 GW를 추가하여 누적 설치 용량이 800 GW를 돌파했습니다. 성별로는 산둥성, 허난성, 장쑤성이 가장 높은 총 설치 용량을 기록했습니다. 인도는 90GW에 도달했는데, 이는 국내 제조 인센티브가 40GW 규모의 신규 공장 건설 확약을 뒷받침한 데 기인합니다. 일본, 한국, 호주 3개국에서는 합계 35GW가 추가로 증가했습니다. 이곳에서는 토지 부족과 송전망 병목 현상을 보완하기 위해 부유식, 아그리볼타익스, 하이브리드 모델이 활용되었습니다.
중동 및 아프리카의 태양광 발전 시장은 2031년까지 연평균 성장률(CAGR) 22.7%를 나타낼 것으로 전망됩니다. 사우디아라비아의 4GW 규모 ‘NEOM’,아랍에미리트의 2GW 규모 ‘알 다프라’ 프로젝트, 이집트의 3.6GW 규모 ‘수에즈 운하’ 계획이 이러한 상승 추세를 주도하고 있으며, 2024년까지 500만 가구를 돌파한 아프리카의 Off-grid 키트 급증도 이를 보완하고 있습니다.
북미에서는 2024년에 35GW가 도입되었으며, 그중 32GW를 미국이 차지했습니다. 미국에서는 IRA(인플레이션 억제법)에 따른 인센티브와 각 주의 재생에너지 포트폴리오 기준이 시너지 효과를 발휘했습니다. 텍사스주가 8.5GW로 1위를 차지했고, 캘리포니아주는 발전 제한이 증가했음에도 불구하고 6.2GW로 그 뒤를 이었습니다. 캐나다의 2.8GW 증가는 앨버타주의 상거래 시장이 뒷받침했습니다. 멕시코에서는 규제 측면의 불확실성으로 인해 도입 진척이 1.2GW 수준에서 정체되었습니다.
유럽에서는 2024년에 62GW가 추가되었습니다. 독일이 약 15GW로 1위를 차지했고, 스페인은 9GW에 육박했으나 계통 연계 지연으로 어려움을 겪었습니다. 또한 폴란드에서는 소규모 프로슈머(자가 소비 겸 발전자)에 힘입어 6GW가 도입되었습니다. EU의 ‘넷제로 산업법’은 2030년까지 30GW의 현지 생산을 목표로 하고 있지만, 2024년 말 기준으로 착공된 프로젝트는 고작 8GW에 그쳤습니다.
기타 혜택:
- 엑셀 형식 시장 예측(ME) 시트
- 3개월간의 애널리스트 지원
자주 묻는 질문
목차
제1장 서론
제2장 조사 방법
제3장 주요 요약
제4장 시장 구도
제5장 시장 규모와 성장 예측
제6장 경쟁 구도
제7장 시장 기회와 향후 전망
LSH 26.09.14According to Mordor Intelligence, the solar energy market size in terms of installed base is expected to increase from 2.35 Terawatt in 2025 to 2.92 Terawatt in 2026 and reach 7.25 Terawatt by 2031, growing at a CAGR of 19.91% over 2026-2031.
This report is Segmented by Technology (Solar Photovoltaic and Concentrated Solar Power), Grid Type (On-Grid and Off-Grid), End-User (Residential, Commercial and Industrial, and Utility-Scale), and Geography (North America, Europe, Asia-Pacific, South America, and Middle East and Africa). The Market Sizes and Forecasts are Provided in Terms of Installed Capacity (GW).
Global Solar Energy Market Trends and Insights
Utility-Scale PV Cost Parity Accelerating Procurement in Asia
Benchmark auctions in India and China cleared below USD 0.03 per kilowatt-hour in 2024, undercutting legacy coal tariffs by up to 30%. Record annual additions of 330 GW in China and 18 GW in India in 2024 testify to this economics-driven surge. Provincial grid operators responded by fast-tracking ultra-high-voltage transmission corridors linking western resource hubs to eastern load centers. Southeast Asian planners canceled 12 GW of coal projects during 2024-2025 after levelized solar costs fell beneath regulated thermal power prices, further redirecting capital toward photovoltaic-battery hybrids.
IRA-Driven Domestic Manufacturing Boom in the United States
Section 45X production credits under the IRA provide USD 0.04 per watt for cells and USD 0.07 per watt for finished modules, tilting the cost curve toward local fabrication. By end-2024, U.S. module capacity quadrupled to 42 GW across 110 projects, and Qcells secured a USD 1.45 billion federal loan guarantee to develop America's first fully integrated polysilicon-to-module line in more than a decade. First Solar enlarged its Ohio complex to 6 GW and broke ground on a 3.5 GW Alabama plant that leverages cadmium-telluride modules exempt from polysilicon bottlenecks. Although domestic polysilicon output met only one-quarter of 2024 module demand, front-loaded capital spending before the credit sunsets in 2032 should narrow this gap.
Supply-Chain Over-Reliance on Chinese Polysilicon & Wafers
China accounts for 80-90% of polysilicon and 95% of wafer output, with Xinjiang supplying 45% of global capacity. The Uyghur Forced Labor Prevention Act detained over 3,800 solar cargoes at U.S. ports through 2024, creating 8-12-week delivery delays. European tariff investigations followed in 2024, adding more uncertainty. Spot polysilicon prices collapsed from USD 35 per kg in 2022 to USD 6-8 per kg in 2024 as new Chinese capacity came online, crushing margins for many tier-one module makers. Western diversification efforts, including QCells' Georgia polysilicon line and REC Silicon's Washington restart, will still meet less than 15% of ex-China demand by 2027.
Other drivers and restraints analyzed in the detailed report include:
- Corporate PPA Demand from AI & Data Centers in Europe & North America
- Hybrid PV-Battery Projects Unlocking New Revenue Stacking Models
- Grid Congestion & Curtailment in High-Penetration Provinces
For complete list of drivers and restraints, kindly check the Table Of Contents.
Segment Analysis
Solar photovoltaic commanded 99.7% of the Solar Energy market share in 2025. Falling levelized costs, down 4.6% in 2024, place PV ahead of gas peakers and onshore wind in many regions. The segment is expected to grow at 19.92% CAGR through 2030, powered by efficiency gains such as perovskite-silicon tandem cells hitting 31.6% laboratory performance. Multi-junction designs could push conversion rates beyond 40%, opening space-constrained rooftops and vehicle-integrated niches. Concentrated Solar Power retained a marginal footprint because solar-plus-battery hybrids now achieve half its levelized cost in high-irradiance regions.
Silicon's cost trajectory keeps eroding the addressable space for thermal tower and trough projects, though CSP still serves process-heat niches. The Solar Energy industry continues to funnel R&D toward wafer-thinning, metallization-free contacts, and back-contact architectures to inch efficiencies closer to 25% across mainstream product lines.
Complete Report Scope:
- By Technology
- Solar Photovoltaic (PV)
- Concentrated Solar Power (CSP)
- By Grid Type
- On-Grid
- Off-Grid
- By End-User
- Utility-Scale
- Commercial and Industrial (C&I)
- Residential
- By Component (Qualitative Analysis)
- Solar Modules/Panels
- Inverters (String, Central, Micro)
- Mounting and Tracking Systems
- Balance-of-System and Electricals
- Energy Storage and Hybrid Integration
- By Geography
- North America
- United States
- Canada
- Mexico
- Europe
- United Kingdom
- Germany
- France
- Spain
- Nordic Countries
- Russia
- Rest of Europe
- Asia-Pacific
- China
- India
- Japan
- South Korea
- Malaysia
- Thailand
- Indonesia
- Vietnam
- Australia
- Rest of Asia-Pacific
- South America
- Brazil
- Argentina
- Colombia
- Rest of South America
- Middle East and Africa
- Saudi Arabia
- United Arab Emirates
- South Africa
- Egypt
- Rest of Middle East and Africa
- North America
Geography Analysis
Asia-Pacific retained 64.5% of installed capacity in 2025. China's cumulative fleet surpassed 800 GW after adding 330 GW in 2024, with Shandong, Henan, and Jiangsu registering the highest provincial totals. India reached 90 GW, catalyzed by domestic manufacturing incentives that underwrote 40 GW of new factory commitments. Japan, South Korea, and Australia collectively added another 35 GW, with floating, agrivoltaic, and hybrid models compensating for land scarcity and grid bottlenecks.
The Middle East and Africa Solar Energy market is projected to register a 22.7% CAGR through 2031. Saudi Arabia's 4 GW NEOM, the United Arab Emirates' 2 GW Al Dhafra project, and Egypt's 3.6 GW Suez Canal pipeline anchor this upswing, complemented by a surge in African off-grid kits that passed 5 million households by 2024.
North America installed 35 GW in 2024, dominated by 32 GW in the United States, where IRA incentives and state renewable portfolio standards converged. Texas led with 8.5 GW, while California followed at 6.2 GW despite rising curtailment. Canada's 2.8 GW addition leaned on Alberta's merchant market. Mexico's progress stalled at 1.2 GW amid regulatory uncertainty.
Europe added 62 GW in 2024. Germany led with about 15 GW, Spain followed with nearly 9 GW but wrestled with interconnection backlogs, and Poland installed 6 GW driven by small-scale prosumers. The EU's Net-Zero Industry Act set a target of 30 GW of localized manufacturing by 2030; however, only 8 GW of projects had broken ground by year-end 2024.
- Canadian Solar Inc.
- JinkoSolar Holding Co. Ltd
- Trina Solar Co. Ltd
- LONGi Green Energy Technology Co. Ltd
- First Solar Inc.
- JA Solar Technology Co. Ltd
- SunPower Corporation
- REC Solar Holdings AS
- Hanwha Q Cells Co. Ltd
- Risen Energy Co. Ltd
- Seraphim Solar System Co. Ltd
- Tata Power Solar Systems Ltd
- Sunrun Inc.
- Enphase Energy Inc.
- SMA Solar Technology AG
- Array Technologies Inc.
- Nextracker Inc.
- Siemens Energy (CSP)
- Abengoa SA
- BrightSource Energy Inc.
- ACCIONA Energia
- ENGIE SA
- ACWA Power
Additional Benefits:
- The market estimate (ME) sheet in Excel format
- 3 months of analyst support
TABLE OF CONTENTS
1 Introduction
- 1.1 Study Assumptions & Market Definition
- 1.2 Scope of the Study
2 Research Methodology
3 Executive Summary
4 Market Landscape
- 4.1 Market Overview
- 4.2 Market Drivers
- 4.2.1 Utility-Scale PV Cost Parity Accelerating Procurement in Asia
- 4.2.2 IRA-Driven Domestic Manufacturing Boom in the United States
- 4.2.3 Corporate PPA Demand from AI & Data Centers in Europe & North America
- 4.2.4 Hybrid PV-Battery Projects Unlocking New Revenue Stacking Models
- 4.2.5 Floating & Agrivoltaic Installations Opening Constrained-Land Markets (Japan, EU)
- 4.2.6 Green Hydrogen-Linked Solar Mega-Projects in Middle East
- 4.3 Market Restraints
- 4.3.1 Supply-Chain Over-reliance on Chinese Polysilicon & Wafers
- 4.3.2 Grid Congestion & Curtailment in High-Penetration Provinces (China, Spain)
- 4.3.3 Rising Interest-Rate Environment Impacting Residential Solar Economics (US, EU)
- 4.3.4 Scarcity of Rare-Earth Metals for High-Efficiency Thin-Films
- 4.4 Supply-Chain Analysis
- 4.5 Regulatory Outlook
- 4.6 Technological Outlook
- 4.7 Porter's Five Forces
- 4.7.1 Bargaining Power of Suppliers
- 4.7.2 Bargaining Power of Consumers
- 4.7.3 Threat of New Entrants
- 4.7.4 Threat of Substitutes
- 4.7.5 Intensity of Competitive Rivalry
- 4.8 Pricing Analysis - PV Module ASP Trends (USD/W)
5 Market Size & Growth Forecasts
- 5.1 By Technology
- 5.1.1 Solar Photovoltaic (PV)
- 5.1.2 Concentrated Solar Power (CSP)
- 5.2 By Grid Type
- 5.2.1 On-Grid
- 5.2.2 Off-Grid
- 5.3 By End-User
- 5.3.1 Utility-Scale
- 5.3.2 Commercial and Industrial (C&I)
- 5.3.3 Residential
- 5.4 By Component (Qualitative Analysis)
- 5.4.1 Solar Modules/Panels
- 5.4.2 Inverters (String, Central, Micro)
- 5.4.3 Mounting and Tracking Systems
- 5.4.4 Balance-of-System and Electricals
- 5.4.5 Energy Storage and Hybrid Integration
- 5.5 By Geography
- 5.5.1 North America
- 5.5.1.1 United States
- 5.5.1.2 Canada
- 5.5.1.3 Mexico
- 5.5.2 Europe
- 5.5.2.1 United Kingdom
- 5.5.2.2 Germany
- 5.5.2.3 France
- 5.5.2.4 Spain
- 5.5.2.5 Nordic Countries
- 5.5.2.6 Russia
- 5.5.2.7 Rest of Europe
- 5.5.3 Asia-Pacific
- 5.5.3.1 China
- 5.5.3.2 India
- 5.5.3.3 Japan
- 5.5.3.4 South Korea
- 5.5.3.5 Malaysia
- 5.5.3.6 Thailand
- 5.5.3.7 Indonesia
- 5.5.3.8 Vietnam
- 5.5.3.9 Australia
- 5.5.3.10 Rest of Asia-Pacific
- 5.5.4 South America
- 5.5.4.1 Brazil
- 5.5.4.2 Argentina
- 5.5.4.3 Colombia
- 5.5.4.4 Rest of South America
- 5.5.5 Middle East and Africa
- 5.5.5.1 Saudi Arabia
- 5.5.5.2 United Arab Emirates
- 5.5.5.3 South Africa
- 5.5.5.4 Egypt
- 5.5.5.5 Rest of Middle East and Africa
- 5.5.1 North America
6 Competitive Landscape
- 6.1 Market Concentration
- 6.2 Strategic Moves (M&A, Partnerships, PPAs)
- 6.3 Market Share Analysis (Market Rank/Share for key companies)
- 6.4 Company Profiles (includes Global level Overview, Market level overview, Core Segments, Financials as available, Strategic Information, Products & Services, and Recent Developments)
- 6.4.1 Canadian Solar Inc.
- 6.4.2 JinkoSolar Holding Co. Ltd
- 6.4.3 Trina Solar Co. Ltd
- 6.4.4 LONGi Green Energy Technology Co. Ltd
- 6.4.5 First Solar Inc.
- 6.4.6 JA Solar Technology Co. Ltd
- 6.4.7 SunPower Corporation
- 6.4.8 REC Solar Holdings AS
- 6.4.9 Hanwha Q Cells Co. Ltd
- 6.4.10 Risen Energy Co. Ltd
- 6.4.11 Seraphim Solar System Co. Ltd
- 6.4.12 Tata Power Solar Systems Ltd
- 6.4.13 Sunrun Inc.
- 6.4.14 Enphase Energy Inc.
- 6.4.15 SMA Solar Technology AG
- 6.4.16 Array Technologies Inc.
- 6.4.17 Nextracker Inc.
- 6.4.18 Siemens Energy (CSP)
- 6.4.19 Abengoa SA
- 6.4.20 BrightSource Energy Inc.
- 6.4.21 ACCIONA Energia
- 6.4.22 ENGIE SA
- 6.4.23 ACWA Power
7 Market Opportunities & Future Outlook
- 7.1 White-space & Unmet-Need Assessment