
|
시장보고서
상품코드
2125316
미국의 실시간 결제 : 시장 점유율 분석, 업계 동향 및 통계, 성장 예측(2026-2031년)United States Real Time Payments - Market Share Analysis, Industry Trends & Statistics, Growth Forecasts (2026 - 2031) |
||||||
 Mordor Intelligence
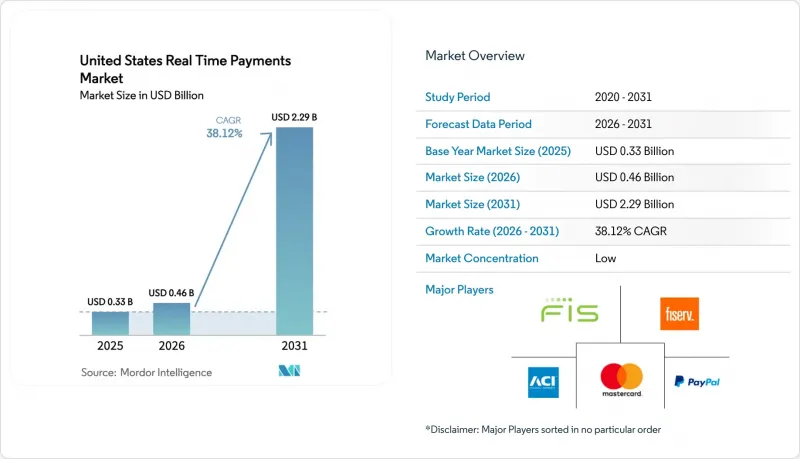
Mordor Intelligence에 의하면, 2026년 미국의 실시간 결제 시장 규모는 4억 6,000만 달러로 추정되고 2025년 3억 3,000만 달러에서 성장하여 2031년에는 22억 9,000만 달러에 이를 것으로 예측됩니다.
2026년부터 2031년까지의 연평균 성장률(CAGR)은 38.12%가 될 것으로 전망됩니다.
본 보고서는 거래 유형(개인 간(P2P), 개인에서 기업(P2B)), 구성 요소(플랫폼/솔루션, 서비스), 배포 방식(클라우드, On-Premise), 기업 규모(대기업, 중소기업), 최종 사용자 산업(소매 및 전자상거래,BFSI, 유틸리티·통신, 헬스케어, 기타)별로 분류되어 있습니다. 시장 전망은 금액(달러) 기준으로 제시되어 있습니다.
미국의 실시간 결제 시장 동향 및 인사이트
중견 은행 및 지역 은행에서의 TCH RTP 네트워크 확대
TCH의 펀딩 에이전트 모델을 통해 자산 규모가 10억 달러 미만인 지역 금융 기관은 기존 비용의 약 40% 수준으로 RTP에 참여할 수 있게 되어, 전국 규모의 은행과의 경쟁 조건이 균등화되고 있습니다. Bankers' Bank와 KeyBank는 이러한 확장성을 보여주고 있습니다. KeyBank만 해도 2025년에는 400만 건의 RTP 거래가 이루어졌으며, 적시 현금 흐름에 의존하는 중서부 제조업 고객에게 이점을 제공합니다. 2025년 2월 단일 결제 한도가 1,000만 달러로 상향 조정됨에 따라, 부동산 거래 결제나 공급업체 금융 등 B2B 활용 사례가 가능해졌습니다. 미국 은행 기관의 70% 이상이 지역 은행으로 분류되기 때문에 이 요인은 대상 거래량을 대폭 확대하고 미국의 실시간 결제 시장에 새로운 경쟁 역학을 가져올 것입니다.
연중무휴 24시간 은행 간 결제를 가능하게 하는 FedNow 서비스 개시
FedNow는 FRB의 마스터 계좌와 직접 결제를 수행하므로, 민간 결제 네트워크를 제한하던 사전 자금 조달 및 거래 상대방 리스크를 제거합니다. 클라우드 네이티브 설계로 인해 내결함성과 확장성이 확보되어, 중소 은행도 수 분기 대신 수 주 만에 서비스를 시작할 수 있게 됩니다. 2024년 말까지 900개 이상의 금융기관이 참가 등록을 마쳤으며, 이는 RTP 이용자 수의 거의 2배에 해당하여 정부 운영 시스템에 대한 높은 신뢰도를 보여줍니다. 재무부가 연방 기관에 2025년 9월까지 전자 결제로의 전환을 의무화해 확실한 수요가 예상됩니다. 또한, 2025년 여름에 시행된 100만 달러의 거래 한도로 인해 FedNow는 기존의 전신 송금으로 인한 수익을 잠식하는 입장에 서게 될 것입니다.
기존 핵심 뱅킹 시스템과의 통합 및 일괄 처리의 제약
미국 은행의 약 94%는 여전히 수십년전에 고안된 야간 일괄 처리형 코어 시스템에 의존하고 있어, 연중무휴 24시간 거래 처리는 기술적인 장벽이 되고 있습니다. 캔자스시티 연방준비은행의 추정에 따르면, 완전한 시스템 개편에는 수억 달러의 비용과 3-5년이 소요될 것으로 보이며, 지역 금융기관에게는 그 부담이 더욱 커집니다. 제3자 솔루션 제공업체들이 그 부담을 완화해 주고는 있지만, 통합의 복잡성이 높아 도입 속도는 여전히 더딘 편이며, 이는 미국의 실시간 결제 시장의 성장 궤도를 저해하고 있습니다.
부문별 분석
2025년, P2P 거래는 71.76%의 점유율을 차지하며 미국의 실시간 결제 시장을 휩쓸었습니다. Zelle만 해도 2024년 상반기에 17억 건, 총액 4,810억 달러의 송금을 처리했으며, 소비자들의 이용이 정착되었음이 확인되었습니다. 하지만 시장의 성장 동력은 P2B 분야입니다. 연평균 성장률(CAGR) 39.45%를 기록하는 P2B 부문은 기업들이 즉시 결제를 활용해 매출채권 회수 기간을 단축함에 따라 2031년까지 거래량 격차를 좁힐 것으로 예측됩니다. 이 부문은 미국 기업에 정체되어 있는 7,070억 달러의 자금을 활용함으로써 밸류체인의 유동성을 확보할 것입니다. 또한, FedNow에서 계획 중인 100만 달러의 지급 한도 설정으로 고액 청구서 지급도 가능해져 상업적 이용이 가속화될 전망입니다.
핀테크 게이트웨이 기업들은 청구서가 즉시 지급될 때 공급업체에 대한 인센티브를 자동 계산하는 동적 할인 도구를 추가하고 있으며, 이를 통해 P2B는 재무 부서에게 전략적으로 가치 있는 수단이 되고 있습니다. 스웨덴 중앙은행의 초기 데이터에 따르면, 구매자가 실시간 결제를 도입하면 중소 공급업체의 매출과 고용이 개선되는 것으로 나타났습니다. 중견 기업들이 자동화된 임베디드채무 결제에 대해 3%의 수수료를 지불할 의향을 보이고 있어, 수익화 가능성이 이 분야의 성장세를 더욱 뒷받침하고 있습니다.
2025년에는 지출의 63.28%를 플랫폼이 차지했으며, 은행들이 RTP 및 FedNow 결제망에 연결됨에 따라 초기 단계의 인프라 수요가 높다는 점이 부각되고 있습니다. 그러나 관리형 서비스(사기 분석, ISO 20022 변환, 재무 대시보드 등)는 연평균 성장률(CAGR) 33.9%로 플랫폼을 상회하는 성장이 예상됩니다. 은행들은 Fiserv나 Finastra와 같은 서비스 제공업체에 지속적인 업무를 아웃소싱함으로써 총 소유 비용을 절감하고 시장 출시 기간을 단축할 수 있을 것이라고 지적하고 있습니다.
규제 변경이 서비스로의 전환을 뒷받침하고 있습니다. ISO 20022로의 전환 기한으로 인해 금융 기관은 변환 게이트웨이를 확보해야 하는 상황에 놓여 있으며, 기업의 63%는 거래 은행이 메시지 변환을 처리해 주기를 기대하고 있습니다. 미국의 실시간 결제 시장이 성숙해짐에 따라, 차별화의 초점은 단순한 연결성에서 부가가치가 있는 오케스트레이션으로 이동하고 있으며, 서비스 벤더들은 시장 점유율 확대의 호기를 맞이하고 있습니다.
기타 혜택 :
- 엑셀 형식 시장 예측(ME) 시트
- 3개월간의 애널리스트 지원
자주 묻는 질문
목차
제1장 서론
제2장 조사 방법
제3장 주요 요약
제4장 시장 구도
제5장 시장 규모 및 성장 예측
제6장 경쟁 구도
제7장 시장 기회 및 향후 전망
KTH 26.09.14According to Mordor Intelligence, the US real time payments market size in 2026 is estimated at USD 0.46 billion, growing from 2025 value of USD 0.33 billion with 2031 projections showing USD 2.29 billion, growing at 38.12% CAGR over 2026-2031.
This report is Segmented by Transaction Type (Peer-To-Peer (P2P), Peer-To-Business (P2B)), Component (Platform / Solution, Services), Deployment (Cloud, On-Premise), Enterprise Size (Large Enterprises, Small and Medium Enterprises), End-User Industry (Retail and E-Commerce, BFSI, Utilities & Telecom, Healthcare, and More). The Market Forecasts are Provided in Terms of Value (USD).
United States Real Time Payments Market Trends and Insights
Expansion of TCH RTP network across mid-tier & community banks
TCH's funding-agent model allows community institutions with assets under USD 1 billion to join RTP at roughly 40% of prior cost, leveling the competitive field against national banks. Bankers' Bank and KeyBank illustrate scalability: KeyBank alone expects 4 million RTP transactions in 2025, benefiting Midwest manufacturing clients that rely on just-in-time cash flow. February 2025's hike of the single-payment cap to USD 10 million opens B2B use cases such as real-estate closings and supplier finance. As over 70% of US banking institutions fall in the community category, this driver meaningfully enlarges addressable volume and injects new competitive dynamics to the US real time payments market.
Launch of FedNow Service enabling 24X7X365 interbank settlement
FedNow settles directly against Fed master accounts, eliminating prefunding and counterparty risk that limit private rails. Cloud-native design gives resiliency and scalability, letting smaller banks go live in weeks rather than quarters. More than 900 institutions enrolled by end-2024-nearly double RTP's base-highlight trust in a government-operated system. Treasury's mandate that federal agencies migrate to electronic disbursements by September 2025 guarantees a committed demand corridor, while the planned USD 1 million transaction ceiling in summer 2025 positions FedNow to cannibalize traditional wire revenue.
Core banking legacy integration & batch-processing constraints
Roughly 94% of US banks still rely on overnight batch cores conceived decades ago, making 24X7 posting a technical hurdle. The Federal Reserve Bank of Kansas City estimates full modernizations cost hundreds of millions and require 3-5 years, a burden magnified for community lenders. Third-party enablers mitigate pain, yet high integration complexity continues to slow rollouts, tempering the growth trajectory of the US real time payments market.
Other drivers and restraints analyzed in the detailed report include:
- Instant payroll & earnings disbursement demand from gig-economy platforms
- Adoption of Request-for-Payment by US billers & utilities
- Escalating authorised push-payment (APP) fraud & scam risks
For complete list of drivers and restraints, kindly check the Table Of Contents.
Segment Analysis
P2P transactions dominated the US real time payments market with 71.76% share in 2025. Zelle alone processed 1.7 billion transfers worth USD 481 billion in H1 2024, affirming consumer uptake. That said, the P2B corridor is the market's growth engine. At a 39.45% CAGR, P2B is forecast to narrow the volume gap by 2031 as corporates use instant settlement to cut days-sales-outstanding. The segment tackles the USD 707 billion in US corporate trapped cash, unlocking supply-chain liquidity. FedNow's planned USD 1 million limit also enables high-value invoice payments, accelerating commercial use.
Fintech gateways are adding dynamic discount tools that auto-calculate supplier incentives when invoices are paid instantly, making P2B strategically valuable for treasury teams. Early data from the Swedish central bank suggests small suppliers experience improved sales and employment once buyers deploy real-time settlements. As middle-market firms display willingness to pay 3% service fees for automated payables, monetization potential reinforces momentum in this corridor.
Platforms accounted for 63.28% of spending in 2025, underlining up-front infrastructure demand as banks connect to RTP and FedNow rails. However, managed services-fraud analytics, ISO 20022 translation, treasury dashboards-are projected to outpace with a 33.9% CAGR. Banks cite lower total cost of ownership and faster time-to-market when outsourcing ongoing operations to enablers such as Fiserv and Finastra.
Regulatory change drives the tilt toward services. ISO 20022 migration deadlines push institutions to secure translation gateways, and 63% of corporates expect their banks to handle message conversion. As the US real time payments market matures, differentiation shifts from mere connectivity to value-added orchestration, positioning service vendors for share gains.
Complete Report Scope:
- By Transaction Type
- Peer-to-Peer (P2P)
- Peer-to-Business (P2B)
- By Component
- Platform / Solution
- Services
- By Deployment Mode
- Cloud
- On-Premise
- By Enterprise Size
- Large Enterprises
- Small and Medium Enterprises
- By End-User Industry
- Retail and E-Commerce
- BFSI
- Utilities and Telecom
- Healthcare
- Government and Public Sector
- Other End-user Industries
List of Companies Covered in this Report:
- ACI Worldwide Inc.
- Fidelity National Information Services Inc. (FIS)
- Fiserv Inc.
- Mastercard Incorporated
- Visa Inc.
- PayPal Holdings Inc.
- Worldpay LLC (FIS)
- Temenos AG
- Volante Technologies Inc.
- Montran Corporation
- The Clearing House Payments Company L.L.C.
- Jack Henry and Associates Inc.
- Finastra Group Holdings Ltd.
- Bottomline Technologies Inc.
- Square Inc. (Block)
- Apple Inc.
- Google LLC
- Early Warning Services LLC (Zelle)
- Ingo Money Inc.
- Ripple Labs Inc.
Additional Benefits:
- The market estimate (ME) sheet in Excel format
- 3 months of analyst support
TABLE OF CONTENTS
1 INTRODUCTION
- 1.1 Study Assumptions and Market Definition
- 1.2 Scope of the Study
2 RESEARCH METHODOLOGY
3 EXECUTIVE SUMMARY
4 MARKET LANDSCAPE
- 4.1 Market Overview
- 4.2 Market Drivers
- 4.2.1 Expansion of TCH RTP Network Across Mid-Tier and Community Banks
- 4.2.2 Launch of FedNow Service Enabling 24X7X365 Interbank Settlement
- 4.2.3 Instant Payroll and Earnings Disbursement Demand from Gig-Economy Platforms
- 4.2.4 Adoption of Request-for-Payment by U.S. Billers and Utilities
- 4.2.5 ISO 20022 and Open-API Integration Driving FinTech Partnerships
- 4.2.6 Merchant Push-to-Card / Instant Funding Programs Scaling in E-commerce
- 4.3 Market Restraints
- 4.3.1 Core Banking Legacy Integration and Batch-Processing Constraints
- 4.3.2 Escalating Authorised Push-Payment (APP) Fraud and Scam Risks
- 4.3.3 Absence of Universal Identity Directory Hindering Interoperability
- 4.3.4 Per-Transaction Limit Caps and Liquidity Management Concerns
- 4.4 Value Chain Analysis
- 4.5 Regulatory Outlook (FedNow operating rules, Reg E, UCC updates)
- 4.6 Technological Outlook (Cloud-native RTP hubs, ISO 20022, AI fraud-defence)
- 4.7 Porter's Five Forces Analysis
- 4.7.1 Bargaining Power of Suppliers
- 4.7.2 Bargaining Power of Buyers
- 4.7.3 Threat of New Entrants
- 4.7.4 Threat of Substitutes
- 4.7.5 Intensity of Competitive Rivalry
- 4.8 Evolution of the U.S. Payments Landscape
- 4.9 Key Trends Accelerating Cashless Transactions
- 4.10 Assessment of Macro Economic Trends on the Market
5 MARKET SIZE AND GROWTH FORECASTS (VALUES)
- 5.1 By Transaction Type
- 5.1.1 Peer-to-Peer (P2P)
- 5.1.2 Peer-to-Business (P2B)
- 5.2 By Component
- 5.2.1 Platform / Solution
- 5.2.2 Services
- 5.3 By Deployment Mode
- 5.3.1 Cloud
- 5.3.2 On-Premise
- 5.4 By Enterprise Size
- 5.4.1 Large Enterprises
- 5.4.2 Small and Medium Enterprises
- 5.5 By End-User Industry
- 5.5.1 Retail and E-Commerce
- 5.5.2 BFSI
- 5.5.3 Utilities and Telecom
- 5.5.4 Healthcare
- 5.5.5 Government and Public Sector
- 5.5.6 Other End-user Industries
6 COMPETITIVE LANDSCAPE
- 6.1 Market Concentration
- 6.2 Strategic Moves (MandA, product launches, bank enrollments)
- 6.3 Market Share Analysis
- 6.4 Company Profiles (includes Global-level Overview, Market-level Overview, Core Segments, Financials, Strategic Information, Market Rank/Share, Products and Services, Recent Developments)
- 6.4.1 ACI Worldwide Inc.
- 6.4.2 Fidelity National Information Services Inc. (FIS)
- 6.4.3 Fiserv Inc.
- 6.4.4 Mastercard Incorporated
- 6.4.5 Visa Inc.
- 6.4.6 PayPal Holdings Inc.
- 6.4.7 Worldpay LLC (FIS)
- 6.4.8 Temenos AG
- 6.4.9 Volante Technologies Inc.
- 6.4.10 Montran Corporation
- 6.4.11 The Clearing House Payments Company L.L.C.
- 6.4.12 Jack Henry and Associates Inc.
- 6.4.13 Finastra Group Holdings Ltd.
- 6.4.14 Bottomline Technologies Inc.
- 6.4.15 Square Inc. (Block)
- 6.4.16 Apple Inc.
- 6.4.17 Google LLC
- 6.4.18 Early Warning Services LLC (Zelle)
- 6.4.19 Ingo Money Inc.
- 6.4.20 Ripple Labs Inc.
7 MARKET OPPORTUNITIES AND FUTURE OUTLOOK
- 7.1 White-space and Unmet-need Assessment