|
시장보고서
상품코드
1852017
스포츠 애널리틱스 시장 : 시장 점유율 분석, 산업 동향, 통계, 성장 예측(2025-2030년)Sports Analytics - Market Share Analysis, Industry Trends & Statistics, Growth Forecasts (2025 - 2030) |
||||||
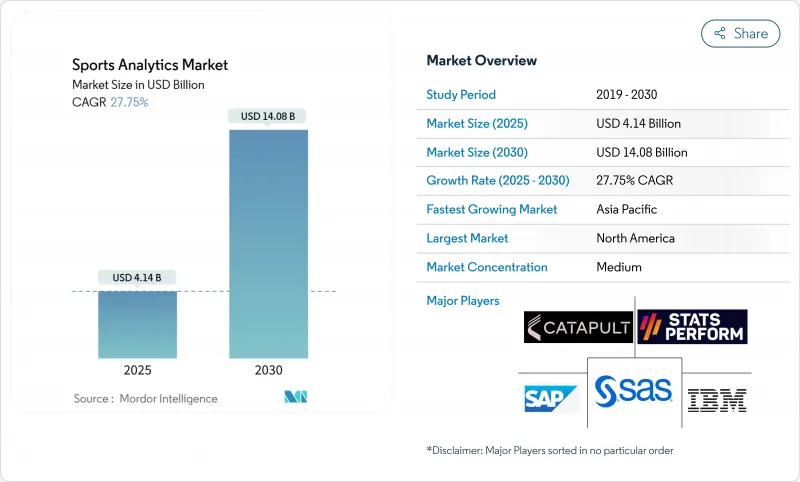
스포츠 애널리틱스 시장 규모는 2025년에 41억 4,000만 달러로 추정되고, 2030년에는 140억 8,000만 달러에 이를 것으로 예측되며, 2025-2030년 CAGR 27.75%로 성장이 전망됩니다.
확장에는 세 가지 보강력이 필요합니다. 보다 저렴한 센서, 탄력적인 클라우드 용량, 스포츠 베팅의 법적 프레임워크 확대입니다. 프랜차이즈 소유자는 현재 증거 기반 의사결정을 일상적인 위험 관리로 간주하므로 애널리틱스 예산은 실험 프로젝트가 아닌 영업 예측 항목으로 기록됩니다. 벤더의 통합이 가속화되는 이유는 클럽이 향후 컴플라이언스에 대한 노출을 줄이기 위해 프라이버시 관리가 성숙한 파트너를 선호하기 때문입니다. 계약 기간의 장기화는 경상 수익의 가시성을 높이고 분석이 광범위한 스포츠 기술 스택에서 필수적인 계층이 되었음을 보여줍니다.
세계 스포츠 애널리틱스 시장 동향 및 인사이트
IoT 센서가 가능하도록 실시간 추적
풀필드 무선 주파수 추적은 내셔널 축구 리그 회장에서 각 다운에 대해 선수 1인당 200개 이상의 위치 데이터를 획득하여 코칭 직원이 실시간 부하 지표를 부상 경감 전략으로 변환할 수 있게 되었습니다. 동일한 피드는 팬을 위한 증강현실 활성화에 전원을 공급하고 추가 하드웨어 지출 없이 새로운 스폰서십 재고를 생성합니다. 태그 가격이 하락함에 따라 미국 전역의 대학 프로그램이 동일한 인프라를 도입하고 엘리트층 외에도 스포츠 분석 시장을 확대하고 있습니다. 장벽의 감소는 텔레메트리가 가까운 미래에 조직화된 스포츠 피라미드 전체의 기본 요건이 될 것임을 시사합니다. 방송 파트너는 오버레이 그래픽을 위해 동일한 원시 스트림을 라이선스하고 단일 데이터 세트가 여러 수익 체인을 지원할 수 있음을 입증합니다.
이적 평가를 위한 중앙 집중식 데이터 웨어하우스
유럽 축구 클럽은 선수의 평가 모델을 표준화하기 위해 스카우팅, 스포츠 과학, 티켓 판매 및 상업 데이터를 통합 리포지토리에 통합합니다. AC 오울이 2024년 TransferLab을 도입함으로써 시장 규모가 작은 클럽이 탤런트를 18만 명의 세계 동료들과 벤치마킹하여 이적 협상의 입장을 강화할 수 있습니다. 학술 네트워크 과학 연구에 따르면 이적 네트워크에서 중심적인 위치를 차지하는 클럽은 일관되게 임금 청구 금액을 초과합니다. 그 결과 데이터에 대한 액세스가 역사적인 힘의 차이를 줄이고 경쟁에 대한 참여가 확산되고 있습니다. 엄격한 평가 로직이 직관적인 대안으로 투자자들은 웨어하우스 프로젝트를 재량적 IT 업그레이드가 아닌 캡 테이블 자산으로 보고 있습니다.
GDPR(EU 개인정보보호규정) 및 CCPA에 의한 생체인식 데이터 제약
유럽과 캘리포니아의 프라이버시 규제는 동의, 최소화, 목적 제한을 주장하며, 공급업체는 클라우드 전송 이전에 원시 생체 지표를 익명화된 위험 점수로 변환하는 엣지 처리 주변의 워크플로우를 재설계하도록 촉구합니다. 처음으로 감사에 합격한 클럽은 스폰서 매출에서 컴플라이언스를 언급하고 법적 요건이 브랜드 차별화 요인이 되었습니다. 그러나 엔지니어링에 시간이 많이 걸리기 때문에 도입이 지연되고 단기적으로 스포츠 애널리틱스 시장의 성장이 둔화됩니다. 프라이버시 바이 디자인을 신속하게 도입한 벤더는 가격면에서 우위를 차지하고 리스크를 회피하는 클럽이 입증된 프로바이더에 집중함으로써 업계의 통합이 가속화됩니다.
부문 분석
크리켓 부문 시장 규모는 2030년까지 25%의 연평균 복합 성장률(CAGR)로 성장할 것으로 예측되고 있습니다. 이것은 입찰의 상한을 퍼포먼스의 편차에 맞추는 경매 시뮬레이터와, 볼러의 로테이션을 최적화하는 세세한 볼트랙킹이 원동력이 되고 있습니다. 이와는 달리 축구는 2024년 스포츠 애널리틱스 시장 규모에서 가장 큰 점유율을 유지하고 있습니다. 크리켓의 준이사회가 데이터를 채용함으로써 주요 프랜차이즈 이외에도 보급이 확산되고, 프로바이더는 획득 비용을 롱테일의 고객 기반으로 상각할 수 있게 되었습니다. 축구는 여전히 가격 책정 벤치마킹이지만, 크리켓의 성장은 멀티 스포츠 벤더가 신흥 부문에서 쌓아 올리기 위해 필드 횡단 로드맵을 선호한다는 것을 시사합니다.
2024년 스포츠 애널리틱스 시장 점유율의 65%는 소프트웨어 라이선스가 차지합니다. 그러나 전문 서비스는 클럽이 레거시 토너먼트 시스템과 실시간 데이터 레이크를 융합시키는 통합 작업을 요청하기 때문에 CAGR 24%로 성장할 것으로 예측됩니다. 승리수, 티켓 판매량, 스폰서십 증가에 따라 요금을 증감시키는 성과 기반의 가격 설정 모델은 벤더에게 리스크를 이전해 컨설팅 업무를 심화시키는 동기부여가 됩니다. 정기적인 관리 서비스 수익이 선행 라이선스의 주기적 특성을 평준화하기 때문에 데이터 사이언스 직원을 효율적으로 조정하는 공급자에게 마진이 발생합니다. 이러한 변화는 스포츠 애널리틱스 산업이 예측 기간 동안 제품 및 서비스의 경계를 모호하게 한다는 것을 시사합니다.
스포츠 애널리틱스 시장은 스포츠별(축구, 크리켓, 농구 등), 컴포넌트별(소프트웨어, 서비스), 전개 모드별(온프레미스, 클라우드), 최종 사용자별(스포츠 팀 및 클럽, 리그 및 연맹, 개인 선수, 스포츠 베팅 사업자 등), 지역별로 분류됩니다. 시장 예측은 금액(달러)으로 제공됩니다.
지역 분석
북미는 2024년 33.21%의 매출을 차지했으며, 성숙한 프랜차이즈 평가 모델과 주별 베팅 자유화에 힘입어 저지연 데이터에 대한 지속적인 수요를 부추깁니다. 내셔널 축구 리그의 모든 장소에 설치된 경기장 전체의 수신기 어레이는 교정, 유지 보수 및 수명주기 교환을 위한 부대 서비스 시장을 형성합니다. 디지털 선수 이니셔티브와 같은 데이터 중심의 부상 경감 프로그램은 관민 파트너십이 채택을 가속화하는 방법을 보여줍니다.
아시아태평양은 크리켓의 상업적 강점과 모바일 우선 소비 패턴에 힘입어 예상 성장률이 26%로 가장 빠릅니다. 통신 사업자는 데이터 플랜에 제로 레이트 라이브 스포츠를 번들하여 애널리틱스 백홀을 위한 대역폭을 효과적으로 지원합니다. 인도, 일본, 호주 각 정부는 올림픽 준비를 위한 웨어러블 구매를 맡는 선수 웰니스 보조금에 자금을 제공하여 소비자 및 전문층 전체의 성과 지표에 대한 의식을 높이고 있습니다. OTT 플랫폼은 슈퍼 개인화된 시청자 데이터를 사용하여 시청 시간을 늘리고 해지를 줄임으로써 미디어 측 분석을 지역 스포츠 애널리틱스 시장 확대의 요인으로 만듭니다.
유럽은 여전히 혁신의 도가니입니다. 축구의 5위 리그 아키텍처는 프라이버시를 강화하는 애널리틱스 기술을 세계에 퍼뜨린 GDPR(EU 개인정보보호규정)에 대응하여 기밀 데이터를 보다 소스에 가까운 곳에서 처리하는 연계 데이터 아키텍처를 개척하고 있습니다. 영국, 스페인, 독일에서 태어난 이적금 평가 모델은 창고 벤치마크를 참조하는 대출 수수료 조항을 통해 신흥 남미 리그에도 퍼지고 있습니다. 한편 라틴아메리카와 중동 및 아프리카에서는 방송권을 극대화하기 위해 엔터프라이즈급 스택을 도입하는 플래그십 브랜드와 확실한 수익을 얻기 위해 가격을 설정한 모듈러 구독을 채용하는 중소기업이라는 이중 궤도를 따릅니다.
기타 혜택 :
- 엑셀 형식 시장 예측(ME) 시트
- 3개월의 애널리스트 서포트
목차
제1장 서론
- 조사의 전제조건 및 시장 정의
- 조사 범위
제2장 조사 방법
제3장 주요 요약
제4장 시장 상황
- 시장 개요
- 시장 성장 촉진요인
- IoT 센서에 의한 실시간 추적이 북미 프로 리그 수요 견인
- 유럽 축구 클럽에 의한 이적 평가를 위한 집중 데이터 웨어하우스의 의무화
- 미국 합법화 후 스포츠 베팅 데이터 파트너십
- 인도와 호주 크리켓 리그에서 프랜차이즈 주도의 애널리틱스 도입
- 시장 성장 억제요인
- 남미와 아프리카 Tier 2 클럽의 한정된 기술 예산
- GDPR(EU 개인정보보호규정) 및 CCPA에 의한 바이오메트릭스 및 데이터 수집의 제약
- 기술 전망
- 규제 전망
- Porter's Five Forces 분석
- 공급기업의 협상력
- 소비자의 협상력
- 신규 참가업체의 위협
- 경쟁 기업 간 경쟁 관계
- 대체품의 위협
제5장 시장 규모 및 성장 예측
- 스포츠별
- 축구
- 크리켓
- 농구
- 하키
- 미식축구
- 야구
- 럭비
- 기타 스포츠
- 컴포넌트별
- 소프트웨어
- 서비스
- 전개 모드별
- 온프레미스
- 클라우드
- 최종 사용자별
- 스포츠팀 및 클럽
- 리그 및 연맹
- 개인 선수
- 스포츠 베팅 사업자
- 기타
- 지역별
- 북미
- 미국
- 캐나다
- 멕시코
- 남미
- 브라질
- 아르헨티나
- 기타 남미
- 유럽
- 독일
- 영국
- 프랑스
- 이탈리아
- 스페인
- 기타 유럽
- 아시아태평양
- 중국
- 일본
- 한국
- 인도
- 기타 아시아태평양
- 중동 및 아프리카
- 아랍에미리트(UAE)
- 사우디아라비아
- 남아프리카
- 기타 중동?아프리카
- 북미
제6장 경쟁 구도
- 전략적 동향
- Vendor Positioning Analysis
- 기업 프로파일
- IBM Corporation
- SAP SE
- SAS Institute Inc.
- Oracle Corporation
- Microsoft Corporation
- Stats Perform(Opta)
- Catapult Group International Ltd
- Sportradar AG
- Genius Sports Group
- Zebra Technologies Corp.
- Kinexon GmbH
- Second Spectrum Inc.
- Hudl(Agile Sports)
- Wyscout Srl
- Zelus Analytics
- ChyronHego Corp.
- Hawk-Eye Innovations Ltd
- Tableau Software LLC
- Sportlogiq
- Strivr Labs Inc.
- Zone7 AI Ltd
- Synergy Sports Technology
- Kitman Labs
- Orreco Ltd
제7장 시장 기회와 장래의 전망
AJY 25.11.26The Sports Analytics market size is estimated at USD 4.14 billion in 2025, and is on course to reach USD 14.08 billion by 2030, delivering a 27.75% CAGR between 2025 and 2030.

Expansion rests on three reinforcing forces: cheaper sensors, elastic cloud capacity, and widening legal sports-betting frameworks. Franchise owners now view evidence-based decision making as routine risk management, so analytics budgets appear as line items in operating forecasts rather than as experimental projects. Vendor consolidation is gathering pace because clubs prefer partners with mature privacy controls that reduce future compliance exposure. Lengthening contract terms are lifting recurring revenue visibility, indicating that analytics has become an indispensable layer in the broader sports technology stack.
Global Sports Analytics Market Trends and Insights
Real-time Tracking Enabled by IoT Sensors
Full-field radio-frequency tracking now captures more than 200 positional data points per player on every down in National Football League venues, allowing coaching staff to translate real-time load indicators into injury-mitigation strategies . The same feeds power augmented-reality activations for fans, creating new sponsorship inventory without extra hardware outlay. As tag prices fall, collegiate programs across the United States are rolling out identical infrastructure, expanding the Sports Analytics market beyond elite tiers. Falling barriers suggest that telemetry will soon be a baseline requirement across the organised sports pyramid. Broadcast partners license identical raw streams for overlay graphics, proving that a single dataset can underpin multiple revenue chains.
Centralised Data Warehousing for Transfer Valuation
European football clubs consolidate scouting, sports science, ticketing, and commercial data in unified repositories to standardise player valuation models. AC Oulu's 2024 deployment of TransferLab lets a small-market side benchmark talent against 180,000 global peers, strengthening its position in transfer negotiations. Academic network-science work shows that clubs holding central positions in the transfer network consistently outperform wage-bill . The result is a broadening of competitive participation, as data access narrows historical power gaps. Rigorous valuation logic is replacing intuition, and investors view warehouse projects as cap-table assets rather than discretionary IT upgrades.
GDPR/CCPA Constraints on Biometric Data
European and Californian privacy regulations insist on consent, minimisation, and purpose limitation, driving suppliers to redesign workflows around edge processing that converts raw biometrics into anonymised risk scores before cloud transit. Clubs that achieve an audit pass on first attempt now reference compliance in sponsorship pitches, turning a legal requirement into a brand differentiator. However, extra engineering time slows deployment, trimming aggregate Sports Analytics market growth in the near term. Vendors that embedded privacy-by-design early have a pricing advantage that accelerates industry consolidation, as risk-averse clubs converge on proven providers.
Other drivers and restraints analyzed in the detailed report include:
- Sports-Betting Data Partnerships
- Franchise-Driven Analytics in Cricket
- Limited Tech Budgets of Tier-2 Clubs
For complete list of drivers and restraints, kindly check the Table Of Contents.
Segment Analysis
Cricket's segment market size is projected to log a 25% CAGR to 2030, powered by auction simulators that align bid ceilings with performance variance and by granular ball-tracking that optimises bowler rotation. In contrast, football retained the largest share of the Sports Analytics market size in 2024 because every top-tier club already embeds analytics teams in transfer, medical, and commercial units. Data adoption by associate cricket boards now widens penetration beyond marquee franchises, letting providers amortise acquisition costs over a long-tail customer base. Football still sets pricing benchmarks, yet cricket's growth suggests that multi-sport vendors will prioritise cross-disciplinary roadmaps to capture upside in emerging segments.
Software licenses contributed 65% of the Sports Analytics market share in 2024, reflecting entrenched platform fees. Professional services, however, are forecast to grow at a 24% CAGR as clubs ask for integration work that melds legacy tournament systems with real-time data lakes. Outcome-based pricing models that scale fees to wins, ticket yield, or sponsorship lift transfer risk to vendors, motivating them to deepen consulting practices. As recurring managed-service revenue smooths the cyclical nature of up-front licenses, margin accrues to providers that coordinate data-science staffing efficiently. The shift suggests that the Sports Analytics industry will blur product and service lines over the forecast period.
Sports Analytics Market is Segmented by Sport (Football, Cricket, Basketball, and More), Component (Software, Services), Deployment (On-Premise, Cloud), End User (Sports Teams/Clubs, Leagues and Federations, Individual Athletes, Sports Betting Operators, Others), Geography. The Market Forecasts are Provided in Terms of Value (USD).
Geography Analysis
North America controlled 33.21% revenue in 2024, underpinned by mature franchise valuation models and state-by-state betting liberalisation that fuels continuous demand for low-latency data. Stadium-wide receiver arrays in every National Football League venue have created ancillary service markets for calibration, maintenance, and lifecycle replacement. Data-driven injury-mitigation programs such as the Digital Athlete initiative illustrate how public-private partnerships accelerate adoption.
Asia-Pacific posts the fastest forecast growth at 26%, buoyed by cricket's commercial heft and mobile-first consumption patterns. Telecom operators bundle zero-rated live sport into data plans, effectively subsidising bandwidth for analytics backhaul. Governments in India, Japan, and Australia fund athlete-wellness grants that underwrite wearable purchases for Olympic preparation, lifting awareness of performance metrics across consumer and professional tiers. OTT platforms use hyper-personalised viewer data to increase watch-time and reduce churn, making media-side analytics a driver of regional Sports Analytics market expansion.
Europe remains an innovation crucible. Clubs in the top five football leagues pioneer federated data architectures that process sensitive material closer to source, a response to GDPR that has broadened privacy-enhanced analytics techniques worldwide. Transfer valuation models created in England, Spain, and Germany spread to emerging South American leagues via loan-fee clauses that reference warehouse benchmarks. Meanwhile, Latin America and the Middle East & Africa follow a dual-track trajectory: flagship brands install enterprise-grade stacks to maximise broadcast rights, while smaller organisations adopt modular subscriptions priced for revenue certainty.
- IBM Corporation
- SAP SE
- SAS Institute Inc.
- Oracle Corporation
- Microsoft Corporation
- Stats Perform (Opta)
- Catapult Group International Ltd
- Sportradar AG
- Genius Sports Group
- Zebra Technologies Corp.
- Kinexon GmbH
- Second Spectrum Inc.
- Hudl (Agile Sports)
- Wyscout Srl
- Zelus Analytics
- ChyronHego Corp.
- Hawk-Eye Innovations Ltd
- Tableau Software LLC
- Sportlogiq
- Strivr Labs Inc.
- Zone7 AI Ltd
- Synergy Sports Technology
- Kitman Labs
- Orreco Ltd
Additional Benefits:
- The market estimate (ME) sheet in Excel format
- 3 months of analyst support
TABLE OF CONTENTS
1 INTRODUCTION
- 1.1 Study Assumptions and Market Definition
- 1.2 Scope of the Study
2 RESEARCH METHODOLOGY
3 EXECUTIVE SUMMARY
4 MARKET LANDSCAPE
- 4.1 Market Overview
- 4.2 Market Drivers
- 4.2.1 Real-time Tracking Enabled by IoT Sensors Driving Demand in North-American Professional Leagues
- 4.2.2 Centralised Data Warehousing Mandates from European Football Clubs for Transfer Valuation
- 4.2.3 Sports-Betting Data Partnerships Post-Legalisation in the United States
- 4.2.4 Franchise-Driven Analytics Adoption in Indian and Australian Cricket Leagues
- 4.3 Market Restraints
- 4.3.1 Limited Tech Budgets of Tier-2 Clubs in South America and Africa
- 4.3.2 GDPR/CCPA Constraints on Biometric Data Collection
- 4.4 Technology Outlook
- 4.5 Regulatory Outlook
- 4.6 Porter's Five Forces Analysis
- 4.6.1 Bargaining Power of Suppliers
- 4.6.2 Bargaining Power of Consumers
- 4.6.3 Threat of New Entrants
- 4.6.4 Intensity of Competitive Rivalry
- 4.6.5 Threat of Substitutes
5 MARKET SIZE AND GROWTH FORECASTS (VALUE)
- 5.1 By Sport
- 5.1.1 Football (Soccer)
- 5.1.2 Cricket
- 5.1.3 Basketball
- 5.1.4 Hockey
- 5.1.5 American Football
- 5.1.6 Baseball
- 5.1.7 Rugby
- 5.1.8 Other Sports
- 5.2 By Component
- 5.2.1 Software
- 5.2.2 Services
- 5.3 By Deployment
- 5.3.1 On-Premise
- 5.3.2 Cloud
- 5.4 By End User
- 5.4.1 Sports Teams/Clubs
- 5.4.2 Leagues and Federations
- 5.4.3 Individual Athletes
- 5.4.4 Sports Betting Operators
- 5.4.5 Others
- 5.5 By Geography
- 5.5.1 North America
- 5.5.1.1 United States
- 5.5.1.2 Canada
- 5.5.1.3 Mexico
- 5.5.2 South America
- 5.5.2.1 Brazil
- 5.5.2.2 Argentina
- 5.5.2.3 Rest of South America
- 5.5.3 Europe
- 5.5.3.1 Germany
- 5.5.3.2 United Kingdom
- 5.5.3.3 France
- 5.5.3.4 Italy
- 5.5.3.5 Spain
- 5.5.3.6 Rest of Europe
- 5.5.4 Asia-Pacific
- 5.5.4.1 China
- 5.5.4.2 Japan
- 5.5.4.3 South Korea
- 5.5.4.4 India
- 5.5.4.5 Rest of Asia-Pacific
- 5.5.5 Middle East and Africa
- 5.5.5.1 United Arab Emirates
- 5.5.5.2 Saudi Arabia
- 5.5.5.3 South Africa
- 5.5.5.4 Rest of Middle East and Africa
- 5.5.1 North America
6 COMPETITIVE LANDSCAPE
- 6.1 Strategic Moves
- 6.2 Vendor Positioning Analysis
- 6.3 Company Profiles (includes Global level Overview, Market level overview, Core Segments, Financials as available, Strategic Information, Products and Services, and Recent Developments)
- 6.3.1 IBM Corporation
- 6.3.2 SAP SE
- 6.3.3 SAS Institute Inc.
- 6.3.4 Oracle Corporation
- 6.3.5 Microsoft Corporation
- 6.3.6 Stats Perform (Opta)
- 6.3.7 Catapult Group International Ltd
- 6.3.8 Sportradar AG
- 6.3.9 Genius Sports Group
- 6.3.10 Zebra Technologies Corp.
- 6.3.11 Kinexon GmbH
- 6.3.12 Second Spectrum Inc.
- 6.3.13 Hudl (Agile Sports)
- 6.3.14 Wyscout Srl
- 6.3.15 Zelus Analytics
- 6.3.16 ChyronHego Corp.
- 6.3.17 Hawk-Eye Innovations Ltd
- 6.3.18 Tableau Software LLC
- 6.3.19 Sportlogiq
- 6.3.20 Strivr Labs Inc.
- 6.3.21 Zone7 AI Ltd
- 6.3.22 Synergy Sports Technology
- 6.3.23 Kitman Labs
- 6.3.24 Orreco Ltd
7 MARKET OPPORTUNITIES AND FUTURE OUTLOOK
- 7.1 White-Space and Unmet-Need Assessment