
|
시장보고서
상품코드
2062181
소매 석유 및 가스 물류 : 시장 점유율 분석, 산업 동향 및 통계 데이터, 성장 예측(2026-2031년)Retail Oil And Gas Logistics - Market Share Analysis, Industry Trends & Statistics, Growth Forecasts (2026 - 2031) |
||||||
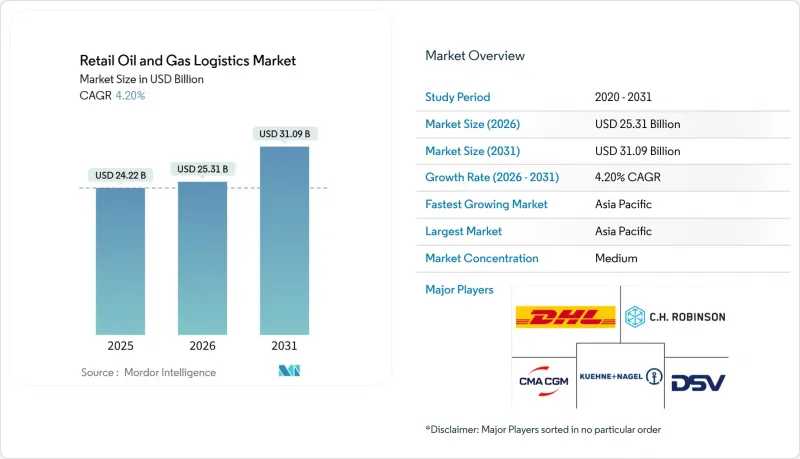
Mordor Intelligence에 의하면, 소매 석유 및 가스 물류 시장 규모는 2025년 242억 2,000만 달러로 평가되었습니다. 2026년 253억 1,000만 달러에서 2031년까지 310억 9,000만 달러로 확대되어 2026년부터 2031년까지 연평균 복합 성장률(CAGR)은 4.20%를 나타낼 것으로 예측됩니다.

표면상의 성장률은 소폭에 그치고 있지만, 그 이면에서는 공급업체들이 단순한 운송에서 연료 배송, 주유소 재고 관리, 재생에너지 혼합 연료를 위한 온도 조절 처리 등을 결합한 통합형 서비스로 전환함에 따라 근본적인 구조적 변화가 진행되고 있습니다. 본 보고서는 서비스 유형(운송, 저장·창고, 기타), 연료 유형(가솔린, 디젤, 기타), 최종 사용자(연료 소매업체, 편의점·하이퍼마켓, 업무용 소매 고객, 기타), 지역(북미, 남미, 아시아태평양, 유럽, 중동 및 아프리카)별로 분류되어 있습니다. 시장 전망은 금액(달러) 기준으로 제시되어 있습니다.
세계의 소매 석유 및 가스 물류 시장 동향 및 인사이트
통합형 포어코트·소매 형식(연료 + 푸드서비스)의 성장
대형 소매업체들은 주유소를 재설계하여 주유 펌프와 퀵서비스 레스토랑, 편의점 매장을 통합함으로써, 한 곳당 매출을 높이고 연료의 품질과 식품의 신선도를 모두 보장하는 이중 온도 관리 배송 시스템을 필요로 하고 있습니다. 월마트가 2025년까지 45곳의 주유소를 리모델링하여 450곳 이상의 복합 매장으로 확장한 것은 통합된 매장 형태가 얼마나 고객 유치력과 고객 1인당 매출을 향상시킬 수 있는지를 보여주고 있습니다. 통합형 포맷을 구현하려면 일정 동기화, 재고 관리 시스템 공유, 그리고 다기능 인력 양성이 필요하며, 이를 통해 제3자 물류 업체는 부가가치가 높은 번들 서비스를 통해 수익을 창출할 수 있게 됩니다.
유황 함량 및 옥탄가 기준의 강화로 인해 전문적인 취급이 필요해집니다.
2025년 1월에 시행된 EPA 규정에 따라 시료 채취, 시험 및 인라인 블렌딩에 대한 관리가 강화되었으며, 탱커의 구획 분할과 화물 간 철저한 세척이 의무화되었습니다. 뷰로베리타스나 SGS와 같은 인증 기관들은 대출 기관이나 보험사의 불안을 해소해 주는 검증 감사에 대한 수요가 급증하고 있다고 보고하고 있습니다. 실험실 시설과 단열 구역을 갖춘 물류 기업들은 오염 위험을 줄이면서도 가격 프리미엄을 확보하고 있습니다.
위험물 탱커 선단의 보험료 급등
이 주목을 받은 사고를 계기로, 보험사는 계약 조건을 강화하여 LNG 및 재생 가능 연료 탱커의 보험료를 30-40% 인상했습니다. 코피빌 리소시스(Coffeyville Resources)사가 승인받은 강화형 브레이크등 등의 안전 기술을 통한 면제 조치는 위험을 억제하고 가격 결정력을 되찾기 위한 노력을 상징합니다. 수송 여력이 부족한 소규모 운송업체들은 이익률 압박에 직면하거나 시장에서 철수해야 하는 상황에 몰리고 있습니다. 한편, 규제 당국의 감시 강화와 보험금 청구 빈도 증가는 계속해서 인수 전략에 압박을 가하고 있으며, 운송업체들은 위험 완화와 경쟁력 있는 가격 책정 사이의 균형을 맞추어야 하는 과제에 직면해 있습니다.
부문별 분석
부가가치 서비스는 연평균 성장률(CAGR) 7.07%를 기록하며, 소매 석유 및 가스 물류 시장에서 가장 높은 성장률을 보였습니다. 이는 화주가 종단 간 가시화, 현장 품질 검사, 자동화된 재고 대조에 대해 추가 요금을 지불하게 되었기 때문입니다. 에머슨의 레이더식 계량 시스템은 디지털 터미널이 어떻게 회전율을 높이고 손실을 줄이는지를 보여줍니다. 2025년에도 운송 부문은 소매 석유 및 가스 물류 시장 점유율의 52.89%를 차지했지만, 운전기사 부족과 보험 비용의 급등으로 인해 운송업체들은 AI 경로 계획 도구와 드론을 통해 수집된 재고 데이터를 활용하여 가동률을 높여야만 하는 상황에 처해 있습니다. 저장 및 창고 업무와 연계된 소매 석유 및 가스 물류 시장 규모는 재생 가능 연료의 혼합 및 분리, 그리고 바이오연료용 냉장 베이 도입에 힘입어 확대되고 있습니다.
부수적인 효과로는 고객 계약의 유지가 있습니다. 모니터링 포털이나 자동 청구 기능이 소매업체의 ERP에 통합되면, 시스템 전환 비용이 증가하고 계약 갱신율이 향상됩니다. 사용량 기반 데포는 설비 투자 없이 네트워크 범위를 확대할 수 있어, 자산 경량화 전략과 부합합니다. 한편, 파이프라인 사업자는 허브 앤 스포크형 모델을 통해 안정적인 요금 수입을 확보하고, 통일된 SLA에 따라 라스트 마일 탱커 배차를 통합함으로써 간선에서 급유 노즐에 이르기까지의 품질을 보장하고 있습니다.
지역별 분석
아시아태평양은 2025년에 소매 석유 및 가스 물류 시장 매출의 33.75%를 차지했으며, 2031년까지 연평균 성장률(CAGR) 5.15%를 기록할 전망입니다. 중국과 인도에서는 정유시설의 처리 능력이 확대되는 한편, 파이프라인 회랑을 통해 연안 지역의 생산물이 내륙으로 수송됨에 따라 탱크로리 파트너에 대한 서비스 수준 요건이 더욱 엄격해지고 있습니다. 지방의 열악한 통신 환경이 실시간 배차 도입을 가로막고 있지만, 저궤도 위성 서비스 제공업체들은 서비스가 미흡한 지역에서도 예측에 기반한 차량 보충이 가능하도록 커버리지를 개선하겠다고 약속하고 있습니다.
북미에서는 운송량이 정점에 다다른 가운데, 물류의 현대화가 진행되고 있습니다. 2024년에는 5개의 신규 제품 파이프라인이 가동을 시작하며, 비용이 많이 드는 철도 운송에서 다른 운송 수단으로의 전환이 진행되고 있습니다. 운전기사 부족으로 임금 상승 압력이 커지는 한편, 재생 가능 디젤의 도입으로 인해 온도 조절식 트럭 운송의 틈새 시장이 열리고 있습니다. 변동이 심한 세액 공제가 운송 노선의 수익성을 저해하고 있어, 운송업체들은 연료에 의존하지 않는 유연한 차량 구성을 유지하도록 촉구하고 있습니다.
유럽은 환경 정책의 요구에 직면해 있습니다. 유럽 청정 수소 동맹의 틀 안에서 수립된 독일의 200억 유로(230억 달러) 규모의 수소 네트워크 계획은 미래의 혼합 연료 물류를 내다보는 것입니다. 엄격한 배상책임법으로 인해 보험 비용이 증가하면서 소규모 운송업체들의 합병이 가속화되고 있습니다. 중동 및 아프리카는 생산국으로서의 지위를 활용하여 하류 공급망을 통합하고 있으며, CEVA의 사우디아라비아 합작 사업은 자본과 시장 지식을 결합한 국제·현지 제휴의 모범 사례가 되고 있습니다. 남미의 에탄올 수송 경로는 특수 탱크차에 대한 수요를 창출하며, 브라질을 바이오연료 수출 거점으로 자리매김하고 있습니다.
기타 혜택 :
- 엑셀 형식 시장 예측(ME) 시트
- 3개월간의 애널리스트 지원
자주 묻는 질문
목차
제1장 서론
제2장 분석 방법
제3장 주요 요약
제4장 시장 구도
제5장 시장 규모 및 성장률 예측
제6장 경쟁 구도
제7장 시장 기회 및 향후 전망
KTH 26.06.24According to Mordor Intelligence, the retail oil and gas logistics market size is projected to expand from USD 24.22 billion in 2025 and USD 25.31 billion in 2026 to USD 31.09 billion by 2031, registering a CAGR of 4.20% between 2026 and 2031.
Muted headline growth conceals sweeping structural changes as providers transition from pure transport to integrated offerings that blend fuel delivery, forecourt inventory orchestration, and temperature-controlled handling for renewable blends. This report is Segmented by Service Type (Transportation, Storage & Warehousing, and More), by Fuel Type (Gasoline, Diesel, and More), by End User (Fuel Retailers, Convenience Stores & Hypermarkets, Industrial Retail Customers, Others), and by Region (North America, South America, Asia-Pacific, Europe, Middle East and Africa). The Market Forecasts are Provided in Terms of Value (USD).
Global Retail Oil And Gas Logistics Market Trends and Insights
Growth of Integrated Forecourt-Retail Formats (Fuel + Foodservice)
Large retailers are redesigning forecourts to merge fuel pumps with quick-service restaurants and convenience aisles, boosting per-site turnover and necessitating dual-temperature deliveries that protect both fuel quality and food freshness. Walmart's remodeling of 45 fuel sites in 2025 en route to more than 450 multi-category locations illustrates how unified footprints lift traffic and basket size. Integrated formats require synchronized scheduling, shared inventory systems, and cross-trained crews, enabling third-party logisticians to monetize premium bundled services.
Stricter Sulfur & Octane Standards Driving Specialized Handling
The EPA's January 2025 rule tightened sampling, testing, and inline-blending controls, forcing segmentation of tanker compartments and rigorous clean-down between loads. Certification agencies such as Bureau Veritas and SGS report surging demand for verification audits that reassure lenders and insurers. Logistics firms equipped with lab services and insulated compartments command price premiums while shrinking contamination risk.
Rising Insurance Premiums for Hazardous-Cargo Tanker Fleets
Underwriters tightened terms after high-profile incidents, lifting premiums by 30-40% on LNG and renewable fuel tankers. Safety tech exemptions, such as enhanced brake lights approved for Coffeyville Resources, showcase efforts to curb risk and regain pricing leverage. Smaller carriers lacking spread capacity face margin squeeze or exit. Meanwhile, evolving regulatory scrutiny and rising claims frequency continue to pressure underwriting strategies, challenging carriers to balance risk mitigation with competitive pricing.
Other drivers and restraints analyzed in the detailed report include:
- Expansion of Refined-Product Pipeline Networks in Developing Regions
- Drone-Assisted Stock Audits at Remote Filling Stations
- Certified Tanker-Driver Shortages Affecting Delivery Reliability
For complete list of drivers and restraints, kindly check the Table Of Contents.
Segment Analysis
Value-added services posted a 7.07% CAGR, the fastest within the retail oil and gas logistics market share, as shippers pay premiums for end-to-end visibility, onsite quality testing, and automated inventory reconciliation. Emerson's radar-based gauging illustrates how digital terminals lift turnover and shrink losses. Transportation still represents 52.89% of the retail oil and gas logistics market share in 2025, yet driver shortages and insurance costs force carriers to boost utilization via AI route planners and drone-fed stock data. The retail oil and gas logistics market size, tied to storage and warehousing, benefits from renewable blend segregation and chilled bays for biofuels.
Second-order effects include sticky customer contracts: once monitoring portals and automated billing are embedded in a retailer's ERP, switching costs rise, lifting renewal rates. Pay-per-use depots extend network reach without capital outlay, aligning with asset-light strategies. Meanwhile, pipeline operators capture steady tariff revenue in hub-and-spoke models, integrating last-mile tanker dispatch under unified SLAs to protect quality from trunk line to nozzle.
Geography Analysis
Asia-Pacific generated 33.75% of the retail oil and gas logistics market revenue in 2025 and is set for a 5.15% CAGR through 2031. China and India expand refinery throughput, while pipeline corridors move coastal output inland, tightening service-level requirements for tank-truck partners. Poor rural connectivity tempers live dispatch adoption, but low-earth-orbit satellite providers promise coverage upgrades that can unlock predictive replenishment in underserved provinces.
North America exhibits logistic modernization amid mature volumes. Five new product pipelines came online in 2024, rebalancing modes away from costly rail legs. Driver shortages heighten wage pressure, while renewable diesel adoption opens niches for thermostatic trucking. Volatile tax credits disrupt route economics, prompting carriers to maintain flexible fuel-agnostic fleets.
Europe confronts green-policy imperatives. Germany's EUR 20 billion (USD 23 billion) hydrogen grid plan under the European Clean Hydrogen Alliance foreshadows future blend logistics. Stringent liability laws magnify insurance costs, catalyzing mergers of sub-scale haulers. Middle East and Africa leverage producer status to integrate downstream supply chains; CEVA's Saudi JV exemplifies international-local tie-ups that fuse capital with market knowledge. South America's ethanol corridors create specialized tank demands, positioning Brazil as a biofuel export node.
- DHL Group
- CMA CGM Group
- Gulf Agency Company Limited
- DSV
- Kuehne + Nagel
- C.H. Robinson Worldwide Inc.
- Bollore SE
- Expeditors International
- Geodis
- UPS Supply Chain Solutions
- Noatum Holdings SLU
- Reliance Logistics Group Inc.
- Halcon Primo Logistics Pte Ltd.
- BDP International Inc.
- Berrio Logistics India Pvt. Ltd.
- NYK (Yusen Logistics Co. Ltd.)
- Tudor International Freight Ltd.
- Riada Shipping and Logistics
- A.P. Moller - Maersk
- GAC Logistics
Additional Benefits:
- The market estimate (ME) sheet in Excel format
- 3 months of analyst support
TABLE OF CONTENTS
1 Introduction
- 1.1 Study Assumptions & Market Definition
- 1.2 Scope of the Study
2 Research Methodology
3 Executive Summary
4 Market Landscape
- 4.1 Market Overview
- 4.2 Market Drivers
- 4.2.1 Growth of Integrated Forecourt-Retail Formats (Fuel + Foodservice)
- 4.2.2 Stricter Sulfur & Octane Standards Driving Specialized Handling
- 4.2.3 Expansion of Refined-Product Pipeline Networks in Developing Regions
- 4.2.4 Drone-Assisted Stock Audits at Remote Filling Stations
- 4.2.5 Pay-Per-Use Shared Depot Platforms for Independent Retailers
- 4.2.6 Temperature-Controlled Logistics for Renewable-Diesel Blends
- 4.3 Market Restraints
- 4.3.1 Rising Insurance Premiums for Hazardous-Cargo Tanker Fleets
- 4.3.2 Certified Tanker-Driver Shortages Affecting Delivery Reliability
- 4.3.3 Poor Digital Connectivity at Rural Outlets Limiting Live Dispatch
- 4.3.4 Volatile Renewable-Fuel Tax Credits Complicating Route Planning
- 4.4 Value / Supply-Chain Analysis
- 4.5 Regulatory Landscape
- 4.6 Technological Outlook
- 4.7 Porter's Five Forces
- 4.7.1 Threat of New Entrants
- 4.7.2 Bargaining Power of Suppliers
- 4.7.3 Bargaining Power of Buyers
- 4.7.4 Threat of Substitutes
- 4.7.5 Competitive Rivalry
- 4.8 Impact of Geo-Political Events on the Market
5 Market Size & Growth Forecasts
- 5.1 By Service Type (Value)
- 5.1.1 Transportation
- 5.1.1.1 Road
- 5.1.1.2 Rail
- 5.1.1.3 Sea and Inland (Including Barge)
- 5.1.2 Storage & Warehousing
- 5.1.3 Value-added Services and Others(metering, quality testing)
- 5.1.1 Transportation
- 5.2 By Fuel Type (Value)
- 5.2.1 Gasoline
- 5.2.2 Diesel
- 5.2.3 Jet Fuel
- 5.2.4 Liquefied Petroleum Gas (LPG)
- 5.2.5 Liquefied Natural Gas (LNG)
- 5.2.6 Others (bitumen, lubricants)
- 5.3 By End User (Value)
- 5.3.1 Fuel Retailers (Fuel Stations)
- 5.3.2 Convenience Stores & Hypermarkets
- 5.3.3 Industrial Retail Customers (Mining, Agriculture, Construction, Government, Aviation, Marine, etc.)
- 5.3.4 Others
- 5.4 By Geography (Value)
- 5.4.1 North America
- 5.4.1.1 United States
- 5.4.1.2 Canada
- 5.4.1.3 Mexico
- 5.4.2 South America
- 5.4.2.1 Brazil
- 5.4.2.2 Peru
- 5.4.2.3 Chile
- 5.4.2.4 Argentina
- 5.4.2.5 Rest of South America
- 5.4.3 Asia-Pacific
- 5.4.3.1 India
- 5.4.3.2 China
- 5.4.3.3 Japan
- 5.4.3.4 Australia
- 5.4.3.5 South Korea
- 5.4.3.6 South East Asia (Singapore, Malaysia, Thailand, Indonesia, Vietnam, and Philippines)
- 5.4.3.7 Rest of Asia-Pacific
- 5.4.4 Europe
- 5.4.4.1 United Kingdom
- 5.4.4.2 Germany
- 5.4.4.3 France
- 5.4.4.4 Spain
- 5.4.4.5 Italy
- 5.4.4.6 BENELUX (Belgium, Netherlands, and Luxembourg)
- 5.4.4.7 NORDICS (Denmark, Finland, Iceland, Norway, and Sweden)
- 5.4.4.8 Rest of Europe
- 5.4.5 Middle East and Africa
- 5.4.5.1 United Arab Emirates
- 5.4.5.2 Saudi Arabia
- 5.4.5.3 South Africa
- 5.4.5.4 Nigeria
- 5.4.5.5 Rest of Middle East And Africa
- 5.4.1 North America
6 Competitive Landscape
- 6.1 Market Concentration
- 6.2 Strategic Moves
- 6.3 Market Share Analysis
- 6.4 Company Profiles (includes Global level Overview, Market level overview, Core Segments, Financials as available, Strategic Information, Market Rank/Share for key companies, Products & Services, and Recent Developments)
- 6.4.1 DHL Group
- 6.4.2 CMA CGM Group
- 6.4.3 Gulf Agency Company Limited
- 6.4.4 DSV
- 6.4.5 Kuehne + Nagel
- 6.4.6 C.H. Robinson Worldwide Inc.
- 6.4.7 Bollore SE
- 6.4.8 Expeditors International
- 6.4.9 Geodis
- 6.4.10 UPS Supply Chain Solutions
- 6.4.11 Noatum Holdings SLU
- 6.4.12 Reliance Logistics Group Inc.
- 6.4.13 Halcon Primo Logistics Pte Ltd.
- 6.4.14 BDP International Inc.
- 6.4.15 Berrio Logistics India Pvt. Ltd.
- 6.4.16 NYK (Yusen Logistics Co. Ltd.)
- 6.4.17 Tudor International Freight Ltd.
- 6.4.18 Riada Shipping and Logistics
- 6.4.19 A.P. Moller - Maersk
- 6.4.20 GAC Logistics
7 Market Opportunities & Future Outlook
- 7.1 White-space & Unmet-need Assessment
