
|
시장보고서
상품코드
2063303
북미의 화물 중개 서비스 : 시장 점유율 분석, 업계 동향 및 통계, 성장 예측(2026-2031년)North America Freight Brokerage Services - Market Share Analysis, Industry Trends & Statistics, Growth Forecasts (2026 - 2031) |
||||||
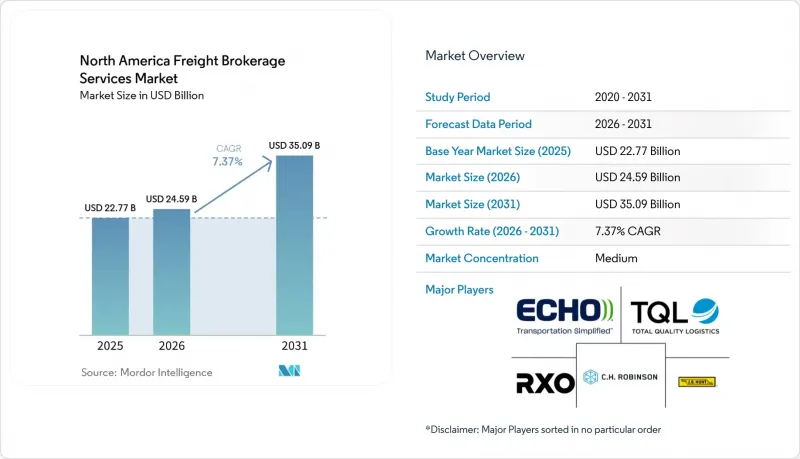
Mordor Intelligence에 의하면, 북미의 화물 중개 서비스 시장 규모는 2025년 227억 7,000만 달러로 평가되었습니다. 2026년 245억 9,000만 달러에서 2031년까지 350억 9,000만 달러로 확대되어 2026-2031년에 걸쳐 CAGR은 7.37%를 나타낼 것으로 예측됩니다.

본 보고서는 서비스별(전체 트럭 적재, 기타), 차량·트레일러 유형별(드라이밴, 기타), 운송 거리별(장거리, 기타), 비즈니스 모델별(기존, 기타), 최종 사용자 산업별(제조, 기타), 고객 규모별(대기업, 기타), 국가별(미국, 기타)로 분류되어 있습니다. 시장 전망은 금액(달러) 기준으로 제시되어 있습니다.
북미의 화물 중개 서비스 시장 동향 및 인사이트
AI를 활용한 노선별 동적 가격 책정이 중개인의 계약 성사율을 높입니다.
현재, 머신러닝은 실시간 운송 능력 데이터와 경쟁사의 견적을 활용하여 개별 운송 노선의 가격을 책정하고 있습니다. C.H. 로빈슨의 AI 에이전트는 2025년에 300만 건 이상의 운송 업무를 처리하여, 견적부터 수락까지의 주기를 몇 분 단위로 단축하는 동시에, 변동이 심한 운송 노선에서 수익률 확보를 확대했습니다. 고도 모델은 과거 입찰 결과, 기상 정보, 체류 시간 등의 지표를 분석하여 서비스 리스크를 예측함으로써, 입찰 행사에서 화주의 신뢰를 높이고 있습니다. 방대한 데이터 로그를 보유한 대형 중개업체는 소규모 경쟁사보다 신속하게 알고리즘을 최적화할 수 있으며, 절감된 비용을 운송업체의 로열티 프로그램에 재투자하는 기존 기업으로 시장 점유율을 옮기고 있습니다. 이러한 동적 가격 책정의 장점은 실시간 대기 시간이 하루 종일 현물 운임을 변동시키는 라레도와 노가레스의 국경 횡단 노선에서 가장 두드러집니다. 소규모 중개업체들은 알고리즘에 기반한 운임 이력이 부족한 플랫베드나 위험물 운송과 같은 틈새 시장에 집중함으로써 이에 대응하고 있습니다.
USMCA에 따른 국경 간 전자상거래 화물 증가가 신속한 통관 업무에 대한 수요를 불러일으키고 있습니다.
USMCA의 데미니미스(미량) 기준에 따라 소량 화물의 통관 절차가 간소화되면서, 멕시코의 시설에서 미국 가정에 직접 배송되는 흐름이 가속화되고 있습니다. 브로커는 소량 화물 운송업체와 LTL(소량 혼재) 컨솔리데이터를 연계하여 일괄 통관을 진행한 뒤, 소량 화물을 국내 허브로 집하함으로써 운송 기간을 며칠 단축하고 있습니다. Bilingual의 운영팀이 여전히 혼합 팔레트에 첨부되는 원산지 증명서를 관리하며, 화주를 감사로부터 보호하고 있습니다. CTPAT 및 FAST 프로그램 인증을 받은 통관업체는 북쪽으로 향하는 차량을 우선적으로 통관할 수 있어 경쟁 우위를 점하고 있습니다. 현재, 72시간 이내의 국경 간 배송을 약속하는 전자제품 및 의류 판매업체들 덕분에 성장 잠재력은 더욱 확대되고 있습니다.
대형 화주사의 직접 디지털 운송업체 플랫폼이 기존 중개업체를 배제하고 있습니다.
포춘 500에 선정된 한 소매 기업은 계약 운송업체로부터 실시간 운임을 조회할 수 있는 API 허브를 도입하여, 예측 가능한 운송 경로에서 중개업체를 배제하고 있습니다. IntelliTrans는 현재 공장 출하처와 2,800개의 운송 회사를 실시간으로 연결하고 있으며, 중개업체의 이용은 국경 간 화물이나 초대형 화물로 제한되어 있습니다. 이에 대해 브로커 측은 소프트웨어만으로는 실현할 수 없는 예외 관리, 정체 방지 대책, 운송 능력 보장을 제공하는 방식으로 대응하고 있습니다. 운송업체 밀도가 가장 높은 남동부의 주요 운송 노선에서는 이익률 하락이 심각합니다. 소규모 중개업체는 표준화된 API를 통해 운임 데이터를 제공하지 못할 경우, 기업의 노선 가이드에서 배제될 위험에 직면해 있습니다.
부문별 분석
소량 화물(LTL)의 매출은 LTL과 소포가 혼합된 형태로 확대된 8,500억 달러 규모의 전자상거래 반품 시장에 힘입어 연평균 성장률(CAGR) 9.66%로 증가하고 있습니다. 컨솔리데이터는 시카고와 댈러스 근교의 풀 거점을 활용하고 있습니다. 이 지역들은 소포 집하 밀도가 높아, 반품 1건당 비용을 절감하고 있습니다. 2025년에도 풀트럭 로드(FTL)는 북미의 화물 중개 서비스 시장의 71.05%를 차지하며 주요 위치를 유지했지만, 운송업체의 자동화 앱으로 인해 정기 노선 운송량이 잠식되면서 중개업체의 이익률이 압박받았습니다.
디지털 브로커는 두 가지 운송 방식을 하나의 대시보드에 통합하여, 판매자가 마감 시간이 임박했을 때도 재입찰 없이 팔레트 운송과 소포 운송을 전환할 수 있도록 합니다. 의류나 전자제품의 반품에는 신속한 재처리 절차가 요구되므로, 서비스 차별화는 클레임 처리에 중점을 두고 있습니다. POS(판매 시점 정보 관리) 시스템의 환불 트리거와 화물 스케줄링을 통합하는 중개업체는 소매업체의 충성도를 높이고, 북미의 화물 중개 서비스 시장에서 전환 비용을 높이고 있습니다.
의약품 및 밀키트 화주들이 집하부터 집 앞까지의 운송 과정에서 2단계 이하의 온도 관리를 요구함에 따라, 냉장 운송 능력은 연평균 성장률(CAGR) 9.97%로 확대되고 있습니다. 2025년 북미의 화물 중개 서비스 시장 규모에서 드라이밴이 43.78%를 차지하며 1위를 유지했지만, 서부 해안 항만의 섀시 부족으로 인해 현물 운임의 변동성은 여전히 높은 수준을 보였습니다.
자율주행 시험 운행에서는 교통량이 적은 야간에 주행하는 냉장 트럭이 선호되고 있어, 자산 활용도가 향상되고 있습니다. 브로커는 온도 급상승을 감지하여 사전 경보를 발령하는 텔레매틱스 허브를 도입하여 OS&D(지연·분실·파손) 클레임을 줄이고 있습니다. 유조선 및 플랫베드 분야의 틈새 시장은 안정적인 수익을 유지하고 있지만, 위험물 및 초대형 화물에 대한 허가 신청 절차가 복잡하기 때문에 북미의 화물 중개 서비스 시장 전반에서 알고리즘에 의한 상품화 현상으로부터 틈새 시장 전문 중개업체들을 보호하고 있습니다.
기타 혜택
- 엑셀 형식 시장 예측(ME) 시트
- 3개월간의 애널리스트 지원
자주 묻는 질문
목차
제1장 서론
제2장 조사 방법
제3장 주요 요약
제4장 시장 구도
제5장 시장 규모 및 성장 예측
제6장 경쟁 구도
제7장 시장 기회 및 향후 전망
KTH 26.06.22According to Mordor Intelligence, the north america freight brokerage services market size is projected to expand from USD 22.77 billion in 2025 and USD 24.59 billion in 2026 to USD 35.09 billion by 2031, registering a 7.37% CAGR between 2026 and 2031.
This report is Segmented by Service (Full-Truckload, and More), by Equipment/Trailer Type (Dry Van, and More), by Haul Length (Long-Haul, and More), by Business Model (Traditional, and More), by End-User Industry (Manufacturing, and More), by Customer Size (Large Enterprise, and More), and by Country (United States, and More). The Market Forecasts are Provided in Terms of Value (USD).
North America Freight Brokerage Services Market Trends and Insights
AI-Driven Lane-Level Dynamic Pricing Accelerates Broker Win-Rates
Machine learning now prices individual lanes using live capacity signals and competitive quotes. C.H. Robinson's AI agents processed over 3 million shipment tasks in 2025, trimming quote-to-accept cycles to minutes and widening margin capture on volatile corridors. Sophisticated models digest historical tender outcomes, weather, and dwell-time metrics to forecast service risk, raising shipper confidence during bid events. Large intermediaries with deep data logs sharpen algorithms faster than smaller rivals, tilting share toward incumbents that reinvest savings into carrier loyalty programs. The dynamic pricing edge is most pronounced on Laredo and Nogales cross-border lanes, where real-time wait times swing spot rates all day. Smaller brokers counter by niching into flatbed or hazmat niches where algorithmic rate history is sparse.
USMCA-Enabled Cross-Border E-Commerce Shipments Spur Expedited Brokerage Demand
De minimis thresholds under USMCA simplify small-parcel customs, unleashing direct-to-consumer flows from Mexican facilities into US households. Brokers blend parcel carriers with LTL consolidators to clear customs in bulk, then inject parcels into domestic hubs, shaving days off transit. Bilingual operations teams manage certificates of origin that still accompany mixed-case pallets, protecting shippers from audits. Competitive edges arise for brokers certified under CTPAT and FAST programs that fast-track northbound vehicles. Growth potential is magnified by electronics and apparel sellers that now promise seventy-two-hour cross-border delivery windows.
Large Shippers' Direct Digital Carrier Platforms Disintermediate Traditional Brokers
Fortune 500 retailers deploy API hubs that pull live rates from contract carriers, bypassing intermediaries for predictable lanes. IntelliTrans now connects mill shippers with 2,800 carriers in real time, reserving broker use only for cross-border or oversized freight. Brokers respond by packaging exception management, detention shields, and guaranteed capacity bundles that software alone cannot match. Margin loss is acute on head-haul lanes in the Southeast, where carrier density is highest. Smaller brokers risk being locked out of enterprise routing guides if they cannot feed rates via standardized APIs.
Other drivers and restraints analyzed in the detailed report include:
- Corporate Scope-3 Mandates Fuel Broker-Led Carbon-Optimized Routing
- Early Commercialization of Autonomous-Truck Capacity Pools via Broker Networks
- State-Level Co-Employment & Liability Statutes Inflate Legal Exposure
For complete list of drivers and restraints, kindly check the Table Of Contents.
Segment Analysis
Less-than-truckload revenue is advancing at a 9.66% CAGR, lifted by USD 850 billion in e-commerce returns that now span LTL and parcel blends. Consolidators leverage pool points near Chicago and Dallas, where high parcel density lowers cost per return. Full truckload still anchors 71.05% of the North America freight brokerage services market share in 2025, yet automated carrier apps are eroding routine lane volumes, squeezing brokerage margins.
Digital brokers embed both modes in one dashboard, enabling merchants to toggle between pallet and parcel at late cut-off without re-tendering. Service differentiation pivots on claims handling, as apparel and electronics returns demand speedy refurbishment. Brokers that integrate point-of-sale refund triggers with freight scheduling deepen retailer loyalty and raise switching costs within the North America freight brokerage services market.
Refrigerated capacity is climbing at a 9.97% CAGR as pharma and meal-kit shippers seek sub-two-degree compliance from pickup to doorstep. Dry van leads with 43.78% of the North America freight brokerage services market size in 2025, yet spot-rate volatility remains high because of chassis shortages at West Coast ports.
Autonomous trials favor reefers that run overnight when traffic is low, boosting asset utilization. Brokers deploy telematics hubs that capture temperature spikes and push proactive alerts, reducing OS&D claims. Tanker and flatbed niches hold stable revenue but add complexity through hazmat and over-dimensional permits, insulating niche brokers from algorithmic commoditization across the North America freight brokerage services market.
List of Companies Covered in this Report:
- C.H. Robinson Worldwide
- Total Quality Logistics (TQL)
- Echo Global Logistics, Inc.
- RXO
- J.B. Hunt Transport Services, Inc.
- Hub Group, Inc.
- Landstar System
- Schneider Logistics
- WWEX Group
- Arrive Logistics
- Mode Transportation
- BlueGrace Logistics
- Nolan Transportation Group
- Sunset Transportation
- Werner Enterprises
- Trinity Logistics
- Ascent Global Logistics
- Integrity Express Logistics
- Redwood Logistics
- PLS Logistics Services
Additional Benefits:
- The market estimate (ME) sheet in Excel format
- 3 months of analyst support
TABLE OF CONTENTS
1 Introduction
- 1.1 Study Assumptions and Market Definition
- 1.2 Scope of the Study
2 Research Methodology
3 Executive Summary
4 Market Landscape
- 4.1 Market Overview
- 4.2 Market Drivers
- 4.2.1 AI-Driven Lane-Level Dynamic Pricing Accelerates Broker Win-Rates
- 4.2.2 USMCA -Enabled Cross-Border E-Commerce Shipments Spur Expedited Brokerage Demand
- 4.2.3 Corporate Scope-3 Mandates Fuel Adoption of Broker-Led Carbon-Optimized Routing
- 4.2.4 Early Commercialization of Autonomous-Truck Capacity Pools via Broker Networks
- 4.2.5 Integrated LTL-Parcel Consolidation Models Expand Broker Share of Returns Logistics
- 4.2.6 Real-Time Compliance Analytics from ELD/Telematics Unlock Detention-Free SLAs
- 4.3 Market Restraints
- 4.3.1 Large Shippers' Direct Digital Carrier Platforms Disintermediate Traditional Brokers
- 4.3.2 State-Level Co-Employment and Liability Statutes (e.g., AB5) Inflate Legal Exposure
- 4.3.3 Load-Board Data Oligopoly Limits Analytics Access for Small and Mid-Sized Brokers
- 4.3.4 Rising Cybersecurity and Data-Privacy Compliance Costs (CISA/NIST Frameworks)
- 4.4 Value / Supply-Chain Analysis
- 4.5 Regulatory Landscape
- 4.6 Technological Outlook
- 4.7 Porter's Five Forces Analysis
- 4.7.1 Threat of New Entrants
- 4.7.2 Bargaining Power of Suppliers (Carriers)
- 4.7.3 Bargaining Power of Buyers (Shippers)
- 4.7.4 Threat of Substitutes
- 4.7.5 Competitive Rivalry
5 Market Size and Growth Forecasts
- 5.1 By Service
- 5.1.1 Full-Truckload (FTL)
- 5.1.2 Less-than-Truckload (LTL)
- 5.1.3 Others
- 5.2 By Equipment / Trailer Type
- 5.2.1 Dry Van
- 5.2.2 Refrigerated Van
- 5.2.3 Flatbed / Step-Deck
- 5.2.4 Tanker (Bulk Liquid and Chemical)
- 5.2.5 Others
- 5.3 By Haul Length
- 5.3.1 Long-Haul (More than 500 miles)
- 5.3.2 Regional (100-500 miles)
- 5.3.3 Local (Less than 100 miles)
- 5.4 By Business Model
- 5.4.1 Traditional Freight Brokerage
- 5.4.2 Asset-Based Freight Brokerage
- 5.4.3 Agent Model Freight Brokerage
- 5.4.4 Digital Freight Brokerage
- 5.5 By End-User Industry
- 5.5.1 Manufacturing and Automotive
- 5.5.2 Construction and Infrastructure Projects
- 5.5.3 Oil, Gas, Mining and Chemicals
- 5.5.4 Agriculture and Food / Beverage
- 5.5.5 Retail, FMCG and Wholesale Distribution
- 5.5.6 Healthcare and Pharmaceuticals
- 5.5.7 E-commerce and 3PL Fulfilment
- 5.5.8 Other End-User Industry
- 5.6 By Customer Size
- 5.6.1 Large Enterprise Shippers (More than USD 100 M)
- 5.6.2 Mid-Market Shippers (USD 10-100 M)
- 5.6.3 Small Businesses (Less than USD 10 M)
- 5.7 By Geography
- 5.7.1 United States
- 5.7.2 Canada
- 5.7.3 Mexico
6 Competitive Landscape
- 6.1 Market Concentration
- 6.2 Strategic Moves and M&A
- 6.3 Market Share Analysis
- 6.4 Company Profiles (includes Global level Overview, Market level overview, Core Segments, Financials as available, Strategic Information, Market Rank/Share for key companies, Products & Services, and Recent Developments)
- 6.4.1 C.H. Robinson Worldwide
- 6.4.2 Total Quality Logistics (TQL)
- 6.4.3 Echo Global Logistics, Inc.
- 6.4.4 RXO
- 6.4.5 J.B. Hunt Transport Services, Inc.
- 6.4.6 Hub Group, Inc.
- 6.4.7 Landstar System
- 6.4.8 Schneider Logistics
- 6.4.9 WWEX Group
- 6.4.10 Arrive Logistics
- 6.4.11 Mode Transportation
- 6.4.12 BlueGrace Logistics
- 6.4.13 Nolan Transportation Group
- 6.4.14 Sunset Transportation
- 6.4.15 Werner Enterprises
- 6.4.16 Trinity Logistics
- 6.4.17 Ascent Global Logistics
- 6.4.18 Integrity Express Logistics
- 6.4.19 Redwood Logistics
- 6.4.20 PLS Logistics Services
7 Market Opportunities and Future Outlook
- 7.1 White-space and Unmet-need Assessment
