
|
시장보고서
상품코드
2063314
ASEAN의 화물 중개 서비스 : 시장 점유율 분석, 업계 동향 및 통계, 성장 예측(2026-2031년)ASEAN Freight Brokerage Services - Market Share Analysis, Industry Trends & Statistics, Growth Forecasts (2026 - 2031) |
||||||
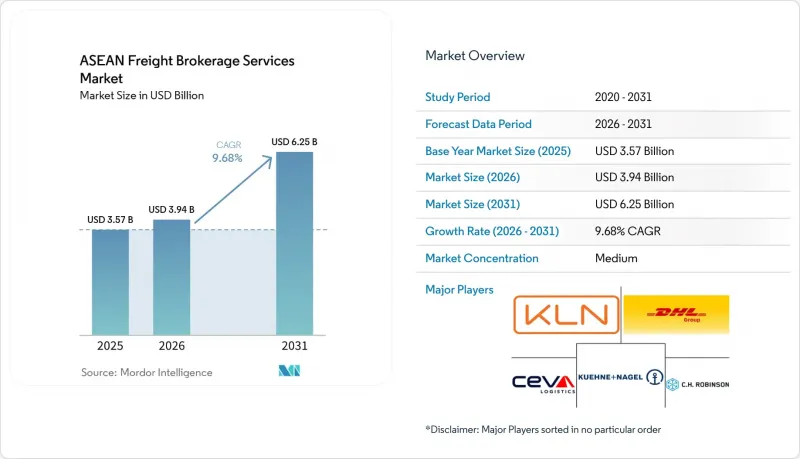
Mordor Intelligence에 의하면, ASEAN 지역의 화물 중개 서비스 시장 규모는 2025년 35억 7,000만 달러로 평가되었고, 2026년에는 39억 4,000만 달러로 추정되고, 2026-2031년 CAGR 9.68%로 성장을 지속할 전망이며, 2031년까지 62억 5,000만 달러에 이를 것으로 예측됩니다.
본 보고서는 서비스별(FTL, LTL, 기타), 차량 유형별(건조 화물차, 냉장차, 플랫베드, 탱크로리, 기타), 운송 거리별(장거리, 지역 내, 단거리), 비즈니스 모델별(기존, 자산 보유형, 대리점, 디지털), 최종 사용자별(제조업, 건설업, 농업, 소매업 등), 고객 규모별(대기업, 중견기업, 중소기업), 지역별로 분류되어 있습니다. 시장 전망은 금액(달러) 기준으로 제시되어 있습니다.
아세안의 화물 중개 서비스 시장 동향 및 인사이트
'중국+1' 공급업체를 통한 LCL 혼재 운송의 니어쇼어링 급증
조달처의 다양화로 인해 단일 주문이 아세안 지역 내 여러 공장으로 분산되면서, 숙련된 혼적 조정이 필요한 소량 화물의 양이 증가하고 있습니다. 2025년에는 베트남의 대미 전자기기 수출이 사상 최고치를 기록했으며, 태평양 횡단 항해를 앞두고 말레이시아와 태국의 공장에서 부품이 집결되었습니다. 상호 보완적인 노선 간 소량 화물을 통합하는 디지털 플랫폼을 통해, 단위당 운송 비용을 최대 35% 절감할 수 있습니다. 관세 코드나 원산지 규정에 관한 서류 작업의 조정은 점점 더 복잡해지고 있지만, 기술에 정통한 브로커들은 이를 프리미엄 서비스로 전환해 수익을 창출하고 있습니다. 설비 부족은 여전히 위험 요인이지만, 고성장 경로에서는 운송량 증가가 비용 측면의 역풍을 상쇄하고 있습니다.
AI를 활용한 예측 입찰 및 현물 운임의 동적 자동화
머신러닝 엔진은 최대 85%의 정확도로 선사의 여유 상황과 최적의 입찰 시점을 예측하며, 플랫폼이 4시간마다 스팟 시세를 갱신하여 노선별 수요 변동과 유가 변동을 반영할 수 있도록 합니다. 이러한 도구를 도입한 노선에서는 공항 비율이 12-18% 감소했으며, 왕복편에서 중개인의 마진이 증가했습니다. 싱가포르와 말레이시아에서는 클라우드 인프라와 해운사 간의 EDI 통합이 성숙 단계에 이르러 도입률이 가장 높습니다. 미얀마와 캄보디아의 중소 브로커들은 동등한 시스템을 도입할 자금이나 기술이 부족하여 디지털 격차가 확대되고 있습니다. 기술력을 갖춘 사업자들이 기존 중개업체보다 저렴한 가격으로 서비스를 제공함에 따라, 지속적인 투자를 통해 업계 통합이 가속화될 조짐이 보입니다.
아세안 내륙 지역의 만성적인 컨테이너 및 섀시 설비 불균형
베트남 중부나 인도네시아의 외딴 섬 등 수출이 집중되는 지역에서 컨테이너가 정체되면, 중개업자는 운송 1회당 300-550달러의 재배치 비용을 부담하게 됩니다. 귀로 구간의 공차 운행률은 여전히 50% 전후로 유지되고 있어, 자산 가동률을 저하시켜 있습니다. 또한, 성수기에는 냉장 컨테이너나 초대형 컨테이너의 리드타임이 1주일에 달하는 경우도 있어, LCL(소량 혼적) 화물의 집하가 지연되고 있습니다. 인도네시아의 지역 상황이 이러한 부족 현상을 더욱 악화시키고 있습니다. 소규모 섬들에 남겨진 차대가 효율적으로 재활용되는 경우는 드물기 때문입니다. 정책적 개입이나 풀 플랫폼이 없다면, 설비 부족으로 인해 이익률은 계속해서 압박을 받을 것입니다.
부문별 분석
2025년 총 수익 중 풀트럭 로드(FTL) 운송이 61.00%를 차지했으며, 대량 생산 노선에서의 지배력을 반영하고 있습니다. 그러나 '중국+1' 전략으로 인해 주문이 아세안 지역의 여러 공장으로 분산되면서, 소량 화물(LTL)은 연평균 성장률(CAGR) 12.20%로 확대되고 있습니다. 현재 디지털 컨소리데이터는 베트남, 말레이시아, 태국에서 출발하는 소량 팔레트 화물을 미국행 컨테이너에 통합하고 있으며, 이를 통해 운송 비용을 최대 35% 절감하고 있습니다. 예측에 기반한 적재 계획과 자동화된 서류 작성을 통해, 과거 LCL 브로커 사업을 괴롭혔던 이익률 하락을 방지하고 있습니다. FTL은 중공업에 여전히 필수적이지만, 저스트-인-타임 재고 모델이 빈번하고 소규모 운송을 선호하기 때문에 그 점유율은 감소 추세에 있습니다.
성장 가능성은 전문적인 부가 서비스에서도 찾을 수 있습니다. 온도 관리가 이루어지는 LTL 노선에서는 GDP 기준에 따른 취급 절차와 블록체인 기반 로트 추적 시스템을 결합하여, 백신 운송을 위한 프리미엄 요금을 책정하고 있습니다. 조호르와 싱가포르 간 당일 국경 간 소량 화물(LTL) 프로젝트는 화물이 가득 찰 때까지 기다릴 수 없는 전자상거래(EC) 보충 주기를 대상으로 합니다. 동적 경로 설정 엔진을 갖춘 브로커는 이러한 기회를 정기 네트워크에 통합하여, 비수기에도 85-90%의 가동률을 유지하고 있습니다. 그 결과, 주기적인 벌크 화물 변동의 영향을 덜 받는 견고한 수익 구조를 구축하게 되었습니다.
2025년에는 일반 화물차가 48.94%의 점유율을 차지했으나, 백신 유통 및 신선식품 수출이 증가함에 따라 냉장 화물차는 2031년까지 연평균 성장률(CAGR) 13.52%라는 견실한 성장세를 기록했습니다. 방콕과 호치민시의 제약 클러스터에서는 현재 입찰 시 엔드투엔드 온도 기록을 명시하고 있으며, 중개업체는 센서의 무결성과 운전자의 규정 준수 여부를 입증해야 할 의무가 있습니다. IoT 기능을 탑재한 냉장 컨테이너는 실시간 알림을 전송하여 부패로 인한 클레임을 0.5% 미만으로 억제함으로써, 전 세계 제약사들로부터 재주문을 확보하고 있습니다. 전자기기 및 섬유 제품 분야에서 드라이벤에 대한 수요는 지속되고 있지만, 단기 운송 능력의 변동으로 인해 시장에 트럭이 과잉 공급되면 마진이 압박을 받게 됩니다.
플랫베드 및 스텝데크 트레일러는 고속도로 인프라 투자와 풍력 발전소용 부품 운송의 수혜를 입고 있으며, 탱커는 지역 내 화학 물질 운송을 담당하고 있습니다. 그럼에도 불구하고, 진정한 경쟁의 장은 데이터의 가시성에 있습니다. 노선별 온도 변동을 운임 계산식에 반영하는 중개업체는 단순히 운송 능력만 확보하는 일반 화물 포워더보다 높은 요금 설정을 정당화할 수 있습니다. 투자자들이 ESG 기준에 부합하는 자산을 추구하는 가운데, 전기식 냉동 장치와 태양광 발전 기반 모니터링 시스템을 갖춘 차량은 자금 조달 비용을 절감하고 콜드체인 중개 사업의 성장 사이클을 강화하고 있습니다.
기타 혜택 :
- 엑셀 형식 시장 예측(ME) 시트
- 3개월간의 애널리스트 지원
자주 묻는 질문
목차
제1장 서론
제2장 조사 방법
제3장 주요 요약
제4장 시장 구도
제5장 시장 규모 및 성장 예측
제6장 경쟁 구도
제7장 시장 기회 및 향후 전망
AJY 26.06.22According to Mordor Intelligence, the aSEAN freight brokerage services market size is expected to grow from USD 3.57 billion in 2025 to USD 3.94 billion in 2026 and is forecast to reach USD 6.25 billion by 2031 at a 9.68% CAGR over 2026-2031.

This report is Segmented by Service (FTL, LTL, Others), by Equipment (Dry Van, Refrigerated, Flatbed, Tanker, Others), by Haul Length (Long-Haul, Regional, Local), by Business Model (Traditional, Asset-Based, Agent, Digital), by End-User (Manufacturing, Construction, Agriculture, Retail, and More), by Customer Size (Large, Mid-Market, Small), and Geography. Market Forecasts in Value (USD)
ASEAN Freight Brokerage Services Market Trends and Insights
Nearshoring Surge in LCL Consolidation from "China + 1" Suppliers
Diversified sourcing sends single orders across several ASEAN factories, swelling sub-container loads that require skilled consolidation. Vietnam's electronics exports to the U.S. hit record highs in 2025, with components pooled from plants in Malaysia and Thailand before trans-Pacific sailings. Digital platforms that blend fractional freight across complementary routes cut per-unit shipping costs by up to 35%. Harmonizing tariff codes and rules-of-origin paperwork adds complexity that tech-savvy brokers monetize as a premium service. Equipment shortages still pose a risk, but the volume upside outweighs the cost headwinds in high-growth lanes.
AI-Driven Predictive Tendering & Dynamic Spot-Rate Automation
Machine-learning engines predict carrier availability and ideal tender timing with up to 85% accuracy, letting platforms refresh spot quotes every four hours to reflect lane-level demand shifts and fuel movements. Empty-mile ratios have fallen 12-18% on corridors that adopt these tools, lifting brokerage margins on round trips. Singapore and Malaysia show the highest uptake because cloud infrastructure and carrier EDI integration are mature. Smaller brokers in Myanmar and Cambodia lack the capital and skills to deploy comparable systems, widening the digital divide. Continued investment signals faster consolidation as tech-enabled players undercut legacy brokers.
Chronic Container and Chassis Equipment Imbalance Within ASEAN Hinterlands
Brokers absorb USD 300-550 per move in repositioning fees when boxes pile up in export-heavy zones such as Central Vietnam and outlying Indonesian islands. Empty-mile ratios still hover near 50% on return legs, throttling asset utilization. Refrigerated and out-of-gauge equipment lead-time now stretches to a week in peak months, delaying LCL consolidations. Indonesia's geography compounds the deficit because chassis stranded on smaller islands rarely cycle back efficiently. Without policy interventions or pooling platforms, equipment scarcity will keep trimming margins.
Other drivers and restraints analyzed in the detailed report include:
- ASEAN Customs Single Window Phase II Roll-Out Compressing Dwell Times
- Emergence of Green Freight Corridors & ESG-Linked Shipping Finance
- Enduring Port Congestion at Secondary Gateways and Inland Connectivity Gaps
For complete list of drivers and restraints, kindly check the Table Of Contents.
Segment Analysis
Full-truckload (FTL) transport held 61.00% of the overall 2025 revenue, reflecting its grip on bulk manufacturing lanes. Yet, less-than-truckload (LTL) is advancing at a 12.20% CAGR because China + 1 strategies splinter orders across multiple ASEAN plants. Digital consolidators now sweep partial pallets from Vietnam, Malaysia, and Thailand into single containers for U.S. sailings, shrinking landed costs by up to 35%. Predictive cube-planning and automated documentation prevent the margin erosion that once plagued LCL brokerage. FTL remains indispensable for heavy industry, but its share edges lower as just-in-time inventory models favor frequent, smaller moves.
Growth potential also lies in specialized add-ons. Temperature-controlled LTL lanes bundle GDP-compliant handling with blockchain lot tracking for vaccines, commanding premium rates. Same-day cross-border micro-LTL projects between Johor and Singapore target e-commerce replenishment cycles that cannot wait for full loads. Brokers equipped with dynamic routing engines stitch these opportunities into scheduled networks that run at 85-90% utilization even in off-peak weeks. The result is a resilient revenue mix less exposed to cyclical bulk-cargo swings.
Dry vans dominated at 48.94% share in 2025, but refrigerated vans registered a brisk 13.52% CAGR through 2031 as vaccine distribution and fresh-food exports multiply. Pharma clusters in Bangkok and Ho Chi Minh City now specify end-to-end temperature logs in tenders, obliging brokers to prove sensor integrity and driver compliance. IoT-enabled reefers transmit real-time alerts that cut spoilage claims below 0.5%, winning repeat orders from global drug makers. Dry-van demand endures for electronics and textiles, yet margins compress when spot capacity swings flood the market with extra trucks.
Flatbed and step-deck trailers ride infrastructure spending on highways and wind-farm components, while tankers support regional chemical flows. Still, the real battleground is data visibility. Brokers embedding lane-level temperature variance into rate formulas justify premiums over commodity forwarders who merely procure capacity. As investors chase ESG-aligned assets, fleets with electric refrigeration units and solar-powered monitoring draw lower financing costs, reinforcing the growth loop in cold-chain brokerage.
List of Companies Covered in this Report:
- DHL Group
- Kuehne + Nagel
- Kerry Logistics Network
- CEVA Logistics
- C.H. Robinson
- Nippon Express
- DSV
- Yusen Logistics
- Expeditors International
- Transporeon
- CJ Logistics
- Forto
- Tiong Nam Logistics
- Linc Group
- Geodis
- Rhenus Logistics
- Hellmann Worldwide Logistics
- APX Logistics Solutions Co., Ltd
- Haulio
- Logisly
Additional Benefits:
- The market estimate (ME) sheet in Excel format
- 3 months of analyst support
TABLE OF CONTENTS
1 Introduction
- 1.1 Study Assumptions and Market Definition
- 1.2 Scope of the Study
2 Research Methodology
3 Executive Summary
4 Market Landscape
- 4.1 Market Overview
- 4.2 Market Drivers
- 4.2.1 AI-Driven Predictive Tendering and Dynamic Spot-Rate Automation
- 4.2.2 ASEAN Customs Single Window Phase II Roll-Out Compressing Dwell Times
- 4.2.3 Emergence of Green Freight Corridors and ESG-Linked Shipping Finance
- 4.2.4 Nearshoring-Driven Surge in LCL Consolidation from "China + 1" Suppliers
- 4.2.5 Expansion of Regional Cold-Chain Pharma Hubs Boosting Temperature-Controlled Brokerage
- 4.2.6 Shift of Marine Insurance Premia Toward Alternate Sea Trans-Shipment Hubs
- 4.3 Market Restraints
- 4.3.1 Chronic Container and Chassis Equipment Imbalance within ASEAN Hinterlands
- 4.3.2 Regulatory Ambiguity on Digital-Broker Licensing and Data-Localization Mandates
- 4.3.3 Enduring Port Congestion at Secondary Gateways and Inland Connectivity Gaps
- 4.3.4 Currency-Volatility-Driven Hedging Costs Compressing Brokerage Margins
- 4.4 Value / Supply-Chain Analysis
- 4.5 Regulatory Landscape
- 4.6 Technological Outlook
- 4.7 Porter's Five Forces
- 4.7.1 Threat of New Entrants
- 4.7.2 Bargaining Power of Suppliers
- 4.7.3 Bargaining Power of Buyers
- 4.7.4 Threat of Substitutes
- 4.7.5 Competitive Rivalry
5 Market Size and Growth Forecasts (Value)
- 5.1 By Service
- 5.1.1 Full-Truckload (FTL)
- 5.1.2 Less-than-Truckload (LTL)
- 5.1.3 Others
- 5.2 By Equipment / Trailer Type
- 5.2.1 Dry Van
- 5.2.2 Refrigerated Van
- 5.2.3 Flatbed / Step-Deck
- 5.2.4 Tanker (Bulk Liquid and Chemical)
- 5.2.5 Others
- 5.3 By Haul Length
- 5.3.1 Long-Haul (More than 500 miles)
- 5.3.2 Regional (100-500 miles)
- 5.3.3 Local (Less than 100 miles)
- 5.4 By Business Model
- 5.4.1 Traditional Freight Brokerage
- 5.4.2 Asset-Based Freight Brokerage
- 5.4.3 Agent Model Freight Brokerage
- 5.4.4 Digital Freight Brokerage
- 5.5 By End-User Industry
- 5.5.1 Manufacturing and Automotive
- 5.5.2 Construction and Infrastructure Projects
- 5.5.3 Oil, Gas, Mining and Chemicals
- 5.5.4 Agriculture and Food / Beverage
- 5.5.5 Retail, FMCG and Wholesale Distribution
- 5.5.6 Healthcare and Pharmaceuticals
- 5.5.7 E-commerce and 3PL Fulfilment
- 5.5.8 Other End-User Industry
- 5.6 By Customer Size
- 5.6.1 Large Enterprise Shippers (More than USD 100 M)
- 5.6.2 Mid-Market Shippers (USD 10-100 M)
- 5.6.3 Small Businesses (Less than USD 10 M)
- 5.7 By Country
- 5.7.1 Indonesia
- 5.7.2 Vietnam
- 5.7.3 Thailand
- 5.7.4 Malaysia
- 5.7.5 Philippines
- 5.7.6 Singapore
- 5.7.7 Myanmar
- 5.7.8 Cambodia
- 5.7.9 Laos
- 5.7.10 Brunei
6 Competitive Landscape
- 6.1 Market Concentration
- 6.2 Strategic Moves and Developments
- 6.3 Market Share Analysis
- 6.4 Company Profiles (includes Global level Overview, Market level overview, Core Segments, Financials as available, Strategic Information, Market Rank/Share for key companies, Products and Services, and Recent Developments)
- 6.4.1 DHL Group
- 6.4.2 Kuehne + Nagel
- 6.4.3 Kerry Logistics Network
- 6.4.4 CEVA Logistics
- 6.4.5 C.H. Robinson
- 6.4.6 Nippon Express
- 6.4.7 DSV
- 6.4.8 Yusen Logistics
- 6.4.9 Expeditors International
- 6.4.10 Transporeon
- 6.4.11 CJ Logistics
- 6.4.12 Forto
- 6.4.13 Tiong Nam Logistics
- 6.4.14 Linc Group
- 6.4.15 Geodis
- 6.4.16 Rhenus Logistics
- 6.4.17 Hellmann Worldwide Logistics
- 6.4.18 APX Logistics Solutions Co., Ltd
- 6.4.19 Haulio
- 6.4.20 Logisly
7 Market Opportunities and Future Outlook
- 7.1 White-space and Unmet-Need Assessment
