
|
시장보고서
상품코드
2063842
AI 훈련용 GPU 시장 : 점유율 분석, 업계 동향과 통계, 성장 예측(2026-2031년)AI Training GPU - Market Share Analysis, Industry Trends & Statistics, Growth Forecasts (2026 - 2031) |
||||||
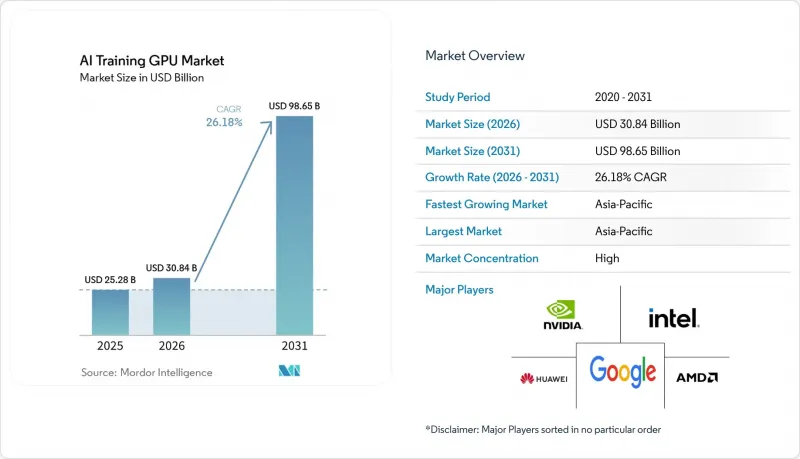
Mordor Intelligence에 의하면, AI 훈련용 GPU 시장 규모는 2025년 252억 8,000만 달러에서 2026년에는 308억 4,000만 달러로 확대되어 2026년부터 2031년까지 CAGR 26.18%로 성장을 지속하여, 2031년에는 986억 5,000만 달러에 이를 것으로 예측됩니다.
본 보고서는 도입 환경(하이퍼스케일/클라우드, 엔터프라이즈, 정부·연구기관), 메모리 유형(HBM(HBM2e, HBM3 등) 및 GDDR 기반), 상호 연결 및 확장성(싱글 GPU, 멀티 GPU(노드 내) 등), 최종 사용 목적의 훈련 워크로드(파운데이션 모델/LLM, 컴퓨터 비전, 음성/NLP 모델 등), 그리고 지역별로 분류되어 있습니다. 시장 전망은 금액(달러) 기준으로 제시되어 있습니다.
전 세계 AI 훈련용 GPU 시장 동향과 인사이트
기업 워크로드에 생성형 AI의 광범위한 도입
이 기업은 2025년과 2026년에 자사 데이터를 보호하고, API 기반 추론 비용을 절감하며, 업계별 코퍼스를 활용해 모델을 미세 조정하기 위해 훈련 클러스터를 On-Premise로 이전했습니다. Dell Technologies의 보고서에 따르면, 4,000개 이상의 AI Factory 고객사가 의료, 금융, 법무 분야의 이용 사례에 맞추어 8개에서 32개 GPU가 탑재된 시스템을 구매하고 있습니다. 전문 서비스 기업은 사내 프로젝트를 위해 NVIDIA GB300 NVL72 랙을 도입함으로써, 2023년에는 극히 미미했던 기업 수요를 2025년까지 시장 점유율 기준으로 한 자릿수 후반대까지 끌어올렸습니다. 랙 1대당 3년간의 총 소유 비용(TCO)은 200만-500만 달러에 달하지만, 조직은 제3자 과금 모델의 경우 연간 토큰 1개당 50만 달러를 초과할 수도 있는 비용과 비교할 때 이러한 지출을 정당화하고 있습니다. 이러한 경제성 덕분에, 기밀성이 높은 워크로드는 방화벽 내에 유지하면서 중요도가 낮은 작업은 클라우드로 분산시키는 하이브리드 아키텍처가 확산되고 있습니다. 그 결과, 유연한 라이선싱과 멀티테넌트 기능을 제공하는 GPU 공급업체들이 점차 시장 점유율을 확대되고 있습니다.
하이퍼스케일 AI 훈련 인프라에 대한 투자의 급속한 확대
마이크로소프트, 구글, 아마존, 메타, Oracle은 2027년까지 AI 인프라를 위해 총 약 7,000억 달러 규모의 설비 투자를 단행하겠다고 밝혔으며, 이 중 40-50%가 훈련 클러스터에 투입될 예정입니다. 텍사스주에서 Oracle과 OpenAI가 추진하는 ‘프로젝트 주피터’에만 1,650억 달러의 예산이 투입되었으며, 2030년까지 100만 대 이상의 GPU를 도입할 계획입니다. 현재 용량 예약은 수년 후까지 이어지고 있으며, 가동률 목표는 2023년 수준을 크게 상회하는 70-80%대로 상승했습니다. Applied Digital이나 IREN과 같은 독립형 공급업체들은 GPU-as-a-Service(GPUaaS) 용량을 제공하기 위해 수십억 달러 규모의 임대 계약을 확보했으며, 이는 하이퍼스케일 수요의 지속성을 뒷받침하고 있습니다. 사전 구매형 용량으로의 전환에 따라 유휴 시간의 버퍼가 축소되고 기준 소비량이 증가함에 따라, 2026년부터 2028년까지 GPU 출하량이 꾸준히 증가할 것으로 보입니다.
고도의 패키징 역량에 따른 지속적인 공급망 제약
2025년, TSMC의 CoWoS 생산 라인은 풀가동 상태에 들어갔습니다. 이는 GPU, HPC, 네트워크 분야 수요가 합쳐서 생산 능력을 약 3분의 1 정도 초과했기 때문입니다. 리드타임이 12-18개월로 늘어남에 따라, 공급업체들은 다년 계약을 맺은 하이퍼스케일러에 대한 납품을 우선시할 수밖에 없게 되었고, 그 결과 일반 기업 대상 납품에는 최대 9개월의 지연이 발생했습니다. 2026년에 CoWoS 생산량을 50% 확대하고, 2028년까지 두 배로 늘리는 계획이 추진되고 있지만, 신규 라인 1개당 비용은 10억-15억 달러에 달하며, 설비 인증에도 오랜 시간이 소요됩니다. 삼성의 ‘I-Cube’나 인텔의 ‘Foveros’와 같은 경쟁 기술들은 아직 제3자에 의한 양산 단계에 이르지 못했기 때문에 2027년까지는 공급 부족이 크게 완화될 전망은 희박할 것으로 보입니다. 이러한 병목 현상으로 인해 잠재 수요가 50-60%의 성장을 뒷받침하고 있음에도 불구하고, 연간 출하량 증가율은 30%대 중반에 그치고 있어, 공급 할당량을 확보한 하이퍼스케일러에게는 구조적인 우위가 생기고 있습니다.
부문별 분석
2025년 AI 훈련용 GPU 시장의 매출액 중 70.27%는 하이퍼스케일 및 클라우드 도입이 차지하고 있으며, 이는 1만 장 이상의 GPU를 갖춘 클러스터의 일상적인 도입을 반영한 것입니다. 그러나 기업 부문도 그 뒤를 바짝 쫓고 있으며, 사내 미세 조정 업무량 증가에 따라 2031년까지 연평균 성장률(CAGR) 26.71%로 확대되고 있습니다. 점점 더 많은 조직이 지적 재산 관리와 클라우드 비용을 저울질하게 됨에 따라, 기업용 AI 훈련용 GPU 시장 규모는 꾸준히 확대될 것으로 예측됩니다. 정부와 연구 기관은 국가 차원의 지원에 힘입어 고객 기반을 다각화하는 추가적인 수요를 창출하고 있습니다.
조달 방식은 크게 다릅니다. 하이퍼스케일러는 GPU 및 HBM공급을 수년까지 확보해 왔으며, 이를 통해 유리한 가격 책정과 공급 부족 시 할당 보장을 확보하고 있습니다. 반면, 기업들은 주로 현물 재고를 구매하는데, 이 경우 30%의 할증료와 긴 리드타임이 따릅니다. 정부 입찰에서 현지 조립이 조건으로 제시되는 사례가 늘어나고 있어, 계약은 지역 유력 기업으로 유도되고 있으며, 수출 규제를 받는 공급업체의 사업 기회는 제한되고 있습니다. 이러한 양극화로 인해 병행 공급망이 형성되었으며, 전 세계 공급업체들은 라이선싱 규정을 위반하지 않으면서 수익 성장을 유지하기 위해 이를 관리해야 합니다.
HBM 탑재 가속기는 2025년 시장 가치의 53.47%를 차지하며, 현재 주로 구형 비전 모델이나 추천 모델에 사용되고 있는 GDDR 제품 시장 점유율을 대폭 축소시켰습니다. HBM3e의 도입으로 평균 판매 가격이 급등하면서, AI 훈련용 GPU 시장에서 HBM 탑재 카드의 우위가 더욱 공고해졌습니다. 해당 시장은 예측 기간 동안 연평균 성장률(CAGR) 26.98%를 나타낼 것으로 전망됩니다. 이 부문은 2031년까지 시장 구조에서 주도적인 위치를 유지할 것으로 전망됩니다. HBM공급망은 SK하이닉스, 삼성, 마이크론 등 3대 공급업체에 의해 지배되고 있으며, 이들 기업에 안정적인 이익률을 보장하는 과점적 시장 구조가 형성되어 있습니다.
GDDR 기반 GPU는 여전히 매개변수 수가 적은 워크로드를 처리하고 있지만, 소프트웨어 개발 팀은 점점 더 통합된 HBM 스택을 선호하는 추세입니다. 이러한 변화는 이중 최적화 흐름에 수반되는 복잡성과 비효율성을 피해야 할 필요성에 의해 추진되고 있습니다. 2027년 하반기로 예정된 HBM4 샘플 출하로 인해 패키지당 대역폭이 약 2 TB/s에 달할 것으로 예상되며, 이는 시장 내 프리미엄 가격 책정 추세를 더욱 강화할 것으로 전망됩니다. 충분한 HBM 할당량을 확보하지 못하는 벤더는 특히 트랜스포머 모델의 매개변수 수가 1,000억을 초과할 경우 시장 점유율을 잃을 위험이 있습니다. 이러한 상황에서는 메모리 대역폭이 훈련 시간에 영향을 미치는 결정적인 요인이 되며, 그 중요성은 연산 밀도를 능가하게 됩니다.
지역별 분석
아시아태평양은 2025년 전 세계 매출의 67.43%를 차지해, 2031년까지 연평균 성장률(CAGR) 26.59%를 유지할 것으로 전망됩니다. 중국은 미국의 수출 규제에 대응해 국내에서 가속기 도입을 가속화하고 있으며, 화웨이의 Ascend 910B와 Biren BR104가 국내 수요의 약 4분의 1을 차지하고 있습니다. 일본의 2조 엔(132억 달러) 규모 프로그램과 인도의 12억 3,000만 달러 규모 프로젝트가 성장의 기반이 되고 있는 반면, 한국은 메모리 공급 능력을 활용해 경쟁사들과 번들 가격 협상을 진행하고 있습니다. 싱가포르와 말레이시아는 지원적인 정책 체계, 세제 혜택, 해저 케이블 접근성 등을 바탕으로 지역 데이터센터 허브로 부상하고 있습니다.
북미는 여전히 하이퍼스케일 투자의 중심지입니다. 텍사스주에서 Oracle과 OpenAI가 추진하는 1,650억 달러 규모의 ‘프로젝트 주피터’와 마이크로소프트의 Azure AI 리전 확장으로 인해 자본 집약도는 높은 수준을 유지하고 있습니다. 저비용의 수력, 원자력, 가스 발전을 통해 전기 요금이 미국 평균의 3배에 달하기도 하는 유럽과 비교했을 때, 총비용 측면에서 유리한 경제성을 실현하고 있습니다. 캐나다의 8억 9,000만 캐나다 달러(6억 5,000만 달러) 규모의 소버린 컴퓨팅 프로젝트는 지역 내 처리 능력을 구축하고 있는 반면, 멕시코는 스페인어 모델 훈련 워크로드를 위한 니어쇼어 투자를 유치하고 있습니다.
유럽은 절대적인 수치로는 뒤처져 있지만, EuroHPC 공동 사업을 통한 70억 유로(75억 달러) 규모의 엑사스케일 이니셔티브를 통해 그 격차를 좁혀가고 있습니다. 독일과 프랑스는 국립 연구소에 1만 대 이상의 GPU 클러스터를 증설하고 있으며, 영국은 5억 파운드(6억 3,000만 달러) 규모의 AI 연구 자원을 통해 국내 훈련용 컴퓨팅 자원에 대한 접근을 확보하고 있습니다. EU AI법에 따른 규제 부담은 규정 준수 비용을 감당할 수 있는 대규모 기관에 대한 수요를 집중시킬 가능성이 있습니다. 전반적으로 지역별 지출은 여전히 집중되어 있지만, 조달을 다각화하는 정부 자금 지원 프로젝트를 통해 점차 균형이 잡혀가고 있습니다.
기타 혜택:
- 엑셀 형식 시장 예측(ME) 시트
- 3개월간의 애널리스트 지원
자주 묻는 질문
목차
제1장 서론
제2장 조사 방법
제3장 주요 요약
제4장 시장 구도
제5장 시장 규모와 성장 예측
제6장 경쟁 구도
제7장 시장 기회와 향후 전망
JHS 26.06.23According to Mordor Intelligence, the aI training gPU market size is expected to grow from USD 25.28 billion in 2025 to USD 30.84 billion in 2026 and is forecast to reach USD 98.65 billion by 2031 at a 26.18% CAGR over 2026-2031.

This report is Segmented by Deployment Environment (Hyperscale/Cloud, Enterprise, and Government and Research), Memory Type (HBM [HBM2e, HBM3, and More], and GDDR-Based), Interconnect and Scaling (Single GPU, Multi-GPU Intra-Node, and More), End-Use Training Workload (Foundation Models/LLM, Computer Vision, Speech/NLP Models, and More), and Geography. The Market Forecasts are Provided in Terms of Value (USD).
Global AI Training GPU Market Trends and Insights
Widespread Adoption Of Generative AI In Enterprise Workloads
Enterprises moved training clusters on-premises in 2025 and 2026 to protect proprietary data, cut API-based inference charges, and fine-tune models on sector-specific corpora. Dell Technologies reported that more than 4,000 AI Factory customers have purchased 8-GPU to 32-GPU systems across healthcare, finance, and legal use cases. Professional-services firms installed NVIDIA GB300 NVL72 racks for internal projects, pushing enterprise demand from a negligible base in 2023 to high-single-digit market contribution by 2025. Three-year total cost of ownership per rack runs USD 2-5 million, yet organizations rationalize the spend against potential annual per-token fees that exceed USD 0.5 million under third-party billing models. The economics encourage hybrid architectures that keep sensitive workloads behind the firewall while bursting less-critical jobs to the cloud. GPU vendors that provide flexible licensing and multi-tenancy support are therefore winning incremental share.
Rapid Scaling Of Hyperscale AI Training Infrastructure Investments
Microsoft, Google, Amazon, Meta, and Oracle collectively signaled roughly USD 700 billion of capital outlays for AI infrastructure through 2027, with 40-50% earmarked for training clusters. Oracle and OpenAI's Project Jupiter in Texas alone carries a USD 165 billion budget and plans to install more than 1 million GPUs before 2030. Capacity reservations now span multiple years, so utilization targets have risen into the 70-80% range, well above 2023 levels. Independent providers such as Applied Digital and IREN secured multi-billion-dollar lease commitments to furnish GPU-as-a-service capacity, confirming sustained hyperscale demand. The pivot to pre-purchased capacity compresses idle-time buffers and increases baseline consumption, driving consistent pull-through for GPU shipments across 2026-2028.
Persistent Supply-Chain Constraints In Advanced Packaging Capacity
TSMC's CoWoS lines operated at full utilization in 2025 because GPU, HPC, and networking demand collectively exceeded capacity by roughly one-third. Lead times stretched to 12-18 months, forcing vendors to prioritize deliveries to hyperscalers with multiyear commitments and leaving enterprises with delays of up to nine months. Plans to boost CoWoS output by 50% during 2026 and to double it by 2028 are underway, but each new line costs USD 1-1.5 billion and requires lengthy equipment qualification. Competing approaches such as Samsung's I-Cube and Intel's Foveros have yet to reach third-party high-volume manufacturing, so tightness is unlikely to ease meaningfully before 2027. The bottleneck caps annual shipment growth at mid-30% even though potential demand supports 50-60%, granting hyperscalers with locked-in allocations a structural advantage.
Other drivers and restraints analyzed in the detailed report include:
- Transition To Advanced HBM3 And HBM3e Memory Stacks Boosting GPU ASPs
- Proliferation Of Sovereign AI Initiatives Driving Government Procurement
- Rising Total Cost Of Ownership For Cluster-Scale GPU Deployments
For complete list of drivers and restraints, kindly check the Table Of Contents.
Segment Analysis
Hyperscale and cloud installations accounted for 70.27% of 2025 revenue in the AI Training GPU market, reflecting routine deployments of clusters with more than 10,000 GPUs. Enterprises, however, are catching up, advancing at a 26.71% CAGR through 2031 as internal fine-tuning workloads grow. The AI Training GPU market size for enterprise buyers is forecast to expand steadily as more organizations weigh intellectual property control against cloud costs. Government and research institutions, supported by sovereign mandates, are layering incremental demand that diversifies the customer base.
Procurement patterns differ sharply. Hyperscalers lock in multi-year GPU and HBM supply, thereby capturing favorable pricing and guaranteed allocation during shortages. Enterprises often purchase spot inventory, which comes with 30% surcharges and longer lead times. Government tenders increasingly stipulate local assembly, steering contracts toward regional champions and limiting the addressable opportunity for export-constrained vendors. This bifurcation creates parallel supply chains that global suppliers must manage to sustain revenue growth without breaching licensing regimes.
HBM-equipped accelerators accounted for 53.47% of the 2025 value, significantly reducing the market share of GDDR products, which are now primarily used for legacy vision and recommendation models. The introduction of HBM3e into mass production led to a sharp increase in average selling prices, further solidifying the dominance of HBM-based cards in the AI Training GPU market with a CAGR of 26.98% over the forecast period. This segment is projected to maintain its leadership in the value mix through 2031. The HBM supply chain is controlled by three key suppliers, SK hynix, Samsung, and Micron, creating an oligopolistic market structure that ensures stable margins for these players.
While GDDR GPUs continue to serve smaller-parameter workloads, software development teams are increasingly preferring a unified HBM stack. This shift is driven by the need to avoid the complexities and inefficiencies associated with dual optimization flows. The anticipated sampling of HBM4 in late 2027 is expected to push per-package bandwidth to approximately 2 TB/s, reinforcing the trend of premium pricing in the market. Vendors that fail to secure sufficient HBM allocations risk losing market share, especially as transformer model sizes exceed 100 billion parameters. In such scenarios, memory bandwidth becomes the critical factor influencing training times, overtaking compute density in importance.
Geography Analysis
Asia-Pacific contributed 67.43% of global 2025 revenue and is forecast to sustain a 26.59% CAGR through 2031. China accelerated domestic adoption of accelerators after U.S. export controls, with Huawei's Ascend 910B and Biren BR104 capturing roughly one-quarter of internal demand. Japan's JPY 2 trillion (USD 13.2 billion) program and India's USD 1.23 billion mission underpin growth, while South Korea leverages memory-supply muscle to negotiate competitive bundle pricing. Singapore and Malaysia are emerging as regional data center hubs thanks to supportive policy frameworks, tax incentives, and access to subsea cables.
North America remains the epicenter of hyperscale outlays. Oracle and OpenAI's USD 165 billion Project Jupiter in Texas and Microsoft's expansion of Azure AI regions keep capital intensity high. Lower-cost hydroelectric, nuclear, and gas power enables favorable total-cost economics compared with Europe, where electricity can cost 3 times the U.S. average. Canada's CAD 890 million (USD 650 million) sovereign compute project is building regional capacity, while Mexico is attracting nearshore investments for Spanish-language model training workloads.
Europe trails in absolute value yet is closing the gap through the EuroHPC Joint Undertaking's EUR 7 billion (USD 7.5 billion) exascale initiative. Germany and France are adding 10,000-plus GPU clusters at national labs, and the United Kingdom's GBP 500 million (USD 630 million) AI Research Resource ensures domestic access to training compute. Regulatory overhead from the EU AI Act may consolidate demand among larger institutions that can absorb compliance costs. Overall, geographic spending remains concentrated but increasingly balanced by sovereign-funded projects that diversify procurement.
- NVIDIA Corporation
- Advanced Micro Devices Inc.
- Intel Corporation
- Baidu Inc.
- Huawei Technologies Co., Ltd.
- Graphcore Ltd.
- Cerebras Systems Inc.
- Alibaba Group Holding Limited
- Google LLC
- Amazon.com Inc.
- Meta Platforms Inc.
- Microsoft Corporation
- SambaNova Systems Inc.
- Tenstorrent Inc.
- Qualcomm Incorporated
- Tesla Inc.
- Fujitsu Limited
- IBM Corporation
- Hewlett Packard Enterprise Company
- Giga Computing Technology (GIGABYTE)
Additional Benefits:
- The market estimate (ME) sheet in Excel format
- 3 months of analyst support
TABLE OF CONTENTS
1 INTRODUCTION
- 1.1 Study Assumptions and Market Definition
- 1.2 Scope of the Study
2 RESEARCH METHODOLOGY
3 EXECUTIVE SUMMARY
4 MARKET LANDSCAPE
- 4.1 Market Overview
- 4.2 Market Drivers
- 4.2.1 Widespread Adoption of Generative AI in Enterprise Workloads
- 4.2.2 Rapid Scaling of Hyperscale AI Training Infrastructure Investments
- 4.2.3 Transition to Advanced HBM3 and HBM3e Memory Stacks Boosting GPU ASPs
- 4.2.4 Vendor-Neutral Open Interconnect Standards like NVLink-CXL Convergence
- 4.2.5 Proliferation of Sovereign AI Initiatives Driving Government Procurement
- 4.2.6 Emergence of Liquid Cooling as a Standard for High-TDP Training GPUs
- 4.3 Market Restraints
- 4.3.1 Persistent Supply-Chain Constraints in Advanced Packaging Capacity
- 4.3.2 Rising Total Cost of Ownership for Cluster-Scale GPU Deployments
- 4.3.3 Geopolitical Export Controls on High-End GPUs to China and Middle East
- 4.3.4 Increasing Competition from Custom AI Accelerators and ASICs
- 4.4 Impact of Macroeconomic Factors on the Market
- 4.5 Industry Value Chain Analysis
- 4.6 Regulatory Landscape
- 4.7 Technological Outlook
- 4.8 Porter's Five Forces Analysis
- 4.8.1 Bargaining Power of Suppliers
- 4.8.2 Bargaining Power of Buyers
- 4.8.3 Threat of New Entrants
- 4.8.4 Threat of Substitutes
- 4.8.5 Intensity of Competitive Rivalry
5 MARKET SIZE AND GROWTH FORECASTS (VALUE)
- 5.1 By Deployment Environment
- 5.1.1 Hyperscale / Cloud
- 5.1.2 Enterprise
- 5.1.3 Government and Research
- 5.2 By Memory Type
- 5.2.1 HBM
- 5.2.1.1 HBM2e
- 5.2.1.2 HBM3
- 5.2.1.3 HBM3e
- 5.2.1.4 HBM4
- 5.2.2 GDDR-based
- 5.2.2.1 Low-End Training / Legacy
- 5.2.1 HBM
- 5.3 By Interconnect and Scaling
- 5.3.1 Single GPU
- 5.3.2 Multi-GPU (Intra-node)
- 5.3.3 Cluster-Scale (Multi-node)
- 5.4 By End-Use Training Workload
- 5.4.1 Foundation Models / LLM Training
- 5.4.2 Computer Vision Training
- 5.4.3 Speech / NLP Models
- 5.4.4 Recommendation Systems / Graph Models
- 5.5 By Geography
- 5.5.1 North America
- 5.5.1.1 United States
- 5.5.1.2 Canada
- 5.5.1.3 Mexico
- 5.5.2 Europe
- 5.5.2.1 Germany
- 5.5.2.2 United Kingdom
- 5.5.2.3 France
- 5.5.2.4 Italy
- 5.5.2.5 Rest of Europe
- 5.5.3 Asia-Pacific
- 5.5.3.1 China
- 5.5.3.2 Japan
- 5.5.3.3 South Korea
- 5.5.3.4 India
- 5.5.3.5 Southeast Asia
- 5.5.3.6 Rest of Asia-Pacific
- 5.5.4 South America
- 5.5.5 Middle East
- 5.5.6 Africa
- 5.5.1 North America
6 COMPETITIVE LANDSCAPE
- 6.1 Market Concentration
- 6.2 Strategic Moves
- 6.3 Market Share Analysis
- 6.4 Company Profiles (includes Global Level Overview, Market Level Overview, Core Segments, Financials as available, Strategic Information, Market Rank/Share, Products and Services, Recent Developments)
- 6.4.1 NVIDIA Corporation
- 6.4.2 Advanced Micro Devices Inc.
- 6.4.3 Intel Corporation
- 6.4.4 Baidu Inc.
- 6.4.5 Huawei Technologies Co., Ltd.
- 6.4.6 Graphcore Ltd.
- 6.4.7 Cerebras Systems Inc.
- 6.4.8 Alibaba Group Holding Limited
- 6.4.9 Google LLC
- 6.4.10 Amazon.com Inc.
- 6.4.11 Meta Platforms Inc.
- 6.4.12 Microsoft Corporation
- 6.4.13 SambaNova Systems Inc.
- 6.4.14 Tenstorrent Inc.
- 6.4.15 Qualcomm Incorporated
- 6.4.16 Tesla Inc.
- 6.4.17 Fujitsu Limited
- 6.4.18 IBM Corporation
- 6.4.19 Hewlett Packard Enterprise Company
- 6.4.20 Giga Computing Technology (GIGABYTE)
7 MARKET OPPORTUNITIES AND FUTURE OUTLOOK
- 7.1 White-Space and Unmet-Need Assessment
