

|
시장보고서
상품코드
2073607
미량영양소 비료 : 시장 점유율 분석, 업계 동향 및 통계, 성장 예측(2026-2031년)Micronutrient Fertilizer - Market Share Analysis, Industry Trends & Statistics, Growth Forecasts (2026 - 2031) |
||||||
 Mordor Intelligence
Mordor Intelligence에 의하면, 미량영양소 비료 시장 규모는 2025년에 29억 3,000만 달러로 평가되었습니다. 2026년 32억 달러에서 2031년까지 47억 1,000만 달러로 성장할 것으로 예상되고, 예측 기간 중 연평균 복합 성장률(CAGR)은 8.0%를 나타낼 전망입니다.
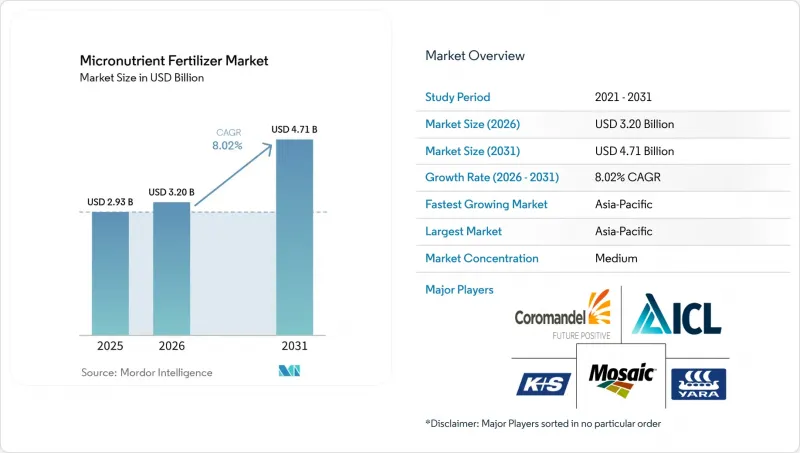
본 보고서는 제품별(붕소, 구리, 철, 망간, 몰리브덴, 아연, 기타), 시비 방법별(비료 관개, 엽면 시비, 토양 시비), 작물 유형별(밭작물, 원예작물, 잔디 및 관상용 작물), 지역별(아시아태평양, 유럽, 중동 및 아프리카, 북미, 남미)로 분류되어 있습니다. 시장 전망은 금액(달러) 및 수량(미터톤) 단위로 제시되어 있습니다.
세계의 미량영양소 비료 시장 동향 및 인사이트
집약적인 곡물 생산 지대에서 나타나는 광범위한 토양 미량영양소 결핍
인도의 2024년 토양 건강 카드 감사 결과에 따르면, 49%의 지역에서 아연 결핍이 확인되었으며, 이는 2019년 대비 7퍼센트 포인트 증가한 수치입니다. 한편, 붕소 결핍은 조사 대상 구획의 3분의 1에 영향을 미쳤습니다. 중국 허난성의 밀 수확량은 2020년부터 2024년까지 1헥타르당 5.8메트르톤으로 보합세를 보였습니다. 이는 미량 원소의 보조 인자에 의한 제약이 여전히 남아 있었기 때문이며, 질소 사용량이 12% 증가했음에도 불구하고 그런 결과가 나타났습니다. 인도네시아 농림부는 2024년에 아연이 강화된 NPK 비료 12만 메트릭톤을 배포하여, 시험 포장에서 벼 수확량을 8% 향상시켰습니다. 그 배경에는 유기물의 지속적인 감소가 있으며, 이로 인해 천연 킬레이트 작용이 저하되어 구조적 수요가 확실해지고 있다는 점을 들 수 있습니다.
정밀 시비 장비의 급속한 보급
2024년, 유럽의 340개 농장에서 GPS가 탑재된 살포기를 도입한 결과, 1헥타르당 황산아연 사용량이 22% 감소하는 동시에 잎의 아연 농도가 15% 증가했습니다. 존 디어(John Deere)에 따르면, 2024년 분무기 판매 대수의 18%에 미량영양소 주입 장치가 탑재되어 있으며, 이는 2022년의 11%에서 증가한 수치입니다. 캐나다의 카놀라 재배에서 드론을 이용한 엽면 붕소 시비로 결실률이 9% 향상되었습니다. 이러한 성과는 과다 시비의 위험을 줄이는 동시에, 호주 연방과학산업연구기구(CSIRO)가 지적한 새로운 환경 규정 요건에도 부응하고 있습니다.
주요 광석 가격의 급격한 변동
2024년, 황산아연의 거래 가격은 1메트릭톤당 1,200-1,680달러 사이에서 등락하며, 평균 8-12%인 제제 제조업체의 이익률을 압박했습니다. 황산구리는 2024년 중반에 톤당 2,400달러에 달했으며, 남미의 일부 대두 생산자들이 엽면 시비용 구리 사용 시기를 연기함에 따라 2024년 상반기 해당 지역의 미량영양소 판매량은 6% 감소했습니다. 모자이크사는 가격 변동의 영향을 완화하기 위해 황산아연 조달량의 40%에 대해 헤지 조치를 취했습니다.
부문별 분석
아연은 미량영양소 비료 시장에서 가장 큰 점유율을 차지했으며, 2025년에는 38.4%를 차지했습니다. 이러한 우위는 주요 밭작물 및 원예작물에서 식물의 성장, 효소 활성화, 수확량 증대에 필수적인 역할을 하고 있다는 점에 기인합니다. 아연계 비료는 특히 토양의 미량영양소 결핍이 확인된 지역이나 집약적인 재배 체계가 채택된 지역에서 널리 이용되고 있습니다. 시장 확대는 코팅 처리나 킬레이트화된 아연 제품 등, 효율이 향상된 제형에 의한 제품 혁신에 힘입어 더욱 가속화되고 있습니다. 이들은 다양한 토양 조건에서 영양소의 이용 가능성과 흡수 효율을 향상시킵니다.
붕소는 2026년부터 2031년에 걸쳐 연평균 성장률(CAGR) 7.5%를 기록하며 가장 빠르게 성장하는 부문이 될 것으로 전망됩니다. 이러한 성장은 식용유 종자, 과일, 채소 및 기타 고부가가치 작물의 재배 확대에 힘입은 것이며, 이러한 작물에서 붕소는 개화, 착과, 수분 및 작물의 전반적인 품질에 중요한 역할을 하고 있습니다. 정밀 영양 관리 기법과 비료·관개 시스템의 도입 확대 역시 붕소 비료 수요를 더욱 끌어올리고 있습니다. 또한, 붕소 결핍과 이것이 작물의 생산성에 미치는 영향에 대한 인식이 높아짐에 따라, 선진국과 신흥국의 농업 시장 모두에서 붕소계 제품의 사용이 확대되고 있습니다.
지역별 분석
2025년, 아시아태평양은 미량영양소 비료 시장에서 39.1%라는 가장 높은 점유율을 차지했습니다. 또한, 2026년부터 2031년까지의 예측 기간 동안 연평균 성장률(CAGR) 8.9%를 기록하며, 가장 빠르게 성장하는 지역 시장이 될 것으로 전망됩니다. 이러한 성장은 중국, 인도 및 동남아시아 국가들의 광범위한 농업 생산 시스템에 의해 주도되고 있습니다. 균형 잡힌 영양 관리와 미량영양소 결핍에 대한 대응이 점점 더 중요시되고 있는 점이 수요를 끌어올리는 주요 요인이 되고 있습니다. 또한, 특수 비료의 사용 확대, 정밀 농업의 실천, 고부가가치 작물 재배 증가가 이 지역 시장 지위를 더욱 공고히 하고 있습니다.
북미와 유럽은 미량영양소 비료 시장에서 성숙한 시장이자 전략적으로 중요한 시장으로 간주됩니다. 이 지역들 수요는 정밀 농업 기술, 첨단 토양 검사 기법, 그리고 킬레이트화된 미량영양소 제품의 광범위한 활용에 힘입어 유지되고 있습니다. 또한, 영양소 이용 효율과 지속 가능한 농업 관행에 대한 규제적 강조로 인해, 농가들은 밭작물과 원예작물 모두에서 목표 지향적인 미량영양소 시비 프로그램의 도입을 촉진하고 있습니다.
중동 및 아프리카 및 남미는 농업의 현대화와 상업적 농업 활동의 확대로 인해 주요 성장 시장으로 부상하고 있습니다. 관개 인프라에 대한 투자, 비료 공급 개선, 생산성 향상 프로그램이 이 지역들에서 미량영양소 비료의 도입을 촉진하고 있습니다. 남미에서는 대두, 옥수수, 과일, 채소 등의 작물 재배 확대가 시장 성장을 뒷받침하고 있습니다. 한편, 중동 및 아프리카 국가들은 균형 잡힌 식물 영양 전략을 통해 작물의 생산성을 높이는 데 주력하고 있습니다.
기타 혜택 :
- 엑셀 형식 시장 예측(ME) 시트
- 3개월간의 애널리스트 지원
자주 묻는 질문
목차
제1장 서론
제2장 보고서의 내용
제3장 주요 요약 및 주요 조사 결과
제4장 주요 업계 동향
제5장 시장 규모 및 성장 예측
제6장 경쟁 구도
제7장 비료 업계 CEO가 직면하는 중요 전략적 과제
KTH 26.07.07According to Mordor Intelligence, the micronutrient fertilizer market size was valued at USD 2.93 billion in 2025 and is projected to grow from USD 3.20 billion in 2026 to USD 4.71 billion by 2031, registering a CAGR of 8.0% during the forecast period.
This report is Segmented by Product (Boron, Copper, Iron, Manganese, Molybdenum, Zinc, Others), Application Mode (Fertigation, Foliar, Soil), by Crop Type (Field Crops, Horticultural Crops, Turf and Ornamental), and by Region (Asia-Pacific, Europe, Middle East and Africa, North America, South America). The Market Forecasts are Provided in Terms of Value (USD) and Volume (Metric Tons).
Global Micronutrient Fertilizer Market Trends and Insights
Widespread Soil Micronutrient Deficiencies in Intensive Cereal Belts
India's 2024 soil health card audit revealed zinc deficiency in 49% of districts, a seven percentage point increase since 2019, while boron shortfalls affected one-third of sampled plots . Wheat yields in China's Henan province stagnated at 5.8 metric tons per ha from 2020 to 2024, even as nitrogen use climbed 12% because trace-element co-factors remained limiting. Indonesia's Ministry of Agriculture distributed 120,000 metric tons of zinc-fortified NPK in 2024, boosting paddy yields by 8% in pilot plots. The underlying driver is the ongoing decline in organic matter, which reduces natural chelation and ensures structural demand.
Rapid Adoption of Precision-Application Equipment
GPS-enabled applicators reduced zinc sulfate use by 22% per hectare across 340 European farms in 2024, while increasing leaf zinc concentrations by 15%. John Deere noted that 18% of 2024 sprayer sales included micronutrient injectors, up from 11% in 2022. Drone-guided foliar boron in Canadian canola increased seed set by 9%. These gains simultaneously lower over-application risks, an emerging environmental compliance need flagged by the Commonwealth Scientific and Industrial Research Organisation (CSIRO).
High Price Volatility of Key Mineral Ores
Zinc sulfate traded between USD 1,200 and USD 1,680 per metric ton in 2024, compressing formulator margins that average 8-12%. Copper sulfate reached USD 2,400 per metric ton in mid-2024, causing some South American soybean growers to defer foliar copper applications, which resulted in a 6% decline in regional micronutrient volumes in H1 2024. Mosaic hedged 40% of its zinc sulfate inputs to cushion volatility.
Other drivers and restraints analyzed in the detailed report include:
- Expansion of High-Value Horticulture Under Protected Cultivation
- Government Micronutrient Subsidy Programs in South and Southeast Asia
- Low Farmer Awareness in Sub-Saharan Africa and Parts of South America
For complete list of drivers and restraints, kindly check the Table Of Contents.
Segment Analysis
Zinc accounted for the largest share of the micronutrient fertilizer market, representing 38.4% in 2025. This dominance is attributed to its essential role in plant growth, enzyme activation, and yield improvement across major field and horticultural crops. Zinc-based fertilizers are widely adopted, particularly in regions with documented soil micronutrient deficiencies and intensive cropping systems. Market expansion is further supported by product innovations, including enhanced-efficiency formulations such as coated and chelated zinc products, which improve nutrient availability and uptake efficiency under diverse soil conditions.
Boron is projected to be the fastest-growing segment, with a 7.5% CAGR during 2026-2031. This growth is driven by the increasing cultivation of oilseeds, fruits, vegetables, and other high-value crops, where boron plays a critical role in flowering, fruit set, pollination, and overall crop quality. The rising adoption of precision nutrient management practices and fertigation systems is further boosting demand for boron fertilizers. Additionally, growing awareness of boron deficiencies and their impact on crop productivity is encouraging the use of boron-based products in both developed and emerging agricultural markets.
Complete Report Scope:
- By Product
- Boron
- Copper
- Iron
- Manganese
- Molybdenum
- Zinc
- Others
- By Application Mode
- Fertigation
- Foliar
- Soil
- By Crop Type
- Field Crops
- Horticultural Crops
- Turf and Ornamental
- By Geography
- Asia-Pacific
- Australia
- Bangladesh
- China
- India
- Indonesia
- Japan
- Pakistan
- Philippines
- Thailand
- Vietnam
- Rest of Asia-Pacific
- Europe
- France
- Germany
- Italy
- Netherlands
- Russia
- Spain
- Ukraine
- United Kingdom
- Rest of Europe
- Middle East And Africa
- Nigeria
- Saudi Arabia
- South Africa
- Turkey
- Rest of Middle East And Africa
- North America
- Canada
- Mexico
- United States
- Rest of North America
- South America
- Argentina
- Brazil
- Rest of South America
- Asia-Pacific
Geography Analysis
In 2025, the Asia-Pacific region accounted for the largest share of the micronutrient fertilizer market at 39.1%. It is also projected to be the fastest-growing regional market, with a CAGR of 8.9% during the forecast period of 2026-2031. This growth is driven by the extensive agricultural production systems across China, India, and Southeast Asian countries. The increasing focus on balanced nutrient management and addressing micronutrient deficiencies is a key factor boosting demand. Additionally, the rising adoption of specialty fertilizers, precision agriculture practices, and high-value crop cultivation further strengthens the market position in this region.
North America and Europe are considered mature yet strategically significant markets for micronutrient fertilizers. The demand in these regions is supported by the widespread use of precision farming technologies, advanced soil testing methods, and chelated micronutrient products. Furthermore, regulatory emphasis on nutrient-use efficiency and sustainable agricultural practices is encouraging farmers to implement targeted micronutrient application programs for both field and horticultural crops.
The Middle East and Africa, along with South America, are emerging as key growth markets due to agricultural modernization and the expansion of commercial farming activities. Investments in irrigation infrastructure, improved fertilizer accessibility, and productivity enhancement programs are driving the adoption of micronutrient fertilizers in these regions. In South America, the increasing cultivation of crops such as soybean, corn, fruits, and vegetables supports market growth. Meanwhile, countries in the Middle East and Africa are focusing on improving crop productivity through balanced plant nutrition strategies.
- Yara International ASA
- The Mosaic Company
- ICL Group Ltd
- K+S Aktiengesellschaft
- Coromandel International Ltd
- Koch Agronomic Services (Koch Industries)
- BASF SE
- FMC Corporation
- SQM S.A.
- Haifa Group
- Compass Minerals International Inc.
- Nouryon
- Nufarm Limited
- Brandt Consolidated Inc.
- BMS Micro-Nutrients NV
Additional Benefits:
- The market estimate (ME) sheet in Excel format
- 3 months of analyst support
TABLE OF CONTENTS
1 INTRODUCTION
- 1.1 Study Assumptions and Market Definition
- 1.2 Scope of the Study
- 1.3 Research Methodology
2 REPORT OFFERS
3 EXECUTIVE SUMMARY AND KEY FINDINGS
4 KEY INDUSTRY TRENDS
- 4.1 Acreage Of Major Crop Types
- 4.1.1 Field Crops
- 4.1.2 Horticultural Crops
- 4.2 Average Nutrient Application Rates
- 4.2.1 Micronutrients
- 4.2.1.1 Field Crops
- 4.2.1.2 Horticultural Crops
- 4.2.1 Micronutrients
- 4.3 Agricultural Land Equipped For Irrigation
- 4.4 Regulatory Framework
- 4.5 Value Chain And Distribution Channel Analysis
- 4.6 Market Drivers
- 4.6.1 Widespread soil micronutrient deficiencies in intensive cereal belts
- 4.6.2 Rapid adoption of precision-application equipment
- 4.6.3 Expansion of high-value horticulture under protected cultivation
- 4.6.4 Government micronutrient subsidy programs in South and Southeast Asia
- 4.6.5 Bio-fortification initiatives against hidden hunger
- 4.6.6 Nanochelated formulations offering higher uptake efficiency
- 4.7 Market Restraints
- 4.7.1 High price volatility of key mineral ores
- 4.7.2 Low farmer awareness in Sub-Saharan Africa and parts of South America
- 4.7.3 Antagonistic interactions in multi-nutrient blends
- 4.7.4 Stricter limits on heavy-metal contaminants
5 5. MARKET SIZE AND GROWTH FORECASTS (VALUE AND VOLUME)
- 5.1 By Product
- 5.1.1 Boron
- 5.1.2 Copper
- 5.1.3 Iron
- 5.1.4 Manganese
- 5.1.5 Molybdenum
- 5.1.6 Zinc
- 5.1.7 Others
- 5.2 By Application Mode
- 5.2.1 Fertigation
- 5.2.2 Foliar
- 5.2.3 Soil
- 5.3 By Crop Type
- 5.3.1 Field Crops
- 5.3.2 Horticultural Crops
- 5.3.3 Turf and Ornamental
- 5.4 By Geography
- 5.4.1 Asia-Pacific
- 5.4.1.1 Australia
- 5.4.1.2 Bangladesh
- 5.4.1.3 China
- 5.4.1.4 India
- 5.4.1.5 Indonesia
- 5.4.1.6 Japan
- 5.4.1.7 Pakistan
- 5.4.1.8 Philippines
- 5.4.1.9 Thailand
- 5.4.1.10 Vietnam
- 5.4.1.11 Rest of Asia-Pacific
- 5.4.2 Europe
- 5.4.2.1 France
- 5.4.2.2 Germany
- 5.4.2.3 Italy
- 5.4.2.4 Netherlands
- 5.4.2.5 Russia
- 5.4.2.6 Spain
- 5.4.2.7 Ukraine
- 5.4.2.8 United Kingdom
- 5.4.2.9 Rest of Europe
- 5.4.3 Middle East And Africa
- 5.4.3.1 Nigeria
- 5.4.3.2 Saudi Arabia
- 5.4.3.3 South Africa
- 5.4.3.4 Turkey
- 5.4.3.5 Rest of Middle East And Africa
- 5.4.4 North America
- 5.4.4.1 Canada
- 5.4.4.2 Mexico
- 5.4.4.3 United States
- 5.4.4.4 Rest of North America
- 5.4.5 South America
- 5.4.5.1 Argentina
- 5.4.5.2 Brazil
- 5.4.5.3 Rest of South America
- 5.4.1 Asia-Pacific
6 COMPETITIVE LANDSCAPE
- 6.1 Key Strategic Moves
- 6.2 Market Share Analysis
- 6.3 Company Landscape
- 6.4 Company Profiles (includes Global Level Overview, Market Level Overview, Core Business Segments, Financials, Headcount, Key Information, Market Rank, Market Share, Products and Services, and Analysis of Recent Developments).
- 6.4.1 Yara International ASA
- 6.4.2 The Mosaic Company
- 6.4.3 ICL Group Ltd
- 6.4.4 K+S Aktiengesellschaft
- 6.4.5 Coromandel International Ltd
- 6.4.6 Koch Agronomic Services (Koch Industries)
- 6.4.7 BASF SE
- 6.4.8 FMC Corporation
- 6.4.9 SQM S.A.
- 6.4.10 Haifa Group
- 6.4.11 Compass Minerals International Inc.
- 6.4.12 Nouryon
- 6.4.13 Nufarm Limited
- 6.4.14 Brandt Consolidated Inc.
- 6.4.15 BMS Micro-Nutrients NV


