
|
시장보고서
상품코드
2073615
아시아태평양의 비료 : 시장 점유율 분석, 업계 동향 및 통계, 성장 예측(2026-2031년)Asia-Pacific Fertilizers - Market Share Analysis, Industry Trends & Statistics, Growth Forecasts (2026 - 2031) |
||||||
 Mordor Intelligence
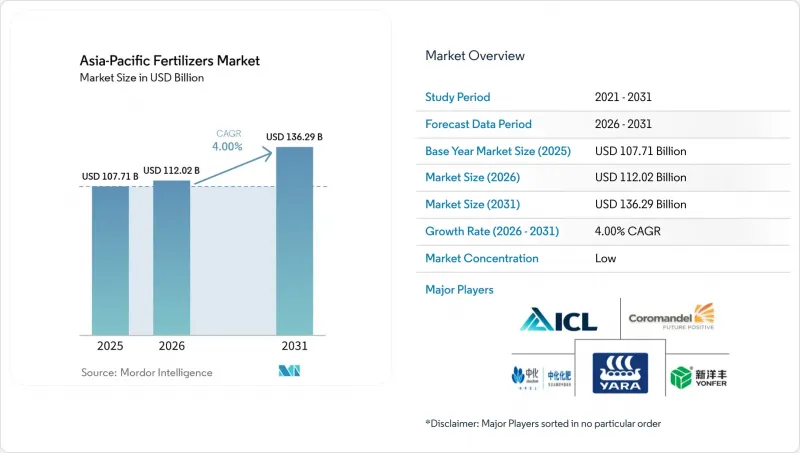
Mordor Intelligence에 의하면, 아시아태평양의 비료 시장 규모는 2025년 1,077억 1,000만 달러로 평가되었습니다. 2026년에는 1,120억 2,000만 달러로 확대되어 2031년까지 1,362억 9,000만 달러에 이를 것으로 예상되며, 예측 기간(2026-2031년) CAGR은 4.0%를 나타낼 전망입니다.
본 보고서는 유형(복합비료 및 단일비료), 형태(기존 및 특수형), 시비 방법(시비 관개, 엽면 시비, 토양 시비), 작물 유형(밭작물, 원예작물, 잔디 및 관상용 작물), 그리고 지역(호주, 방글라데시, 중국, 인도, 인도네시아, 일본, 파키스탄 등)별로 분류되어 있습니다. 시장 전망은 금액(달러) 및 수량(미터톤) 단위로 제시되어 있습니다.
아시아태평양의 비료 시장 동향 및 인사이트
인도와 중국의 보조금 제도 개편에 따라, 수요는 균형 잡힌 비료 시비 방식으로 전환되고 있습니다.
인도의 "영양소 기반 보조금" 이 제도와 중국의 유사한 개혁 조치로 인해 요소와 복합비료의 가격 격차가 줄어들면서, 생산자들은 균형 잡힌 NPK 배합비료나 특수 미량영양소로 전환하고 있습니다. 이러한 정책의 통합은 질소 과다 사용을 억제하면서도 토양의 비옥도를 향상시키는 고농도 제품에 대한 수요 증가를 뒷받침하고 있습니다. 다양한 제품 포트폴리오를 보유한 전통 있는 제조업체들은 가격 결정력을 강화하고 있는 반면, 범용 요소 공급업체들은 이익률 감소에 직면해 있습니다. 각 기업은 배합 등록 및 유통 시스템을 끊임없이 변화하는 지방자치단체의 보조금 규정에 맞추어야 하기 때문에 공급망이 점점 더 복잡해지고 있습니다. 이러한 변화로 인해 아시아태평양의 비료 시장의 프리미엄 부문이 강화되고 있습니다.
정부가 자금을 지원하는 '토양 건강 카드' 이러한 노력 덕분에 미량영양소의 도입이 확대되고 있습니다.
인도에서 2억 2,000만 장 이상 배포된 '토양 건강 카드' 이는 주요 곡물 생산 지역 전반에 걸쳐 아연, 붕소, 철분 결핍이 확인되었음을 보여주며, 대상 지역을 선별한 미량영양소 비료의 도입을 촉진하고 있습니다. 데이터에 기반한 처방전을 통해 생산자들은 가격 프리미엄을 누리면서도 측정 가능한 수확량 향상을 가져다주는 맞춤형 배합을 도입하도록 장려받고 있습니다. 이 제조업체는 작물 및 지역에 특화된 미량영양소 패키지를 제공하는 한편, 분석 결과를 정확한 사용 지침으로 전환해 주는 농업 자문 팀에 투자하고 있습니다. 방글라데시와 파키스탄에서 진행되고 있는 이와 같은 노력 덕분에, 남아시아는 아시아태평양의 비료 시장의 장기적인 성장 동력으로서의 입지를 확고히 다져가고 있습니다.
암모니아와 인산염 원자재 가격의 변동이 생산자의 이익률을 압박하고 있습니다.
야라사는 2025년 1분기에 8,500만 달러, 2분기에 2억 2,500만 달러의 천연가스 비용이 증가했으며, 이는 에너지 가격 변동에 대한 취약성이 매출총이익률을 압박하고 있음을 여실히 보여주고 있습니다. 수입 암모니아와 인광석에 의존하는 아시아의 소규모 생산자들은 비용 전가 위험이 현저하며, 가격이 급등할 경우 가동률을 낮출 수도 있습니다. 가격 변동이 장기화되면 생산자의 예산 수립 주기가 복잡해져, 아시아태평양의 비료 시장에서 고부가가치 비료의 도입이 지연될 가능성이 있습니다.
부문별 분석
2025년, 아시아태평양의 비료 시장 점유율 중 59.0%를 단일 성분 비료가 차지했습니다. 이는 주요 작물 생산 시스템에서 질소, 인, 칼륨을 각각 따로 시비하는 방식이 널리 보급되어 있기 때문입니다. 질소계 비료, 특히 질소 함량 46%인 요소는 비용 대비 효과가 뛰어나고 중국과 인도에서 광범위하게 사용됨에 따라 계속해서 수요를 견인하고 있습니다. 인산계 및 칼륨계 비료는 작물의 생산성을 높이는 데 여전히 필수적이지만, 토양 영양 결핍에 대한 인식이 높아짐에 따라 아연 등의 미량영양소 사용이 확대되고 있습니다.
복합비료는 가장 빠르게 성장할 부문이 될 것으로 예상되며, 2026년부터 2031년까지 연평균 성장률(CAGR) 5.4%를 나타낼 것으로 전망됩니다. 이러한 성장은 영양분 이용 효율을 높이고 시비 과정을 간소화하는 균형 잡힌 영양 배합에 대한 수요가 증가함에 기인합니다. 2026년에 인도가 시행할 48억 달러 규모의 영양소 기반 보조금 제도나, 중국의 비료 공급 확보를 위한 조치와 같은 정부의 이니셔티브들이 해당 지역 전체에서 이러한 제도의 도입을 더욱 촉진하고 있습니다. 또한, 정밀 농업의 실천 확대가 예측 기간 동안 복합비료 수요를 견인할 것으로 전망됩니다.
2025년에는 기존 비료가 매출의 72.0%를 차지했으나, 생산자와 규제 당국이 영양소 이용 효율을 점점 더 중요시함에 따라 특수 비료 시장은 2031년까지 연평균 성장률(CAGR) 7.1%로 확대될 것으로 전망됩니다. 원예 지역에서의 비료 및 관개 기술의 광범위한 도입에 힘입어, 수용성 제품이 성장률 1위를 차지하고 있습니다. 또한, 노동력 부족과 침출로 인한 손실이 일회성 비료에 대한 수요를 끌어올리고 있어 방출 조절 비료 시장 점유율이 확대되고 있지만, 폴리머 유래 미세 플라스틱에 대한 감시는 점점 더 엄격해지고 있습니다.
ICL사가 AMP 홀딩스사와 체결한 1억 7,000만 달러 규모의 판매 계약은 고급 과일 및 채소용 고기능성 수용성 제품에 대한 시장의 신뢰를 입증하는 것입니다. 액체 비료는 특히 온실 및 농장에서의 기계화 추세에 힘입어, 아시아태평양의 비료 시장의 고기능성 부문에 더욱 탄력을 불어넣고 있습니다.
기타 혜택 :
- 엑셀 형식 시장 예측(ME) 시트
- 3개월간의 애널리스트 지원
목차
제1장 서론
제2장 보고서의 내용
제3장 주요 요약 및 주요 조사 결과
제4장 주요 업계 동향
제5장 시장 규모 및 성장 예측
제6장 경쟁 구도
제7장 비료 업계 CEO가 직면하는 중요 전략적 과제
KTHAccording to Mordor Intelligence, the asia-Pacific fertilizers market size is projected to grow from USD 107.71 billion in 2025 to USD 112.02 billion in 2026 and is forecast to reach USD 136.29 billion by 2031, registering a CAGR of 4.0% during the forecast period (2026-2031).
This report is Segmented by Type (Complex and Straight), by Form (Conventional and Specialty), by Application Mode (Fertigation, Foliar, and Soil), by Crop Type (Field Crops, Horticultural Crops, and Turf and Ornamental), and by Geography (Australia, Bangladesh, China, India, Indonesia, Japan, Pakistan, and More). The Market Forecasts are Provided in Terms of Value (USD) and Volume (Metric Tons).
Asia-Pacific Fertilizers Market Trends and Insights
Subsidy rationalization in India and China is shifting demand toward balanced fertilization
India's Nutrient-Based Subsidy framework and China's parallel reforms narrow the cost gap between urea and complex fertilizers, steering growers toward balanced NPK blends and specialty micronutrients. The converging policies underpin stronger demand for high-analysis products that improve soil fertility while moderating nitrogen overuse. Established producers with diversified portfolios gain pricing power, whereas commodity urea suppliers confront shrinking margins. Supply-chain complexity increases as companies must align formulation registration and distribution systems with evolving sub-national subsidy codes. The shift strengthens the premium tier of the Asia-Pacific fertilizers market.
Government-funded soil health card initiatives are improving micronutrient adoption
More than 220 million soil health cards distributed in India reveal zinc, boron, and iron deficiencies across key cereal belts, galvanizing targeted micronutrient fertilizer uptake. Data-driven prescriptions encourage growers to adopt custom blends that command price premiums yet deliver measurable yield gains. Manufacturers respond with crop- and region-specific micronutrient packs while investing in agronomy advisory teams that translate analytical results into precise usage guidelines. Similar initiatives in Bangladesh and Pakistan position South Asia as a long-run growth engine for the Asia-Pacific fertilizers market.
Volatile ammonia and phosphate feedstock prices are squeezing producer margins
Yara projects natural gas cost increases of USD 85 million for Q1 2025 and USD 225 million for Q2 2025, underscoring susceptibility to energy price swings that compress gross margins. Smaller Asian producers reliant on imported ammonia or phosphate rock face pronounced cost pass-through risks, occasionally curtailing operating rates during spike episodes. Extended price turbulence complicates growers' budgeting cycles and may delay the adoption of premium fertilizers within the Asia-Pacific fertilizers market.
Other drivers and restraints analyzed in the detailed report include:
- Surge in specialty fertilizer capacity expansions across Southeast Asia
- Rising horticulture exports from Vietnam and Thailand propelling water-soluble demand
- Stringent Chinese export quotas limiting regional supply security
For complete list of drivers and restraints, kindly check the Table Of Contents.
Segment Analysis
Straight fertilizers accounted for 59.0% of the Asia-Pacific fertilizers market share in 2025, driven by the prevalent use of separate nitrogen, phosphorus, and potassium applications in major crop production systems. Nitrogenous fertilizers, particularly urea with its 46% nitrogen content, continue to lead demand due to their cost-effectiveness and widespread use in China and India. Phosphatic and potassic fertilizers remain critical for enhancing crop productivity, while increasing awareness of soil nutrient deficiencies is encouraging the adoption of micronutrients such as zinc.
Complex fertilizers are anticipated to be the fastest-growing segment, with a projected CAGR of 5.4% from 2026 to 2031. This growth is attributed to rising demand for balanced nutrient formulations that enhance nutrient-use efficiency and simplify fertilizer application processes. Government initiatives, such as India's USD 4.8 billion nutrient-based subsidy scheme for 2026 and measures to ensure fertilizer availability in China, are further promoting adoption across the region. Additionally, the expansion of precision farming practices is projected to drive demand for complex fertilizers throughout the forecast period.
Conventional fertilizers accounted for 72.0% of revenue in 2025, while specialty fertilizers are projected to expand at a CAGR of 7.1% through 20231 as growers and regulators increasingly prioritize nutrient-use efficiency. Water-soluble products top the growth leaderboard, encouraged by widespread fertigation rollouts in horticulture zones. Controlled-release fertilizers gain share as labor scarcity and leaching losses push demand for single-shot applications, though scrutiny of polymer microplastics is intensifying.
ICL's USD 170 million distribution pact with AMP Holdings underscores commercial confidence in specialty water-soluble offerings for premium fruit and vegetable crops. Liquid fertilizers ride the mechanization trend, especially in greenhouse and plantation settings, adding further momentum to the specialty segment within the Asia-Pacific fertilizers market.
Complete Report Scope:
- Type
- Complex
- Straight
- Micronutrients
- Boron
- Copper
- Iron
- Manganese
- Molybdenum
- Zinc
- Others
- Nitrogenous
- Ammonium Nitrate
- Anhydrous Ammonia
- Urea
- Others
- Phosphatic
- DAP
- MAP
- SSP
- TSP
- Others
- Potassic
- MoP
- SoP
- Others
- Secondary Macronutrients
- Calcium
- Magnesium
- Sulfur
- Micronutrients
- Form
- Conventional
- Speciality
- CRF
- Liquid Fertilizer
- SRF
- Water Soluble
- Application Mode
- Fertigation
- Foliar
- Soil
- Crop Type
- Field Crops
- Horticultural Crops
- Turf & Ornamental
- Country
- Australia
- Bangladesh
- China
- India
- Indonesia
- Japan
- Pakistan
- Philippines
- Thailand
- Vietnam
- Rest of Asia-Pacific
List of Companies Covered in this Report:
- Coromandel International Ltd.
- Grupa Azoty S.A. (Compo Expert)
- Haifa Group
- Hebei Sanyuanjiuqi Fertilizer Co., Ltd.
- ICL Group Ltd
- Sinofert Holdings Limited
- Sociedad Quimica y Minera de Chile SA
- Xinyangfeng Agricultural Technology Co., Ltd.
- Yara International ASA
- Zhongchuang xingyuan chemical technology co.ltd
- Koch Agronomic Services, LLC
- Nutrien Ltd.
- Shandong Hualu-Hengsheng Chemical Co., Ltd.
- Florikan ESA LLC
- Kingenta Ecological Engineering Group Co., Ltd.
Additional Benefits:
- The market estimate (ME) sheet in Excel format
- 3 months of analyst support
TABLE OF CONTENTS
1 INTRODUCTION
- 1.1 Study Assumptions & Market Definition
- 1.2 Scope of the Study
- 1.3 Research Methodology
2 REPORT OFFERS
3 EXECUTIVE SUMMARY & KEY FINDINGS
4 KEY INDUSTRY TRENDS
- 4.1 Acreage Of Major Crop Types
- 4.1.1 Field Crops
- 4.1.2 Horticultural Crops
- 4.2 Average Nutrient Application Rates
- 4.2.1 Micronutrients
- 4.2.1.1 Field Crops
- 4.2.1.2 Horticultural Crops
- 4.2.2 Primary Nutrients
- 4.2.2.1 Field Crops
- 4.2.2.2 Horticultural Crops
- 4.2.3 Secondary Macronutrients
- 4.2.3.1 Field Crops
- 4.2.3.2 Horticultural Crops
- 4.2.1 Micronutrients
- 4.3 Agricultural Land Equipped For Irrigation
- 4.4 Regulatory Framework
- 4.5 Value Chain & Distribution Channel Analysis
- 4.6 Market Drivers
- 4.6.1 Subsidy rationalization in India and China shifting demand toward balanced fertilization
- 4.6.2 Government-funded soil health card initiatives improving micronutrient adoption
- 4.6.3 Surge in specialty fertilizer capacity expansions across Southeast Asia
- 4.6.4 Rising horticulture exports from Vietnam and Thailand propelling water-soluble demand
- 4.6.5 Carbon-credit monetization pilot projects rewarding low-emission fertilizers
- 4.6.6 Coastal aquaculture nutrient-leakage restrictions driving sulfur-coated products
- 4.7 Market Restraints
- 4.7.1 Volatile ammonia and phosphate feedstock prices squeezing producer margins
- 4.7.2 Stringent Chinese export quotas limiting regional supply security
- 4.7.3 Proliferation of counterfeit fertilizer bags in South Asia eroding brand trust
- 4.7.4 Growing micro-plastic scrutiny on polymer-coated CRFs
5 MARKET SIZE AND GROWTH FORECASTS (VALUE AND VOLUME)
- 5.1 Type
- 5.1.1 Complex
- 5.1.2 Straight
- 5.1.2.1 Micronutrients
- 5.1.2.1.1 Boron
- 5.1.2.1.2 Copper
- 5.1.2.1.3 Iron
- 5.1.2.1.4 Manganese
- 5.1.2.1.5 Molybdenum
- 5.1.2.1.6 Zinc
- 5.1.2.1.7 Others
- 5.1.2.2 Nitrogenous
- 5.1.2.2.1 Ammonium Nitrate
- 5.1.2.2.2 Anhydrous Ammonia
- 5.1.2.2.3 Urea
- 5.1.2.2.4 Others
- 5.1.2.3 Phosphatic
- 5.1.2.3.1 DAP
- 5.1.2.3.2 MAP
- 5.1.2.3.3 SSP
- 5.1.2.3.4 TSP
- 5.1.2.3.5 Others
- 5.1.2.4 Potassic
- 5.1.2.4.1 MoP
- 5.1.2.4.2 SoP
- 5.1.2.4.3 Others
- 5.1.2.5 Secondary Macronutrients
- 5.1.2.5.1 Calcium
- 5.1.2.5.2 Magnesium
- 5.1.2.5.3 Sulfur
- 5.1.2.1 Micronutrients
- 5.2 Form
- 5.2.1 Conventional
- 5.2.2 Speciality
- 5.2.2.1 CRF
- 5.2.2.2 Liquid Fertilizer
- 5.2.2.3 SRF
- 5.2.2.4 Water Soluble
- 5.3 Application Mode
- 5.3.1 Fertigation
- 5.3.2 Foliar
- 5.3.3 Soil
- 5.4 Crop Type
- 5.4.1 Field Crops
- 5.4.2 Horticultural Crops
- 5.4.3 Turf & Ornamental
- 5.5 Country
- 5.5.1 Australia
- 5.5.2 Bangladesh
- 5.5.3 China
- 5.5.4 India
- 5.5.5 Indonesia
- 5.5.6 Japan
- 5.5.7 Pakistan
- 5.5.8 Philippines
- 5.5.9 Thailand
- 5.5.10 Vietnam
- 5.5.11 Rest of Asia-Pacific
6 COMPETITIVE LANDSCAPE
- 6.1 Key Strategic Moves
- 6.2 Market Share Analysis
- 6.3 Company Landscape
- 6.4 Company Profiles (Includes Global Level Overview, Market Level Overview, Core Business Segments, Financials, Key Information, Market Rank, Market Share, Products and Services, and Analysis of Recent Developments).
- 6.4.1 Coromandel International Ltd.
- 6.4.2 Grupa Azoty S.A. (Compo Expert)
- 6.4.3 Haifa Group
- 6.4.4 Hebei Sanyuanjiuqi Fertilizer Co., Ltd.
- 6.4.5 ICL Group Ltd
- 6.4.6 Sinofert Holdings Limited
- 6.4.7 Sociedad Quimica y Minera de Chile SA
- 6.4.8 Xinyangfeng Agricultural Technology Co., Ltd.
- 6.4.9 Yara International ASA
- 6.4.10 Zhongchuang xingyuan chemical technology co.ltd
- 6.4.11 Koch Agronomic Services, LLC
- 6.4.12 Nutrien Ltd.
- 6.4.13 Shandong Hualu-Hengsheng Chemical Co., Ltd.
- 6.4.14 Florikan ESA LLC
- 6.4.15 Kingenta Ecological Engineering Group Co., Ltd.