
|
시장보고서
상품코드
2073618
중국의 비료 : 시장 점유율 분석, 업계 동향 및 통계, 성장 예측(2026-2031년)China Fertilizers - Market Share Analysis, Industry Trends & Statistics, Growth Forecasts (2026 - 2031) |
||||||
 Mordor Intelligence
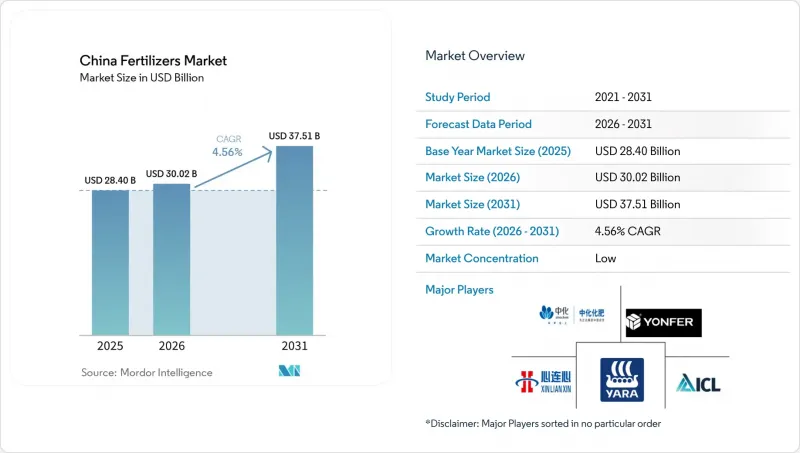
Mordor Intelligence에 의하면, 중국의 비료 시장 규모는 2025년 284억 달러로 평가되었습니다. 2026년에는 300억 2,000만 달러로 확대되어 2026년부터 2031년에 걸쳐 CAGR 4.56%로 성장을 지속하여, 2031년에는 375억 1,000만 달러에 이를 것으로 예측됩니다.
본 보고서는 유형(복합비료 및 단일비료), 형태(기존 및 특수형), 시비 방법(시비 관개, 엽면 시비, 토양 시비), 그리고 작물 유형(밭작물, 원예작물, 잔디 및 관상용 작물)별로 분류되어 있습니다. 시장 전망은 금액(달러) 및 수량(메트릭 톤) 단위로 제시되어 있습니다.
중국의 비료 시장 동향 및 인사이트
정부의 비료 사용 보조금 제도
농업농촌의 프로그램에 따라, 균형 잡힌 비료 시비 및 토양 개량을 위한 정부의 직접 보조금은 중국 전역의 농업 지역에서 영양소 수요를 가속화하고 있습니다. 농업 기계 구입 보조금 프로그램은 정밀 시비 장비의 지원 대상을 확대하여, 2024년에는 지원 대상 농가에 대한 보조율이 30%에 달했습니다. 이러한 정책 개입은 효율성 향상 제품의 높은 가격 책정을 뒷받침하는 인위적인 수요 탄력성을 창출하는 동시에, 대상 영양소 카테고리의 판매량 증가를 촉진하고 있습니다. 이 보조금 제도는 기존 비료에 비해 측정 가능한 효율 향상을 보이는 방출 조절 비료나 수용성 비료에 특히 유리하게 작용하고 있습니다. 정책 이행 상황은 부처마다 크게 다르며, 주요 곡물 생산 지역에는 그에 비례하여 높은 보조금이 배정되고 있어 지역 간 경쟁 구도에 왜곡이 발생하고 있습니다.
농작물의 수확량과 품질 향상을 위한 지속적인 압박
중국의 국가 농업 전략에 포함된 식량 안보 의무는 모든 작물 부문에서 비료 시비량에 대해 지속적인 상승 압력을 야기하고 있습니다. 국무원의 '다양한 식량 공급 체계에 관한 의견'은 제한된 경작지의 확대를 보완하기 위해 헥타르당 수확량 극대화를 강조하고 있으며, 이는 직접적으로 영양소 투입량 증가로 이어집니다. 이 정책 체계는 시장 가격 신호와 별개로 기능하고 있어, 농산물 가격이 변동하는 시기에도 비료 제품에 대한 수요 탄력성을 낮추고 있습니다. 지역 차원의 시행에 있어서는 평균 생산성과 잠재 생산성 간의 생산량 격차를 해소하는 데 중점을 두고 있으며, 특히 국가의 식량 안보 목표의 기반이 되는 곡물 작물이 중시되고 있습니다. 도시화로 인해 이용 가능한 농지가 줄어들고 있는 지역에서는 이러한 압박이 더욱 심화되고 있으며, 남아 있는 농지에 대해 집약적인 비료 시비를 통해 더 높은 생산성을 달성해야 할 필요가 있습니다.
더 엄격한 영양염류 유출 규제와 검사 체계
새로운 토양 품질 기준 "GB 15618" 한편, 과도한 질산염 침출 및 인 유출에 대해 벌칙이 부과되고 있으며, 이로 인해 환경적으로 민감한 농업 지역 전반에 걸쳐 비료 시비량을 억제하기 위한 규정 준수 비용이 발생하고 있습니다. 생태환경부는 유역 내 영양염 부하를 추적하는 실시간 모니터링 시스템을 도입해 검사 절차를 강화하고 있으며, 농가들은 시비량을 줄이지 않으면 막대한 벌금을 물게 될 상황에 직면해 있습니다. 이러한 규제상의 제약은 농업학적 최적화와는 별개로 작용하기 때문에 수확량을 극대화하는 시비량이 법적으로 허용되는 시비 수준을 초과하는 상황이 발생하고 있습니다. 규정 준수 요건에 따라, 더 적은 시비량으로 동등한 영양가를 제공하는 고효율 제품이 우대받고 있지만, 농가들이 시비 방법을 조정하는 과도기 동안에는 시장에 혼란이 발생하고 있습니다.
부문별 분석
복합비료는 가장 큰 부문으로, 2025년에는 중국의 비료 시장 점유율의 56.2%를 차지했으며, 2031년까지 연평균 성장률(CAGR) 6.0%로 가장 높은 성장률을 나타낼 것으로 전망됩니다. 복합비료 부문은 특정 작물의 요구 사항이나 토양 조건에 맞추어 조정된 영양 비율을 중시하는 정밀 농업의 추세로부터 혜택을 보고 있습니다. NPK 복합비료는 주요 작물 범주에 맞추어 균형 잡힌 영양 비율을 규정하고 있는 확립된 농업학적 프로토콜에 기반을 두고 있으며, 복합비료 부문에서 지배적인 위치를 차지하고 있습니다. 미량영양소와 2차 다량 영양소를 배합한 특수 복합 비료는 토양 검사 프로그램을 통해 파악된 특정 영양소 결핍을 해결하는 동시에 프리미엄 가격을 실현하고 있습니다.
이 부문이 주목을 받고 있는 주된 이유는 한 번의 시비로 여러 가지 영양소를 공급할 수 있어 농가에게 매우 효율적이라는 점에 있습니다. 복합비료는 중국의 도시 녹화 분야에서 특히 중요하며, 관상용 수목과 고품질 잔디의 유지 관리, 온실 내 꽃 재배에 중요한 역할을 하고 있습니다. 또한, 중국의 비료 총 소비량의 약 절반을 차지하는 NPK 비료에 대한 의존도가 높아지고 있는 점도 이 부문의 강점을 더욱 뒷받침하고 있습니다. 과립화 공정이 주요 제조 방식으로 자리 잡았으며, 이는 중국의 고도로 발달한 비료 생산 현황을 반영하고 있습니다.
2025년에는 확립된 제조 인프라와 가격에 민감한 농업 시장에 적합한 비용 면에서의 우위를 바탕으로, 기존 제품이 매출의 74.0%를 차지했습니다. 기존 부문에는 검증된 시비 방법 및 장비와의 호환성을 통해 영양소를 확실하게 공급하는 전통적인 입상 및 결정상 제제가 포함됩니다. 기존 제품의 대량 운송이 갖는 장점은 물류상의 복잡성을 최소화하면서도 대규모 농업 경영에 서비스를 제공하는 효율적인 유통 시스템을 뒷받침하고 있습니다. 기존 방식의 비료 생산에서 나타나는 규모의 경제는 가격에 민감한 시장 부문에서 특수 비료에 대한 경쟁 우위를 유지할 수 있는 비용 구조를 만들어내고 있습니다.
특수 제품은 2031년까지 연평균 성장률(CAGR) 6.1%라는 가장 빠른 속도로 성장할 것으로 전망됩니다. 이 부문은 정밀 농업과 현대적인 관개 방식의 도입 확대에 힘입어 급속한 발전을 이루고 있습니다. 특수 비료 부문의 약 절반을 차지하는 수용성 비료는 뛰어난 영양분 공급 효율 덕분에 특히 주목을 받고 있습니다. 이 부문의 성장은 방출 조절 비료의 장점과 지속 가능한 농업에서 그 역할에 대한 농민들의 인식이 높아지고 있는 점에 힘입어 더욱 가속화되고 있습니다. 중국 정부의 환경 보호에 대한 중시와 비료 효율 향상의 필요성이 특수 비료 배합 분야의 혁신을 촉진하고 있습니다.
기타 혜택 :
- 엑셀 형식 시장 예측(ME) 시트
- 3개월간의 애널리스트 지원
목차
제1장 서론
제2장 주요 요약 및 주요 조사 결과
제3장 보고서의 내용
제4장 주요 업계 동향
제5장 시장 규모 및 성장 예측
제6장 경쟁 구도
제7장 비료 업계 CEO가 직면하는 중요 전략적 과제
KTHAccording to Mordor Intelligence, the china fertilizer market size is projected to grow from USD 28.40 billion in 2025 to USD 30.02 billion in 2026 and is forecast to reach USD 37.51 billion by 2031 at 4.56% CAGR over 2026-2031.
This report is Segmented by Type (Complex and Straight), by Form (Conventional and Specialty), by Application Mode (Fertigation, Foliar, and Soil), and by Crop Type (Field Crops, Horticultural Crops, and Turf and Ornamental). The Market Forecasts are Provided in Terms of Value (USD) and Volume (Metric Tons)
China Fertilizers Market Trends and Insights
Government Fertilizer-Use Subsidy Schemes
Direct government subsidies for balanced fertilization and soil restoration under the Ministry of Agriculture and Rural Affairs programs are accelerating nutrient demand across China's agricultural regions. The agricultural machinery purchase subsidy program expanded to include precision fertilizer application equipment, with subsidy rates reaching 30% for eligible farmers in 2024. These policy interventions create artificial demand elasticity that supports premium pricing for efficiency-enhancing products while simultaneously driving volume growth in targeted nutrient categories. The subsidy framework particularly benefits controlled-release and water-soluble fertilizers that demonstrate measurable efficiency gains over conventional alternatives. Policy implementation varies significantly across provinces, with major grain-producing regions receiving proportionally higher subsidy allocations that distort regional competitive dynamics.
Chronic Pressure to Raise Crop Yields and Quality
Food security mandates embedded in China's national agricultural strategy create persistent upward pressure on fertilizer application intensity across all crop categories. The State Council's diversified food supply system opinion emphasizes yield maximization per hectare to offset limited arable land expansion, directly translating to increased nutrient input requirements. This policy framework operates independently of market pricing signals, creating inelastic demand for fertilizer products even during periods of agricultural commodity price volatility. Regional implementation focuses on closing yield gaps between average and potential productivity, with particular emphasis on grain crops that underpin national food security objectives. The pressure intensifies in regions where urbanization reduces agricultural land availability, forcing remaining farmland to achieve higher productivity levels through intensive fertilization practices.
Stricter Nutrient-Loss Regulations and Inspection Regimes
New GB 15618 soil quality standards impose penalties for excess nitrate leaching and phosphorus runoff, creating compliance costs that constrain fertilizer application rates across environmentally sensitive agricultural regions. The Ministry of Ecology and Environment has strengthened inspection protocols with real-time monitoring systems that track nutrient loading in watershed areas, forcing farmers to reduce application rates or face significant financial penalties . These regulatory constraints operate independently of agronomic optimization, creating situations where yield-maximizing fertilizer rates exceed legally permissible application levels. Compliance requirements favor efficiency-enhanced products that deliver equivalent nutritional value at lower application rates, but the transition period creates market disruption as farmers adjust application practices.
Other drivers and restraints analyzed in the detailed report include:
- Surge in Specialty Fertilizer Consumption
- Expansion of Protected Cultivation Acreage Needing Fertigation
- Plateauing Macronutrient Demand in Major Grain Belts
For complete list of drivers and restraints, kindly check the Table Of Contents.
Segment Analysis
Complex fertilizers are the largest segment, holding 56.2% of the China fertilizer market share in 2025, and are projected to register the fastest 6.0% CAGR through 2031. The complex segment benefits from precision agriculture trends that favor customized nutrient ratios matched to specific crop requirements and soil conditions. NPK compound fertilizers dominate the complex category, supported by established agronomic protocols that specify balanced nutrient ratios for major crop categories. Specialty complex formulations incorporating micronutrients and secondary macronutrients command premium pricing while addressing specific nutritional deficiencies identified through soil testing programs.
The segment's prominence is primarily attributed to its ability to provide multiple nutrients in a single application, making it highly efficient for farmers. Complex fertilizers are particularly crucial in China's urban greening sector, playing a vital role in maintaining decorative trees, high-quality grass, and nurturing flowers in greenhouses. The segment's strength is further reinforced by China's increasing reliance on NPK fertilizers, which typically account for about half of total fertilizer consumption. The granulation production method stands as the primary manufacturing approach, reflecting China's sophisticated fertilizer production landscape.
Conventional products accounted for 74.0% of revenue in 2025, supported by established manufacturing infrastructure and cost advantages that align with price-sensitive agricultural markets. The conventional segment encompasses traditional granular and crystalline formulations that deliver nutrients reliably through proven application methods and equipment compatibility. Bulk handling advantages in conventional products support efficient distribution systems that serve large-scale agricultural operations with minimal logistical complexity. Manufacturing scale economies in conventional fertilizer production create cost structures that maintain competitive advantages over specialty alternatives in price-sensitive market segments.
Specialty variants are forecast to expand at the fastest pace of 6.1% CAGR through 2031. This segment is experiencing rapid advancement due to the increasing adoption of precision agriculture and modern irrigation methods. Water-soluble fertilizers, which account for about half of the specialty segment, are gaining particular traction due to their superior nutrient-delivery efficiency. The segment's growth is further propelled by rising awareness among farmers about the benefits of controlled-release fertilizers and their role in sustainable agriculture. The Chinese government's emphasis on environmental protection and the need for improved fertilizer efficiency are driving innovation in specialty fertilizer formulations.
Complete Report Scope:
- Type
- Complex
- Straight
- Micronutrients
- Boron
- Copper
- Iron
- Manganese
- Molybdenum
- Zinc
- Others
- Nitrogenous
- Urea
- Others
- Phosphatic
- DAP
- MAP
- SSP
- TSP
- Potassic
- MoP
- SoP
- Others
- Secondary Macronutrients
- Calcium
- Magnesium
- Sulfur
- Micronutrients
- Form
- Conventional
- Speciality
- CRF
- Liquid Fertilizer
- SRF
- Water Soluble
- Application Mode
- Fertigation
- Foliar
- Soil
- Crop Type
- Field Crops
- Horticultural Crops
- Turf & Ornamental
List of Companies Covered in this Report:
- Sinofert Holdings Limited
- Xinyangfeng Agricultural Technology Co., Ltd.
- Henan XinlianXin Chemicals Group Company Limited
- Yara International ASA
- ICL Group Ltd
- Kingenta Ecological Engineering Group Co., Ltd.
- Compo Expert GmbH
- Haifa Chemicals Ltd.
- Nutrien Ltd.
- Yara International ASA
- Koch Agronomic Services, LLC
- SQM S.A.
- Shandong Hualu-Hengsheng Chemical Co., Ltd.
- Florikan ESA LLC
- National Fertilizers Limited
Additional Benefits:
- The market estimate (ME) sheet in Excel format
- 3 months of analyst support
TABLE OF CONTENTS
1 INTRODUCTION
- 1.1 Study Assumptions & Market Definition
- 1.2 Scope of the Study
- 1.3 Research Methodology
2 EXECUTIVE SUMMARY & KEY FINDINGS
3 REPORT OFFERS
4 KEY INDUSTRY TRENDS
- 4.1 Acreage Of Major Crop Types
- 4.1.1 Field Crops
- 4.1.2 Horticultural Crops
- 4.2 Average Nutrient Application Rates
- 4.2.1 Micronutrients
- 4.2.1.1 Field Crops
- 4.2.1.2 Horticultural Crops
- 4.2.1 Micronutrients
- 4.3 Primary Nutrients
- 4.3.1 Field Crops
- 4.3.2 Horticultural Crops
- 4.4 Secondary Macronutrients
- 4.4.1 Field Crops
- 4.4.2 Horticultural Crops
- 4.5 Agricultural Land Equipped For Irrigation
- 4.6 Regulatory Framework
- 4.7 Value Chain & Distribution Channel Analysis
- 4.8 Market Drivers
- 4.8.1 Government fertilizer?use subsidy schemes
- 4.8.2 Chronic pressure to raise crop yields and quality
- 4.8.3 Surge in specialty fertilizer consumption
- 4.8.4 Expansion of protected cultivation acreage needing fertigation
- 4.8.5 Emergence of digital agriculture platforms enabling precision dosing
- 4.8.6 Early adoption of low-carbon green ammonia production lines
- 4.9 Market Restraints
- 4.9.1 Stricter nutrient-loss regulations and inspection regimes
- 4.9.2 Plateauing macronutrient demand in major grain belts
- 4.9.3 Soil-test service bundles shifting farmers away from blanket NPK
- 4.9.4 Carbon-pricing pilots boosting production costs for high-emission plants
5 MARKET SIZE AND GROWTH FORECASTS (VALUE AND VOLUME)
- 5.1 Type
- 5.1.1 Complex
- 5.1.2 Straight
- 5.1.2.1 Micronutrients
- 5.1.2.1.1 Boron
- 5.1.2.1.2 Copper
- 5.1.2.1.3 Iron
- 5.1.2.1.4 Manganese
- 5.1.2.1.5 Molybdenum
- 5.1.2.1.6 Zinc
- 5.1.2.1.7 Others
- 5.1.2.2 Nitrogenous
- 5.1.2.2.1 Urea
- 5.1.2.2.2 Others
- 5.1.2.3 Phosphatic
- 5.1.2.3.1 DAP
- 5.1.2.3.2 MAP
- 5.1.2.3.3 SSP
- 5.1.2.3.4 TSP
- 5.1.2.4 Potassic
- 5.1.2.4.1 MoP
- 5.1.2.4.2 SoP
- 5.1.2.4.3 Others
- 5.1.2.5 Secondary Macronutrients
- 5.1.2.5.1 Calcium
- 5.1.2.5.2 Magnesium
- 5.1.2.5.3 Sulfur
- 5.1.2.1 Micronutrients
- 5.2 Form
- 5.2.1 Conventional
- 5.2.2 Speciality
- 5.2.2.1 CRF
- 5.2.2.2 Liquid Fertilizer
- 5.2.2.3 SRF
- 5.2.2.4 Water Soluble
- 5.3 Application Mode
- 5.3.1 Fertigation
- 5.3.2 Foliar
- 5.3.3 Soil
- 5.4 Crop Type
- 5.4.1 Field Crops
- 5.4.2 Horticultural Crops
- 5.4.3 Turf & Ornamental
6 COMPETITIVE LANDSCAPE
- 6.1 Key Strategic Moves
- 6.2 Market Share Analysis
- 6.3 Company Landscape
- 6.4 Company Profiles (includes Global Level Overview, Market Level Overview, Core Business Segments, Financials, Headcount, Key Information, Market Rank, Market Share, Products and Services, and Analysis of Recent Developments).
- 6.4.1 Sinofert Holdings Limited
- 6.4.2 Xinyangfeng Agricultural Technology Co., Ltd.
- 6.4.3 Henan XinlianXin Chemicals Group Company Limited
- 6.4.4 Yara International ASA
- 6.4.5 ICL Group Ltd
- 6.4.6 Kingenta Ecological Engineering Group Co., Ltd.
- 6.4.7 Compo Expert GmbH
- 6.4.8 Haifa Chemicals Ltd.
- 6.4.9 Nutrien Ltd.
- 6.4.10 Yara International ASA
- 6.4.11 Koch Agronomic Services, LLC
- 6.4.12 SQM S.A.
- 6.4.13 Shandong Hualu-Hengsheng Chemical Co., Ltd.
- 6.4.14 Florikan ESA LLC
- 6.4.15 National Fertilizers Limited