|
시장보고서
상품코드
2073619
중동 및 아프리카의 비료 : 시장 점유율 분석, 업계 동향 및 통계, 성장 예측(2026-2031년)Middle East and Africa Fertilizers - Market Share Analysis, Industry Trends & Statistics, Growth Forecasts (2026 - 2031) |
||||||
 Mordor Intelligence
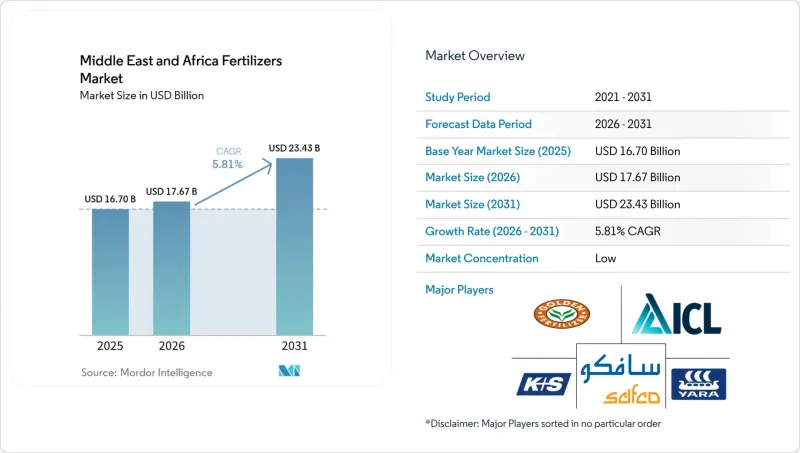
Mordor Intelligence에 의하면, 중동 및 아프리카의 비료 시장 규모는 2025년에 167억 달러로 평가되었습니다. 2026년 176억 7,000만 달러에서 2031년까지 234억 3,000만 달러에 이를 것으로 예상되며, 예측 기간(2026-2031년) CAGR은 5.81%를 나타낼 전망입니다.
본 보고서는 유형별(복합비료 및 단일비료), 형태별(기존 및 특수형), 시용 방법별(비료 관개, 엽면 시비 등), 작물별(밭작물, 원예작물, 토양), 지역별(나이지리아, 사우디아라비아, 남아프리카공화국, 튀르키예 등)로 분류되어 있습니다. 시장 전망은 금액(달러) 및 수량(미터톤) 단위로 제시되어 있습니다.
중동 및 아프리카의 비료 시장 동향 및 인사이트
지역 차원의 식량 안보 노력 확대
중동 및 아프리카 각국 정부는 비료 자급자족을 식량 주권과 직접적으로 연결 짓고 있습니다. 사우디아라비아는 2024년, 대외 의존도를 낮추기 위한 통합형 암모니아·요소 복합 시설을 목표로 하는 수입 대체 프로젝트에 12억 달러를 배정했습니다. 나이지리아의 ‘대통령 비료 이니셔티브’는 단고테사의 시설에 새로 확보된 생산 능력을 활용하여 2027년까지 비료 수입을 50% 줄이겠다는 목표를 세웠습니다. 에티오피아는 민간 투자자와 제휴하여 국내 가스 매장량을 활용하는 25억 달러 규모의 요소 공장을 건설 중이며, 40개월 이내에 연간 300만 메트르톤 규모의 생산 라인을 가동할 예정입니다. 사하라 이남 아프리카는 현재 비료의 약 80%를 수입에 의존하고 있기 때문에 새로운 공장이 하나 건설될 때마다 금융 기관이나 다국적 설비 공급업체에 긍정적인 신호가 전달됩니다. 또한, 이러한 프로젝트들은 가스 파이프라인, 철도 지선, 벌크 터미널 등 지역 공급망을 연결하는 부수적인 투자를 촉진하는 역할도 하고 있습니다.
정부의 비료 보조금 프로그램 확대
각국의 재무부는 보조금을 투입 비용과 농촌 지역의 소득을 안정시키기 위한 즉각적인 효과가 있는 수단으로 보고 있습니다. 이집트는 2024년에 보조금 총액을 35% 증액했으며, 국제 시세가 톤당 350달러를 넘는 가운데, 농가를 위한 요소 가격을 톤당 180달러로 인하했습니다. 케냐의 프로그램은 120만 명의 소규모 농가에게 혜택을 주었으며, 토양 검사 결과를 바탕으로 한 처방전과 인증된 판매점을 연결해 주는 모바일 바우처를 통해 투입 비용을 최대 50% 절감했습니다. 나이지리아는 2024년에 1,200만 포대의 보조금 지원 NPK 복합 비료를 배포했으며, 이와 함께 부정 유용을 방지하기 위해 전자 지갑 결제 시스템을 도입했습니다. 사우디아라비아는 대추야자 재배 농가를 위한 미량영양소 패키지의 농장 도착 비용 중 75%를 부담하고 있으며, 이로 인해 건조 지역에서의 정밀 영양 관리가 급속히 확산되고 있습니다. 수요를 예측할 수 있기 때문에 혼합 업체는 원료 계약을 확정하고 재고 회전율을 사전에 계획할 수 있습니다.
천연가스 가격 변동이 암모니아 가격에 미치는 영향
에너지 비용은 암모니아 생산 비용의 약 4분의 3을 차지하기 때문에 가스 가격의 변동은 요소 가격에 직접적인 영향을 미칩니다. 유럽연합(EU)은 2022년 가스 가격 급등이 정점에 달했을 때 생산 능력의 최대 70%를 중단했으며, 아프리카의 구매자들은 운임 인상과 리드타임 연장을 감수해야만 했습니다. 케냐에서는 2020년부터 2022년에 걸쳐 소매 비료 가격이 150% 상승하여, 국내 식량의 대부분을 공급하는 소규모 농가들의 주곡 수확량에 타격을 주었습니다. 수입업체들은 현재 공급처를 다각화하고 장기 가스 계약을 체결하고 있지만, 벤치마크가 되는 가스 시장의 수급이逼迫할 때마다 위험은 여전히 높은 수준을 유지하고 있습니다.
부문별 분석
2025년, 중동 및 아프리카의 비료 시장에서 단일 성분 비료는 시장 점유율의 57.9%를 차지했습니다. 정부의 지원 정책에서는 기본적인 NPK 성분에 대한 보조금이 지급되는 경향이 있어, 그로 인해 소규모 농가에게는 단일 성분 비료가 기본적인 선택지가 되고 있습니다. 곡물 생산 시스템에서 질소 비료 판매의 경우 요소가 주류를 이루는 반면, 인산계 제품에서는 DAP(이암모늄인산염)와 MAP(모노암모늄인산염)이 여전히 주요 제품으로 자리 잡고 있습니다. 중동 및 아프리카의 단일 성분 비료 시장 규모는 대량 운송에 적합한 표준화된 유통 및 보관 시스템의 혜택을 받고 있습니다.
복합비료 시장은 2026년부터 2031년까지 연평균 성장률(CAGR) 7.2%를 기록하며 가장 빠르게 성장하는 부문이 될 것으로 전망됩니다. 이들은 원예, 관개 재배의 현금 작물, 그리고 정확한 영양분 비율이 필요한 수출 지향형 농장에서 매우 중요한 역할을 하고 있습니다. SP2M 계획에 따른 모로코의 생산 능력 확대로 인해 북아프리카 전역에서 복합비료 생산량이 증가하게 되며, 다량 영양소와 미량영양소 패키지를 조합하여 각 농지의 필요에 맞춘 배합이 제공될 것입니다. 이 비료의 도입이 가장 활발한 곳은 남아프리카공화국처럼 토양 검사가 의무화되어 있는 지역, 금융 기관이 대출 조건으로 농업적 처방전을 요구하는 지역입니다.
2025년, 중동 및 아프리카의 비료 시장에서 기존 입상 비료는 83.5%의 점유율을 차지했습니다. 널리 보급되어 있다는 점, 견고한 공급망, 그리고 기존 설비와의 호환성이 그 우위를 뒷받침하고 있습니다. 각 생산사는 비용 경쟁력을 유지하기 위해 이집트 아부 키르 지역의 천연가스 이용 효율 향상 등 에너지 절약 개보수 사업에 투자하고 있습니다.
특수 비료, 방출 조절 비료의 일종, 수용성 비료 및 엽면 시비용 액체 비료는 규모는 작지만 빠르게 성장하고 있는 틈새 시장을 차지하고 있으며, 2026년부터 2031년까지 연평균 성장률(CAGR) 9.3%로 성장할 것으로 전망됩니다. 걸프 연안 국가들의 온실에서 점적 관개 면적이 확대되고, 튀르키예 원예 분야에서 수경 재배가 보급되면서 완전 수용성 제품에 대한 수요가 증가하고 있습니다. 서방형 코팅은 인력이 제한된 외딴 지역의 생산자들에게 매력적이며, 시비 빈도를 줄이고 모래질 토양에서의 영양분 손실을 감소시킵니다.
기타 혜택 :
- 엑셀 형식 시장 예측(ME) 시트
- 3개월간의 애널리스트 지원
목차
제1장 서론
제2장 보고서의 내용
제3장 주요 요약 및 주요 조사 결과
제4장 주요 업계 동향
제5장 시장 규모 및 성장 예측
제6장 경쟁 구도
제7장 비료 업계 CEO가 직면하는 중요 전략적 과제
KTHAccording to Mordor Intelligence, the middle east and Africa fertilizers market size was valued at USD 16.70 billion in 2025 and estimated to grow from USD 17.67 billion in 2026 to reach USD 23.43 billion by 2031, at a CAGR of 5.81% during the forecast period (2026-2031).
This report is Segmented by Type (Complex and Straight), by Form (Conventional and Specialty), by Application Mode (Fertigation, Foliar, and More), by Crop Type (Field Crops, Horticultural Crops, and Soil), and by Geography (Nigeria, Saudi Arabia, South Africa, Turkey, and More). The Market Forecasts are Provided in Terms of Value (USD) and Volume (Metric Tons).
Middle East and Africa Fertilizers Market Trends and Insights
Rising Regional Food Security Initiatives
Middle East and African governments are tying fertilizer self-sufficiency directly to food sovereignty. Saudi Arabia earmarked USD 1.2 billion for import-substitution projects in 2024, targeting integrated ammonia and urea complexes that reduce external dependence. Nigeria's Presidential Fertilizer Initiative set a goal to trim fertilizer imports by 50% by 2027, leveraging new capacity at Dangote facilities. Ethiopia partnered with a private investor to build a USD 2.5 billion urea plant that will tap domestic gas reserves, bringing 3 million metric tons annual line online within 40 months. Sub-Saharan Africa currently imports roughly 80% of its fertilizer, so each new plant sends a positive signal to lenders and multinational equipment suppliers. These projects also catalyze ancillary investments in gas pipelines, rail spurs, and bulk terminals that knit the regional supply chain together.
Expansion of Government Fertilizer Subsidy Programs
National treasuries view subsidies as a fast-acting lever to stabilize input costs and rural incomes. Egypt raised its subsidy pool by 35% in 2024, cutting farmer urea prices to USD 180 per metric ton against international quotes above USD 350 per metric ton. Kenya's program reached 1.2 million smallholders, slashing input costs by up to 50% through mobile vouchers that link soil-test prescriptions to verified dealer outlets. Nigeria distributed 12 million bags of subsidized NPK blends in 2024 and combined the roll-out with e-wallet payments that curb leakages. Saudi Arabia covers 75% of the landed cost of micronutrient packages for date-palm growers, prompting a surge in precision nutrition adoption on arid plots. Predictable offtake allows blenders to lock in feedstock contracts and plan inventory turns in advance.
Volatile Natural Gas Linked Ammonia Prices
Energy represents roughly three-quarters of ammonia production cost, so swings in gas prices ripple straight into urea quotations. The European Union shuttered up to 70% of its capacity at the height of the 2022 gas spike, forcing African buyers to absorb freight premiums and longer lead times. Kenya experienced retail fertilizer prices that climbed 150% between 2020 and 2022, denting staple-crop yields among the smallholders who supply most domestic food. Importers now diversify suppliers and use longer-tenor gas contracts, yet risk remains elevated whenever benchmark gas trade tightens.
Other drivers and restraints analyzed in the detailed report include:
- Increasing Adoption of Specialty and Slow-Release Fertilizers
- Rising Investments in Modern Irrigation Systems
- Persistent Logistical Bottlenecks at Key Red Sea Ports
For complete list of drivers and restraints, kindly check the Table Of Contents.
Segment Analysis
Straight formulations accounted for 57.9% of the Middle East and Africa fertilizers market share in 2025. Government programs tend to subsidize basic NPK components, making single-nutrient grades the default choice among smallholders. Urea leads nitrogen sales for cereal production systems, whereas DAP and MAP remain the principal phosphatic products. The Middle East and Africa fertilizers market size for straight grades benefits from standardized distribution and storage systems that favor bulk handling.
Complex fertilizers are projected to be the fastest-growing segment, with a CAGR of 7.2% through 2026 to 2031. They play a crucial role in horticulture, irrigated cash crops, and export-oriented farms that demand precise nutrient ratios. Morocco's capacity expansion under the SP2M plan will lift blended output across North Africa, offering site-specific formulations that pair macronutrients with micronutrient packages. Uptake is strongest where soil-testing mandates exist, such as in South Africa, or where lenders tie credit to agronomic prescriptions.
Conventional granules captured 83.5% share of the Middle East and Africa fertilizers market in 2025. Broad familiarity, robust supply chains, and equipment compatibility underpin their dominance. Producers are investing in energy-saving revamps, such as Egypt's Abu Qir natural gas efficiency upgrade, to keep cost curves competitive.
Specialty fertilizers, grades of controlled-release fertilizers, water-soluble fertilizers, and foliar liquids occupy a small yet fast-rising niche, projected to grow at a CAGR of 9.3% during 2026-2031. Drip-irrigated acreage expansion in Gulf greenhouses and the spread of hydroponics in Turkish horticulture fuel demand for fully soluble products. Slow-release coatings appeal to remote growers with limited labor, reducing application frequency and nutrient loss in sandy soils.
Complete Report Scope:
- Type
- Complex
- Straight
- Micronutrients
- Boron
- Copper
- Iron
- Manganese
- Molybdenum
- Zinc
- Others
- Nitrogenous
- Ammonium Nitrate
- Urea
- Others
- Phosphatic
- Diammonium Phosphate (DAP)
- Monoammonium Phosphate (MAP)
- Single Super Phosphate (SSP)
- Triple Super Phosphate (TSP)
- Others
- Potassic
- Muriate of Potash (MoP)
- Sulfate of Potash (SoP)
- Others
- Secondary Macronutrients
- Calcium
- Magnesium
- Sulfur
- Micronutrients
- Form
- Conventional
- Specialty
- Controlled Release Fertilizer (CRF)
- Liquid Fertilizer
- Slow Release Fertilizer (SRF)
- Water Soluble
- Application Mode
- Fertigation
- Foliar
- Soil
- Crop Type
- Field Crops
- Horticultural Crops
- Turf and Ornamental
- Geography
- Nigeria
- Saudi Arabia
- South Africa
- Turkey
- Rest of Middle East and Africa
List of Companies Covered in this Report:
- Yara International ASA
- SABIC Agri-Nutrients Company (Saudi Basic Industries Corporation)
- OCP Group
- Ma'aden Phosphate Company (Saudi Arabian Mining Company - Ma'aden)
- Qatar Fertiliser Company QAFCO (Industries Qatar)
- ICL Group Ltd
- K+S Aktiengesellschaft
- EuroChem Group AG
- PhosAgro PJSC
- Fertiglobe PLC (OCI N.V.)
- Omnia Fertilizer (Pty) Ltd (Omnia Holdings Ltd)
- Dangote Fertilizer Ltd (Dangote Industries Ltd)
- Indorama Eleme Fertilizer and Chemicals Ltd (Indorama Corporation)
- Haifa Group
- Jordan Phosphate Mines Company PLC
- Golden Fertilizer Company Limited
Additional Benefits:
- The market estimate (ME) sheet in Excel format
- 3 months of analyst support
TABLE OF CONTENTS
1 INTRODUCTION
- 1.1 Study Assumptions and Market Definition
- 1.2 Scope of the Study
- 1.3 Research Methodology
2 REPORT OFFERS
3 EXECUTIVE SUMMARY AND KEY FINDINGS
4 KEY INDUSTRY TRENDS
- 4.1 Acreage of Major Crop Types
- 4.1.1 Field Crops
- 4.1.2 Horticultural Crops
- 4.2 Average Nutrient Application Rates
- 4.2.1 Micronutrients
- 4.2.1.1 Field Crops
- 4.2.1.2 Horticultural Crops
- 4.2.2 Primary Nutrients
- 4.2.2.1 Field Crops
- 4.2.2.2 Horticultural Crops
- 4.2.3 Secondary Macronutrients
- 4.2.3.1 Field Crops
- 4.2.3.2 Horticultural Crops
- 4.2.1 Micronutrients
- 4.3 Agricultural Land Equipped For Irrigation
- 4.4 Regulatory Framework
- 4.5 Value Chain and Distribution Channel Analysis
- 4.6 Market Drivers
- 4.6.1 Rising regional food security initiatives
- 4.6.2 Expansion of government fertilizer subsidy programs
- 4.6.3 Increasing adoption of specialty and slow-release fertilizers
- 4.6.4 Rising investments in modern irrigation systems
- 4.6.5 Shift toward sulfur-enriched blends for oil-seed crop rotations
- 4.6.6 Growing use of desalinated water driving demand for micronutrients
- 4.7 Market Restraints
- 4.7.1 Volatile natural gas linked ammonia prices
- 4.7.2 Persistent logistical bottlenecks at key Red Sea ports
- 4.7.3 Regulatory pushback on cadmium levels in imported phosphates
- 4.7.4 Rising farmer preference for biologicals in high-value crops
5 Market Size and Growth Forecasts (Value and Volume)
- 5.1 Type
- 5.1.1 Complex
- 5.1.2 Straight
- 5.1.2.1 Micronutrients
- 5.1.2.1.1 Boron
- 5.1.2.1.2 Copper
- 5.1.2.1.3 Iron
- 5.1.2.1.4 Manganese
- 5.1.2.1.5 Molybdenum
- 5.1.2.1.6 Zinc
- 5.1.2.1.7 Others
- 5.1.2.2 Nitrogenous
- 5.1.2.2.1 Ammonium Nitrate
- 5.1.2.2.2 Urea
- 5.1.2.2.3 Others
- 5.1.2.3 Phosphatic
- 5.1.2.3.1 Diammonium Phosphate (DAP)
- 5.1.2.3.2 Monoammonium Phosphate (MAP)
- 5.1.2.3.3 Single Super Phosphate (SSP)
- 5.1.2.3.4 Triple Super Phosphate (TSP)
- 5.1.2.3.5 Others
- 5.1.2.4 Potassic
- 5.1.2.4.1 Muriate of Potash (MoP)
- 5.1.2.4.2 Sulfate of Potash (SoP)
- 5.1.2.4.3 Others
- 5.1.2.5 Secondary Macronutrients
- 5.1.2.5.1 Calcium
- 5.1.2.5.2 Magnesium
- 5.1.2.5.3 Sulfur
- 5.1.2.1 Micronutrients
- 5.2 Form
- 5.2.1 Conventional
- 5.2.2 Specialty
- 5.2.2.1 Controlled Release Fertilizer (CRF)
- 5.2.2.2 Liquid Fertilizer
- 5.2.2.3 Slow Release Fertilizer (SRF)
- 5.2.2.4 Water Soluble
- 5.3 Application Mode
- 5.3.1 Fertigation
- 5.3.2 Foliar
- 5.3.3 Soil
- 5.4 Crop Type
- 5.4.1 Field Crops
- 5.4.2 Horticultural Crops
- 5.4.3 Turf and Ornamental
- 5.5 Geography
- 5.5.1 Nigeria
- 5.5.2 Saudi Arabia
- 5.5.3 South Africa
- 5.5.4 Turkey
- 5.5.5 Rest of Middle East and Africa
6 COMPETITIVE LANDSCAPE
- 6.1 Key Strategic Moves
- 6.2 Market Share Analysis
- 6.3 Company Landscape
- 6.4 Company Profiles (Includes Global Level Overview, Market Level Overview, Core Business Segments, Financials, Headcount, Key Information, Market Rank, Market Share, Products and Services, and Analysis of Recent Developments)
- 6.4.1 Yara International ASA
- 6.4.2 SABIC Agri-Nutrients Company (Saudi Basic Industries Corporation)
- 6.4.3 OCP Group
- 6.4.4 Ma'aden Phosphate Company (Saudi Arabian Mining Company - Ma'aden)
- 6.4.5 Qatar Fertiliser Company QAFCO (Industries Qatar)
- 6.4.6 ICL Group Ltd
- 6.4.7 K+S Aktiengesellschaft
- 6.4.8 EuroChem Group AG
- 6.4.9 PhosAgro PJSC
- 6.4.10 Fertiglobe PLC (OCI N.V.)
- 6.4.11 Omnia Fertilizer (Pty) Ltd (Omnia Holdings Ltd)
- 6.4.12 Dangote Fertilizer Ltd (Dangote Industries Ltd)
- 6.4.13 Indorama Eleme Fertilizer and Chemicals Ltd (Indorama Corporation)
- 6.4.14 Haifa Group
- 6.4.15 Jordan Phosphate Mines Company PLC
- 6.4.16 Golden Fertilizer Company Limited