

|
시장보고서
상품코드
2099785
유럽의 유기 폐기물 수집 서비스 시장 : 시장 점유율 분석, 업계 동향 및 통계, 성장 예측(2026-2031년)Europe Organic Waste Collection Services - Market Share Analysis, Industry Trends & Statistics, Growth Forecasts (2026 - 2031) |
||||||
 Mordor Intelligence
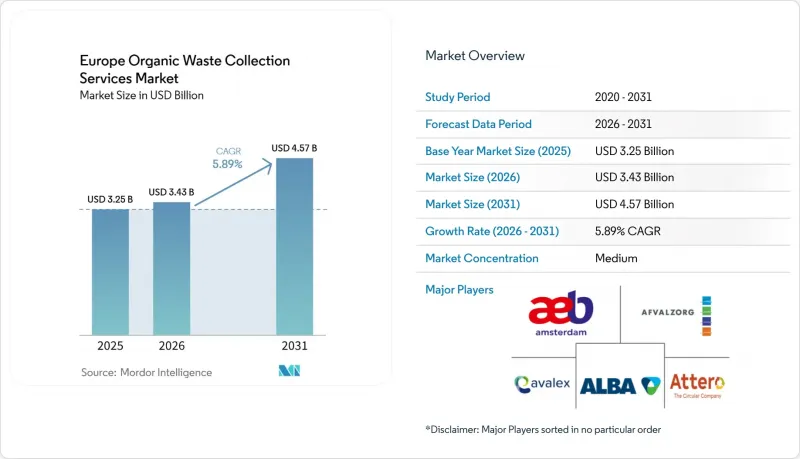
Mordor Intelligence에 의하면, 유럽의 유기 폐기물 수집 서비스 시장 규모는 2025년에 32억 5,000만 달러로 평가되었고, 2026년에 34억 3,000만 달러로 추정되고, 2031년까지 45억 7,000만 달러에 이를 것으로 예측되며, 2026-2031년 CAGR 5.89%로 성장할 전망입니다.
본 보고서는 폐기물 유형별(식품 폐기물, 정원 및 조경 폐기물 등), 최종 사용자별(주택 등), 수거 방법별(세대별 수거 등), 기술 및 설비별(수작업 수거 시스템 등), 지역별(영국, 독일 등)로 분류되어 있습니다. 본 보고서에서는 상기 모든 부문에 대해 시장 규모 및 예측치(달러)를 제시하고 있습니다.
유럽의 유기 폐기물 수집 서비스 시장 동향 및 인사이트
회원국 내 매립 지침 규제 및 매립세 인상
EU의 음식물 쓰레기 분리 수거 요건은 시행 시기의 불일치를 초래하고 있으며, 그 결과 조달 시기가 어긋나는 한편, 그리스, 포르투갈, 루마니아 등의 국가나, 2026년 1월의 이행 기한을 앞두고 지자체의 계약 결정이 가속화되고 있는 플랑드르 지방 등에서 현지 기한에 앞서 투자를 진행한 사업자에게는 선점 우위가 주어지고 있습니다. 그리스에서는 2026년 이후 매립세가 톤당 35-45유로 범위로 인상됨에 따라, 통합 시설별 대규모 설비 갱신 투자를 고려하더라도 비용 면에서의 균형이 소화 처리 경로로 이동하고 있으며, 이에 따라 수거 경로의 최적화 및 품질이 관리된 수거에 대한 사업 타당성이 강화되고 있습니다. 일부 회원국의 이행 격차는 잔류 폐기물 발생을 초래하고, 분리 수거 확대를 저해하고 있습니다. 이는 매립세가 낮거나 집행의 한계가 비공식적인 폐기물 이동을 유발하여, 바이오메탄 밸류체인을 위한 예측 가능한 원료 공급을 감소시키고 있기 때문입니다. ‘조기 경보 보고서’에서는 대부분의 회원국에서 생폐기물 처리 실적을 개선할 필요가 있다고 지적하고 있으며, 각국 고유의 처리 능력 부족이나 지연 상황을 고려하여 시설 가동 준비 상황에 맞추어 수거 계약을 단계적으로 진행함으로써, 시설 가동률 저하나 유휴화를 피해야 함을 시사하고 있습니다. 포르투갈의 매립 처리 용량 부족은 분리 수거 제도 하에서 오염 관리를 유지하면서 폐기물을 퇴비화나 소화 처리로 전환할 수 있는 통합형 사업자의 역할을 부각시키고 있습니다. 2027년에 예정된 EU의 목표 재검토는 계획상의 불확실성을 초래하고, 자본 투자의 지연을 불러올 가능성이 있습니다. 따라서 처리 능력 조정이나 투자의 단계적 실시가 가능한 사업자는 유럽의 유기 폐기물 수집 서비스 시장에서 성장을 지속하면서, 정책 재검토에도 유연하게 대응할 수 있는 입장에 있습니다.
REPowerEU의 에너지 안보 목표에 따른 바이오가스 및 바이오메탄 수요 증가
REPowerEU가 제시한 35 bcm의 바이오메탄 목표는 유기물을 에너지 원료로 재정의하는 것입니다. 그러나 현재 생산량은 잠재 능력을 훨씬 밑돌고 있으며, 업계 단체의 데이터에 따르면 원료 조달 격차로 인해 설치된 바이오메탄 처리 능력이 생산량을 현저히 상회하고 있어, 처리 능력 확충은 여전히 수거 체계의 병목 현상에 의해 제약을 받고 있습니다. 주요 국가들에서 정책 모델은 기존 플랜트의 수 이상으로 시장 동향을 좌우하고 있습니다. 프랑스에서는 소규모 시설이 많음에도 불구하고 경매 제도와 인증 의무로 인해 생산량이 증가하고 있는 반면, 독일에서는 대규모 설비 기반과 다년간의 전문 지식이 있음에도 불구하고 규제의 변동성으로 인해 투자가 주춤하고 있습니다. 덴마크의 높은 바이오메탄 보급률은 장기적인 지원 제도와 새롭게 도입되고 있는 CCUS(이산화탄소 포집·활용·저장) 인센티브에 의해 뒷받침되고 있으며, 수거에 대한 투자 수익률은 장기적인 인수 안정성과 연계됨으로써 향상된다는 것을 보여주고 있습니다. 남유럽에서는 낮은 수준에서 파이프라인이 확대되고 있으며, 스페인과 포르투갈이 목표를 설정하고 자금 조달 수단을 동원하고 있습니다. 그러나 인허가 지연이나 실행 지체가 나타나고 있으므로, 공급을 계통 연계 계획과 조화시키기 위해서는 자산 업그레이드와 병행하여 신뢰성 높은 분리 수거 체계를 확립할 필요가 있습니다. EU 차원의 금융 기관들은 파이프라인 연결 위험을 완화하기 위해 송전망 주입 준비 상황을 심사 및 보증하고 있으며, 그 대표적인 사례로 각국의 송전 인프라부터 수거 용기에서 바이오메탄 수거에 이르는 예측 가능한 경로를 구축하는 지역 프로젝트까지를 대상으로 하는 자금 조달을 들 수 있습니다. 이러한 연계는 일관된 정책과 자금 조달이 분리 수거 실적과 유럽 유기 폐기물 수집 서비스 시장의 지속 가능한 성장 사이의 격차를 어떻게 좁힐 수 있는지를 입증하고 있습니다.
EU 회원국 간의 파편화된 규제 체계와 이행 격차
서로 다른 바이오메탄 원산지 보증 제도와 상호 운용성이 없는 등록 제도가 공존하고 있는 것은 국경을 넘는 인증서의 원활한 유통을 저해하고 있습니다. 이로 인해 폐기물이 풍부한 지역과 인수 시장을 연결하는 능력이 저하되며, 여러 회원국에서 사업을 전개하는 사업자에게 있어 지역적 통합 전략이 복잡해지고 있습니다. 일부 국가의 규정에서는 혼합용 바이오메탄이 국내산이어야 한다고 규정하고 있어, 이로 인해 거래 가능한 인증서 시장 접근성이 제한되고, 운영 및 자금 조달 측면에서 최적 규모에 도달하지 못할 가능성이 있는 소규모 지역 생태계가 유지되고 있습니다. 각국의 지원 정책도 다양하고 바이오메탄 목표치도 크게 달라, 이러한 불균형은 규제 차익 거래를 유발하여 자본 및 차량 투자를 보다 신뢰할 수 있는 지원과 명확한 계약 모델을 갖춘 관할 구역으로 이동시키는 경향이 있습니다. 개정된 ‘폐기물 기본 지침’을 국내법에 반영하기 위한 20개월의 유예 기간으로 인해, 조기에 움직이기 시작한 지역은 유리한 입장에 서는 반면, 대응이 늦어진 지역에서는 계획, 조달, 도입 일정을 단축해야 할 필요가 생겨, 분리수거 시스템에서 수탁업체의 프리미엄이나 이행 위험이 높아질 가능성이 있습니다. 정의나 산정 방법의 차이로 인해 재활용률이나 성과 지표의 비교 가능성이 낮아지고, 벤치마크 설정이 복잡해질 뿐만 아니라, 수거 전략의 성공도에 대한 인식에 왜곡이 발생할 우려가 있습니다.
부문 분석
식품 폐기물은 회수되는 유기물 중 62.3%를 차지하는 가장 큰 비중을 차지하며, 연평균 성장률(CAGR) 6.89%로 증가하고 있습니다. 이는 유럽의 유기 폐기물 수거 서비스 시장에서 규제 목표와 바이오메탄의 경제성이 부합하며, 소화 처리에 적합한 고수분 함량 폐기물을 우선시하고 있음을 반영합니다. EU 내 식품 폐기물의 가정 발생 비율은 여전히 높기 때문에 목표 달성을 위한 예방 프로그램이 추진되는 가운데서도 지자체는 수거 경로의 유연성과 혼입물 관리를 유지해야 합니다. 이는 하류 처리를 위해 고품질의 잔류물을 확실하게 수거해야 하기 때문입니다. 회원국별 대응책에서는 기부 인센티브와 에너지 회수 체계가 결합될 전망이지만, REPowerEU와 연계된 에너지 목표 달성을 위해서는 여전히 신뢰할 수 있는 수거 체계가 필수적이며, 이를 통해 수거 용기, 수거 차량 및 바이오메탄 생산 능력 계획 간의 연계가 더욱 강화될 것입니다. 정원 및 조경 폐기물은 계절적 경향을 보이며, 대부분의 경우 퇴비화 시설로 운반되지만, 신흥 프로젝트에서는 소화 처리가 선택된 경우, 고도의 전처리를 통해 가스 수율을 향상시킬 가능성이 제시되고 있습니다. 농업 잔여물은 소화 처리의 기질로서 그 비중이 계속 확대되고 있지만, 이러한 폐기물의 상당수는 지자체 계약 대상에서 제외된 농장 규모의 시설에서 수거되고 있기 때문에 유럽의 유기 폐기물 수거 서비스 시장과 관련된 도시 지역의 수거 경로에 미치는 영향은 제한적입니다.
식품 폐기물 중에서도 가공·제조 공정에서 발생하는 ‘프리컨슈머(pre-consumer)’ 분획은 더 농축되어 있고 발생량을 예측하기 쉬워 오염 위험을 줄일 수 있을 뿐만 아니라, 엄격한 품질 기준 하에서 이루어지는 소화 처리나 퇴비화를 위한 수거 계획과도 부합합니다. 비가정용 폐기물에 대한 ‘배출량에 따른 과금(pay-as-you-throw)’ 제도로의 전환을 추진하는 각국의 움직임은 생산 전 단계의 발생 사업자에게 발생 원천에서의 품질 관리를 도입하도록 유도하는 인센티브를 창출하고 있으며, 이를 통해 공급망 전체의 수율 향상과 부적합 제품 감축이 촉진됩니다. 지자체에서는 불순물 함량이 낮아야 하는 퇴비 및 바이오가스 제품 시장성을 유지하는 데 필수적인 적절한 배출 방식을 유도하기 위해, 투명성이 높은 표시와 시민을 위한 디지털 도구의 시범 도입이 진행되고 있습니다. 기부와 에너지 회수의 균형에 관한 정책 논의는 계속되고 있으며, 사업자는 식용 가능한 식품이 소화 처리 경로로 유입되는 의도파관 않은 변화를 피하기 위해 수거 계약을 폐기물 감축 목표와 조화시켜야 합니다. 식품 폐기물과 관련된 유럽의 유기 폐기물 수집 서비스 시장 규모는 규제, 인프라 구축, 그리고 ‘품질 제일’ 프로그램 하에서 바이오메탄 및 퇴비 유통 분야에서 확대되는 수익 창출 기회가 맞물려 뒷받침되고 있습니다.
지자체별 가정별 수거 프로그램의 확대에 따라 2025년에는 주거 부문이 시장 점유율의 54.8%를 차지한 반면, 소매업 및 호스피탈리티 업계가 감축 목표에 적응하고 유럽 유기 폐기물 수집 서비스 시장 전체에서 분리 수거 참여를 강화함에 따라, 상업용 외식 산업은 연평균 성장률(CAGR) 7.62%를 나타낼 것으로 예측됩니다. 주거 부문의 식품 폐기물 대부분은 일반 가정에서 발생하기 때문에 주거용 서비스에서는 지속적인 인식 제고 활동과 혼입 관리가 필수적이며, 그 성과는 사용하기 편리한 용기, 신뢰할 수 있는 수거 일정, 그리고 분리 수거 행동을 바로잡기 위한 명확한 피드백에 달려 있습니다. 지자체는 배출물의 품질을 기록하고 운영자의 점검 이미지를 공유하는 업데이트된 라벨 및 온라인 대시보드를 도입하고 있으며, 이를 통해 신뢰도가 높아지고 시민들은 실시간으로 분리수거 방법을 조정할 수 있는 도구를 확보할 수 있습니다. 상업용 외식 산업 부문에서는 RFID 및 동적 계량 기능을 갖춘 통합형 수거 용기가 사용량에 따른 요금 체계를 지원하고 규정 준수를 강화하는 동시에, 감사 담당자가 혼입 상황을 특정 시설이나 근무 교대조와 연계하여 파악할 수 있게 해줍니다. 확대 생산자 책임(EPR) 체계 하에서 관련 폐기물 흐름은 보다 광범위한 순환형 이니셔티브와 조화를 이루고 있으며, 통합 규정 준수 서비스를 제공하는 사업자는 유럽의 유기 폐기물 수집 서비스 시장에서 카테고리를 넘나들며 더 많은 시장 점유율을 확보할 수 있습니다.
산업 시설은 소비 전 유기 폐기물의 발생원으로, 많은 경우 개별적인 물류 및 오염 관리가 필요합니다. 따라서 이러한 시설에 서비스를 제공하는 사업자는 고객의 환경 관리 시스템과 연동되는 검증 도구 및 보고 모듈을 도입하고 있습니다. 오프사이트 수거를 보완하는 수단으로서, 부피를 줄이고 유기물을 안정화시키는 온사이트 처리 기술이 주목받고 있으며, 바이오 다이제스터가 적절히 도입된 경우 처리량과 온실가스 배출량이 감소하는 사례가 나타나고 있습니다. 참여율이나 도입 준비 상황에는 여전히 지역별 차이가 존재하며, 분리 수거율이 낮은 것은 양질의 서비스 확산 속도를 제한하는 재정적·행정적 제약과 관련이 있습니다. 수거 경로의 신뢰성과 청결한 수거 용기 프로그램, 그리고 신속한 시민 피드백 루프를 결합한 서비스 모델은 정책 목표와 일상적인 배출 행동 간의 격차를 줄이는 데 필수적임이 입증되었으며, 이것이 유럽 유기 폐기물 수집 서비스 시장의 성장을 직접 뒷받침하고 있습니다.
기타 혜택 :
- 엑셀 형식 시장 예측(ME) 시트
- 3개월간의 애널리스트 지원
자주 묻는 질문
목차
제1장 서론
제2장 조사 방법
제3장 주요 요약
제4장 시장 구도
제5장 시장 규모 및 성장 예측
제6장 경쟁 구도
제7장 시장 기회 및 향후 전망
AJY 26.08.07According to Mordor Intelligence, the Europe organic waste collection services market size is projected to be USD 3.25 billion in 2025, USD 3.43 billion in 2026, and reach USD 4.57 billion by 2031, growing at a CAGR of 5.89% from 2026 to 2031.
This report is Segmented by Waste Type (Food Waste, Yard & Landscape Waste, and More), by End-User (Residential, and More), by Collection Method (Door-To-Door Collection, and More), by Technology & Equipment (Manual Collection Systems, and More), and by Geography (United Kingdom, Germany, and More). The Report Offers Market Size and Forecasts in Value (USD) for all the Above Segments.
Europe Organic Waste Collection Services Market Trends and Insights
Landfill Directive Restrictions and Escalating Landfill Taxes Across Member States
The EU's requirement for separate bio-waste collection has created uneven enforcement timelines, resulting in staggered procurement windows and early-mover advantages for operators who invested ahead of local deadlines in countries such as Greece, Portugal, and Romania, and in regions like Flanders, where the January 2026 cutover is accelerating municipal contracting decisions. Greece's landfill tax progression to a EUR 35-45 per tonne range from 2026 shifts the cost parity toward digestion pathways even when accounting for significant upgrading investments per integrated facility, which strengthens the business case for route optimization and quality-controlled collection. Implementation gaps in some member states sustain residual flows and undercut separate collection growth, as modest landfill levies and enforcement limits are linked to informal transfers that reduce predictable feedstock supply for biomethane value chains. Early Warning Reports identified a need to improve bio-waste performance in most member states, and specific country-level capacity shortages and delays show that collection contracts must be sequenced with facility readiness to avoid underutilization or stranded equipment. Portugal's tight landfill capacity window emphasizes the role of integrated operators that can divert flows to composting or digestion while maintaining contamination control under separate collection schemes. A scheduled 2027 EU review of targets introduces planning uncertainty that can delay capital commitments, so operators that can flex capacity arrangements and stage investments are better positioned to weather policy recalibration while continuing growth in the Europe organic waste collection service market
Growing Biogas and Biomethane Demand Aligned with REPowerEU Energy Security Goals
REPowerEU's 35 bcm biomethane goal redefines organics as energy feedstock, yet capacity additions remain constrained by collection bottlenecks as current production is far below potential, with association data showing installed biomethane capacity that outpaces output by a notable margin due to feedstock procurement gaps. Across key countries, policy models determine momentum more than legacy plant count, with auction frameworks and certificate obligations in France lifting output despite many small units, while regulatory volatility in Germany slows investments even with a large installed base and long-standing expertise. Denmark's high biomethane penetration is supported by long-duration support schemes and emerging CCUS incentives, indicating that yields on collection investments grow when paired with long-term offtake stability. Southern Europe's pipeline is expanding from a low base, with Spain and Portugal setting targets and mobilizing funding tools, though permitting gaps and execution delays show that reliable separate collection flows must develop in parallel with upgrading assets to synchronize supply with grid-injection plans. EU-level lenders are underwriting grid-injection readiness to de-risk pipeline connections, exemplified by loans that extend to national transmission infrastructure and regional projects that create predictable pathways from bins to biomethane offtake. These linkages reinforce how cohesive policies and financing shorten the distance between separate collection performance and sustained growth in the Europe organic waste collection service market.
Fragmented Regulatory Frameworks and Implementation Gaps Across EU Member States
The coexistence of different biomethane guarantee-of-origin schemes and non-interoperable registries blocks seamless cross-border certificate flows, which reduces the ability to match waste-rich regions with offtake markets and complicates regional consolidation strategies for operators working across multiple member states. Some national rules require that biomethane for blending originate domestically, which narrows market access for tradable certificates and sustains smaller local ecosystems that may not reach optimal scale for operations and financing. Countries have set widely differing biomethane targets with varied support instruments, and these asymmetries create regulatory arbitrage that tends to shift capital and fleet investments toward jurisdictions with more reliable support and clearer contract models. The 20-month window to transpose the revised Waste Framework Directive puts early movers at an advantage, while lagging regions will need to compress planning, procurement, and rollout, potentially raising contractor premiums and execution risk for separate collection systems. Differences in definitions and calculation methods reduce comparability of recycling rates and performance metrics, which complicates benchmarking and can distort the perceived success of collection strategies.
Other drivers and restraints analyzed in the detailed report include:
- Farm to Fork Strategy Promoting Food Waste Reduction and Resource Recovery
- Extended Producer Responsibility Schemes Expanding to Organic Waste Streams
- High Infrastructure Investment Needs for Vehicles and Facilities
For complete list of drivers and restraints, kindly check the Table Of Contents.
Segment Analysis
Food waste accounts for the largest portion of collected organics at 62.3% and is advancing at a 6.89% CAGR, which reflects how regulatory targets and biomethane economics align to prioritize high-moisture streams for digestion within the Europe organic waste collection service market. The household share of EU food waste remains elevated, so municipalities need to maintain route flexibility and contamination control even as targets drive prevention programs, since collections must still capture residuals at high quality for downstream processing. Member-state adaptations will blend donation incentives with energy recovery structures, yet reliable collection remains central to energy targets tied to REPowerEU, which tightens links between bins, trucks, and biomethane capacity planning. Yard and landscape waste tends to follow seasonal patterns and often routes to composting, while emerging projects demonstrate potential for advanced pre-treatment to boost gas yields where digestion is selected. Agricultural residues continue to expand as digestion substrates, yet many of these flows are captured by farm-scale assets that sit outside municipal contracts, which moderates the influence of these streams on urban collection routes tied to the Europe organic waste collection service market.
Within food waste, pre-consumer fractions from processing and manufacturing can be more concentrated and predictable, which reduces contamination risk and aligns with offtake planning for digestion and composting under strict quality standards. Member-state moves toward pay-as-you-throw for non-households build incentives for pre-consumer generators to adopt quality controls at the source, which supports higher yields and fewer rejects across the chain. Municipalities are testing transparent labeling and citizen-facing digital tools to guide correct set-outs, which is essential to maintain marketability of compost and biogas products that depend on low impurity levels. Policy debates continue on the balance between donation and energy recovery, and operators need to align collection contracts with prevention targets to avoid unintended shifts that send edible food into digestion pathways. The Europe organic waste collection service market size linked to food waste is supported by the intersection of regulation, infrastructure rollout, and the growing monetization opportunities in biomethane and compost streams under quality-first programs.
Residential users held 54.8% share in 2025 as municipalities expanded door-to-door programs, while commercial food service is projected to post a 7.62% CAGR as retail and hospitality adapt to reduction targets and strengthen participation in separate collection across the Europe organic waste collection service market. The residential base requires sustained education and contamination management since households generate much of the EU's food waste, and performance depends on easy-to-use containers, reliable schedules, and clear feedback that corrects sorting behavior. Municipalities are rolling out updated labeling and online dashboards that record set-out quality and share images from operator inspections, which improves trust and gives citizens the tools to adjust practices in real time. In the commercial food service segment, integrated bins with RFID and dynamic weighing support pay-as-you-throw tariffs and strengthen compliance, while enabling auditors to map contamination to particular sites or shifts. Under Extended Producer Responsibility frameworks, related waste streams are being aligned to broader circular initiatives, and operators that offer integrated compliance services can capture more wallet share across categories for the Europe organic waste collection service market.
Industrial facilities contribute to pre-consumer organic outputs and often require tailored logistics and contamination controls, so operators serving these sites are embedding verification tools and reporting modules that integrate with client environmental management systems. On-site processing technologies that reduce volume and stabilize organic matter are gaining attention as complements to off-site collection, and cases show reductions in handled volume and greenhouse gas footprints when biodigesters are deployed correctly. Regional differences persist in participation and readiness, with lagging separate collection rates tied to financial and administrative constraints that limit the speed of high-quality rollout. Service models that combine route reliability with clean bin programs and responsive citizen feedback loops are proving essential to narrowing the gap between policy ambition and day-to-day set-out behavior, which directly supports growth in the Europe organic waste collection service market.
Complete Report Scope:
- By Waste Type
- Food Waste (Pre and Post Consumer)
- Yard & Landscape Waste
- Agricultural Residues
- Others
- By End-User
- Residential
- Commercial (HoReCa, Retail)
- Industrial (Food Processing & Manufacturing)
- Others (Agri-waste)
- By Collection Method
- Door-to-Door Collection
- Drop-Off / Bring Systems
- Others
- By Technology & Equipment
- Manual Collection Systems
- Semi-Automated Systems
- Fully Automated Systems
- Others
- By Geography
- United Kingdom
- Germany
- France
- Italy
- Spain
- Russia
- Rest of Europe
List of Companies Covered in this Report:
- AEB Amsterdam
- Afvalzorg
- ALBA Group
- Attero
- Avalex
- AVEA GmbH & Co. KG
- Bartscherer & Co. Recycling GmbH
- Berliner Stadtreinigungsbetriebe AoR
- Biorepack Consortium
- Blue Wings Composting
- Circulus Agtech
- Contarina S.p.A.
- FCC Environment
- Geocycle GmbH
- GP Groot
- Gruppo Hera
- GS-Recycling Nederland
- Herambiente
- Indaver
- Interzero Holding
Additional Benefits:
- The market estimate (ME) sheet in Excel format
- 3 months of analyst support
TABLE OF CONTENTS
1 Introduction
- 1.1 Study Assumptions & Market Definition
- 1.2 Scope of the Study
2 Research Methodology
3 Executive Summary
4 Market Landscape
- 4.1 Market Overview
- 4.2 Market Drivers
- 4.2.1 Landfill Directive restrictions and escalating landfill taxes across member states
- 4.2.2 Growing biogas and biomethane demand aligned with REPowerEU energy security goals
- 4.2.3 Farm to Fork Strategy promoting food waste reduction and resource recovery
- 4.2.4 Extended Producer Responsibility (EPR) schemes expanding to organic waste streams
- 4.2.5 Municipal commitments to climate neutrality and methane emission reduction targets
- 4.2.6 Technological innovation in collection systems and digitalization of waste management
- 4.3 Market Restraints
- 4.3.1 Fragmented regulatory frameworks and implementation gaps across EU member states
- 4.3.2 High infrastructure investment costs for collection vehicles and sorting facilities
- 4.3.3 Contamination rates in mixed organic waste affecting downstream processing quality
- 4.3.4 Limited processing capacity in Eastern and Southern European regions
- 4.4 Value / Supply-Chain Analysis
- 4.5 Regulatory Landscape
- 4.6 Technological Outlook
- 4.6.1 RFID Smart Bins for Waste Tracking
- 4.6.2 AI Revolutionizes Waste Sorting
- 4.6.3 IoT Optimizing for Fleet Routes
- 4.7 Industry Attractiveness - Porter's Five Forces
- 4.7.1 Threat of New Entrants
- 4.7.2 Bargaining Power of Suppliers
- 4.7.3 Bargaining Power of Buyers
- 4.7.4 Threat of Substitutes
- 4.7.5 Industry Rivalry
- 4.8 Fleet Modernization & Electrification in Waste Collection
- 4.9 Analysis of Biomethane Impact on Organic Waste Collection
- 4.10 Collaboration between municipalities and private operators gaining traction
- 4.11 Growing focus on methane capture from organic waste to meet climate targets
5 Market Size & Growth Forecasts (Value in USD Billion)
- 5.1 By Waste Type
- 5.1.1 Food Waste (Pre and Post Consumer)
- 5.1.2 Yard & Landscape Waste
- 5.1.3 Agricultural Residues
- 5.1.4 Others
- 5.2 By End-User
- 5.2.1 Residential
- 5.2.2 Commercial (HoReCa, Retail)
- 5.2.3 Industrial (Food Processing & Manufacturing)
- 5.2.4 Others (Agri-waste)
- 5.3 By Collection Method
- 5.3.1 Door-to-Door Collection
- 5.3.2 Drop-Off / Bring Systems
- 5.3.3 Others
- 5.4 By Technology & Equipment
- 5.4.1 Manual Collection Systems
- 5.4.2 Semi-Automated Systems
- 5.4.3 Fully Automated Systems
- 5.4.4 Others
- 5.5 By Geography
- 5.5.1 United Kingdom
- 5.5.2 Germany
- 5.5.3 France
- 5.5.4 Italy
- 5.5.5 Spain
- 5.5.6 Russia
- 5.5.7 Rest of Europe
6 Competitive Landscape
- 6.1 Market Concentration
- 6.2 Strategic Moves
- 6.3 Market Share Analysis
- 6.4 Company Profiles {(includes Global level Overview, Market level overview, Core Segments, Financials as available, Strategic Information, Products & Services, and Recent Developments)}
- 6.4.1 AEB Amsterdam
- 6.4.2 Afvalzorg
- 6.4.3 ALBA Group
- 6.4.4 Attero
- 6.4.5 Avalex
- 6.4.6 AVEA GmbH & Co. KG
- 6.4.7 Bartscherer & Co. Recycling GmbH
- 6.4.8 Berliner Stadtreinigungsbetriebe AoR
- 6.4.9 Biorepack Consortium
- 6.4.10 Blue Wings Composting
- 6.4.11 Circulus Agtech
- 6.4.12 Contarina S.p.A.
- 6.4.13 FCC Environment
- 6.4.14 Geocycle GmbH
- 6.4.15 GP Groot
- 6.4.16 Gruppo Hera
- 6.4.17 GS-Recycling Nederland
- 6.4.18 Herambiente
- 6.4.19 Indaver
- 6.4.20 Interzero Holding
7 Market Opportunities & Future Outlook
- 7.1 Smart Cities & IoT Integration
- 7.2 Producer Responsibility Expansion
- 7.3 Shift Toward Decentralized Organic Waste Processing


