

|
시장보고서
상품코드
2099827
북미의 유기 폐기물 수집 서비스 시장 : 시장 점유율 분석, 업계 동향 및 통계, 성장 예측(2026-2031년)North America Organic Waste Collection Services - Market Share Analysis, Industry Trends & Statistics, Growth Forecasts (2026 - 2031) |
||||||
 Mordor Intelligence
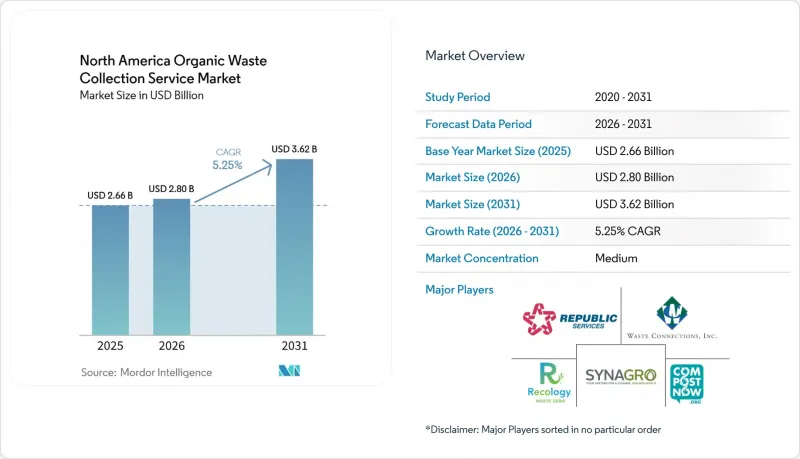
Mordor Intelligence에 의하면, 북미의 유기 폐기물 수집 서비스 시장 규모는 2025년에 26억 6,000만 달러로 평가되었고, 2026년 28억 달러에서 2031년까지 36억 2,000만 달러에 이를 것으로 예측되며, 예측 기간(2026-2031년) CAGR은 5.25%를 나타낼 전망입니다.
본 보고서는 폐기물 유형별(식품 폐기물, 정원 및 조경 폐기물 등), 최종 사용자별(주택 등), 수집 방법별(세대별 수거 등), 기술 및 설비별(수작업 수거 시스템 등), 지역별(미국, 캐나다, 멕시코)로 분류되어 있습니다. 본 보고서에서는 상기 모든 부문에 대해 시장 규모 및 예측치(달러)를 제시하고 있습니다.
북미의 유기 폐기물 수집 서비스 시장 동향 및 인사이트
유기 폐기물 발전 프로젝트를 지원하는 저탄소 연료 기준(LCFS) 크레딧
캘리포니아주, 오리건주, 워싱턴주의 주 차원 저탄소 연료 기준(LCFS) 프로그램이 북미 유기 폐기물 수집 서비스 시장의 성장을 주도하고 있습니다. 이러한 프로그램은 재생 가능 천연가스(RNG) 및 유기 폐기물로부터 에너지를 생산하는 프로젝트에 재정적 인센티브를 연계하고 있습니다. LCFS 크레딧 제도를 통해 폐기물 관리 사업자는 식품, 농업 및 도시 지역의 유기 폐기물을 바이오가스나 저탄소 운송용 연료로 전환함으로써 추가 수익을 창출하고 있습니다. 캘리포니아주는 LCFS 체계와 유기 폐기물의 자원화를 의무화하는 상원 법안 제1383호에 힘입어 이 분야의 선두에 서 있습니다. 이러한 노력은 지자체와 민간 기업이 식품 폐기물 수거 및 혐기성 소화 인프라를 강화하도록 동기를 부여하고 있습니다. 한편, 오리건주와 워싱턴주에서도 유사한 청정 연료 정책이 시행되고 있어 유기 폐기물 수거 및 재생에너지 생산에 대한 투자가 촉진되고 있습니다. LCFS 크레딧이 금전적 가치를 갖게 됨에 따라, 유기 폐기물을 수집 및 처리하는 기업의 재무적 지속가능성이 높아지고 있습니다. 이러한 호재에 힘입어 발생원별 분리 수거를 통한 유기 폐기물 회수 프로그램 도입이 가속화되고 있으며, 향후 2년 동안 미국 서부 전역에서 단기적인 시장 성장이 촉진될 전망입니다.
유기 폐기물로부터의 재생 가능 천연가스(RNG) 생산에 대한 연방 및 주 차원의 인센티브
제45Z조는 유기 폐기물의 소화 과정을 포함한 GREET(온실가스, 규제 대상 배출량 및 운송 에너지 사용량)에 기반한 모델을 사용하여 2029년까지 저탄소 운송 연료에 대한 생산 세액 공제를 규정하고 있으며, 이를 통해 낙농, 하수 처리 및 매립지 가스 관련 프로젝트의 경제성이 강화됩니다. 2026년 2월에 발표된 재무부 지침에서는 가축 분뇨를 원료로 하는 경로의 배출률이 마이너스가 될 수 있음이 명확히 밝혀졌으며, 이에 따라 가축 소화 시설의 세액 공제액이 증가하고 신규 건설 프로젝트의 대출 심사가 가속화될 것입니다. 캐나다 앨버타주가 Taurus Canada RNG사에 부여한 TIER 보조금 등 주 정부의 지원은 명확한 판매처를 확보한 대규모 가축 분뇨 유래 RNG 프로젝트의 자금 조달 위험을 완화하는 이와 유사한 정책적 일관성을 보여주고 있습니다. 민간 개발 사업자들은 상업 운영 단계로 전환하고 있으며, 클린 에너지 퓨얼스(Clean Energy Fuels)는 텍사스주의 주요 낙농 RNG 시설을 가동하여 재생 가능 연료 기준(RFS)에 따른 RIN(재생 가능 식별 번호)의 완전한 적격성을 획득했습니다. ISO 프레임워크 및 RFS(재생 가능 연료 기준) 파트 80에 기반한 검증은 크레딧 생성 과정의 무결성을 유지하는 데 기여하고 있습니다. 한편, 캘리포니아주가 2029년 이후부터 메탄 저감 크레딧을 단계적으로 축소할 예정이라는 점은 개발 및 조달 주기를 앞당길 수 있는 기회를 제공합니다.
인구 밀도가 낮은 교외 및 농촌 지역의 높은 수집 및 처리 비용
일부 지역에서는 2022년 이후 처리 수수료 및 처분 비용이 급증하고 있는 것으로 보고되고 있으며, 이는 요금 인상 압력을 높여 수입 조정 없이는 서비스 확장을 제한하고 있습니다. 캘리포니아주의 주법 및 제로 배출 차량 도입 규정은 비용을 증가시키고 자본 주기를 단축시키기 때문에 인구 밀도의 이점이 없는 저밀도 노선에서는 그 부담을 흡수하기가 더욱 어려워지고 있습니다. 도시 지역 노선에서는 데이터 도구를 활용해 불필요한 정차 지점을 줄임으로써 연료비와 인건비를 절감할 수 있지만, 농촌 지역의 센서 도입이나 노선 최적화는 거리와 참여율의 편차로 인해 절감 효과가 미미합니다. 연방 정부의 보조금은 프로젝트의 시작을 지원하지만, 제한된 자금을 둘러싼 경쟁에서는 고립된 농촌 지역의 시범 사업보다 규모가 크고 확장성이 높은 제안이 우선시되는 경향이 있습니다. 이러한 비용 구조로 인해 북미 음식물 쓰레기 수거 서비스 시장에서 인구 밀도가 낮은 지역의 프로그램 전개가 지연되고 있습니다.
부문 분석
2025년 수거량 중 정원 및 조경 폐기물이 66.2%를 차지했으나, 규제 및 RNG 크레딧의 가치가 고에너지 원료를 우대하고 있기 때문에 식품 폐기물은 2031년까지 연평균 성장률(CAGR) 6.89%로 증가할 전망입니다. 북미 유기 폐기물 수집 서비스 시장은 식품 폐기물 흐름이 LCFS 및 RFS 체계 하에서 메탄 배출 감축 및 연료 크레딧을 획득함으로써 혜택을 받아 개선될 전망입니다. 사업자들은 오염 관리를 개선하고 혐기성 소화 플랜트로공급을 확보하기 위해 포장재 제거에 투자하고 있으며, 이를 통해 연료 생산량을 확대함과 동시에 소화 잔류물 제품의 수거 및 처리 수익의 확실성을 높이고 있습니다. 대규모 발생원에 적용되는 주 차원의 유기물 분리 의무는 초기 도입자를 넘어 지속적으로 확대되고 있으며, 이로 인해 향후 몇 년간 상업 및 기관용 식품 폐기물의 자원화 수요가 증가할 것으로 예측됩니다. 농업 잔여물은 공급원이 분산되어 있고 계절적 특성을 띠기 때문에 여전히 시장 점유율은 작지만, TIER 보조금을 지원받은 해당 지역의 가축 분뇨 프로젝트를 통해 처리량과 지역별 RNG 공급량이 증가하고 있습니다.
식품 폐기물의 메탄 수율과 크레딧 강도는 북미 유기 폐기물 수집 서비스 시장에서 판매처를 확보하고, 처리 비용을 안정화하며, 수거 업체와 장기 계약을 체결할 수 있는 포장 제거 및 소화 처리를 통합한 시설로 자본을 유치하고 있습니다. 틈새 시장인 바이오솔리드 및 산업 제품 부문은 발전 및 탄소 배출 감축 효과를 뒷받침하는 첨단 건조·전환 기술을 통해 부가가치화가 진행되고 있습니다. 정원 수목 폐기물 프로그램은 여전히 지자체 서비스의 기반을 이루고 있으나, 저에너지 원료에 대한 정책적 인센티브가 부족하여 그 성장 속도는 식품 폐기물보다 완만합니다. 시간이 지남에 따라 교차 오염 관리 및 인식 제고 활동을 통해 분리 수거 품질이 향상되며, 이로 인해 북미 유기 폐기물 수집 서비스 업계에서 처리 비용 절감과 회수율 향상이 촉진될 것입니다.
2025년에는 주거용 수거가 74.3%를 차지한 것으로 평가되었으며, 이는 북미 유기 폐기물 수집 서비스 시장을 지탱하는 지자체와의 계약 및 가입 밀도를 반영한 것입니다. 한편, 상업용 부문은 2031년까지 연평균 성장률(CAGR) 7.62%로 확대될 것으로 예측됩니다. 대규모 배출 사업자에 대해 처리 시설에서 정해진 거리 범위 내에서 음식물 쓰레기를 분리 배출하도록 의무화하는 규제로 인해 수요가 제도화되었으며, 자발적인 시범 사업이 계약에 기반한 서비스 규모로 전환되고 있습니다. 상업시설 및 공공시설에서는 표준화된 수거 용기 크기와 서비스 수준에 맞추어, 중량 추적 및 혼입률 지표를 활용하여 이용자의 행동과 요금 설정을 유도하고 있습니다. 대형 소매업체와 제조업체는 환경 성과와 비용의 예측 가능성을 확보하기 위해 직접 처리 및 RNG(재생 천연가스) 인수와 관련된 제휴를 구축하고 있으며, 이를 통해 상업 부문의 사업 전망이 강화되고 있습니다. 주거 부문의 성장은 편의성과 인식 제고 활동에 달려 있으며, 인식을 지속적인 배출 행동으로 전환하는 프로그램 설계를 통해 북미 유기 폐기물 수집 서비스 시장의 자원 회수율을 향상시킬 수 있습니다.
상업 부문의 수거량은 오염 패턴, 서비스 빈도, 그리고 실용적인 컨테이너 선택을 결정하는 평면 밀도나 뒷마당 업무 흐름의 영향도 받습니다. 산업용 식품 가공의 경우, 부지 내 포장 해체 및 직접 주입 시설을 통해 예측 가능한 처리 능력을 실현하고, 투자와 안정적인 처리 요율을 뒷받침할 수 있습니다. 주거용 프로그램은 지역 기후 전략에서 여전히 핵심을 차지하고 있습니다. 정원 폐기물 및 인식 제고 자료와 결합함으로써, 북미 유기 폐기물 수거 서비스 업계에서 수거 노선의 경제성을 향상시킬 수 있는 규모를 실현할 수 있습니다. 예측 기간 동안 상업 부문의 성장률은 백분율 기준으로 주거 부문을 상회하겠지만, 총 처리량에서 차지하는 비중으로는 주거 부문이 여전히 가장 큰 기여원이 될 것입니다.
기타 혜택 :
- 엑셀 형식 시장 예측(ME) 시트
- 3개월간의 애널리스트 지원
자주 묻는 질문
목차
제1장 서론
제2장 조사 방법
제3장 주요 요약
제4장 시장 구도
제5장 시장 규모 및 성장 예측
제6장 경쟁 구도
제7장 시장 기회 및 향후 전망
AJY 26.08.07According to Mordor Intelligence, the North America organic waste collection service market size was valued at USD 2.66 billion in 2025 and is estimated to grow from USD 2.80 billion in 2026 to reach USD 3.62 billion by 2031, at a CAGR of 5.25% during the forecast period (2026-2031).
This report is Segmented by Waste Type (Food Waste, Yard & Landscape Waste, and More), by End-User (Residential, and More), by Collection Method (Door-To-Door Collection, and More), by Technology & Equipment (Manual Collection Systems, and More), and Geography (United States, Canada, Mexico). The Report Offers Market Size and Forecasts in Value (USD) for all the Above Segments.
North America Organic Waste Collection Services Market Trends and Insights
Low Carbon Fuel Standard Credits Supporting Organic Waste-to-Energy Projects
State-level Low Carbon Fuel Standard (LCFS) programs in California, Oregon, and Washington are driving the growth of the North America Organic Waste Collection Service market. These programs link financial incentives to renewable natural gas (RNG) and organic waste-to-energy projects. Through LCFS credit mechanisms, waste management operators are generating additional revenue by converting food, agricultural, and municipal organic waste into biogas and low-carbon transportation fuels. California, with its LCFS framework and Senate Bill 1383 mandates for organic waste diversion, is at the forefront. These initiatives motivate municipalities and private entities to bolster food waste collection and anaerobic digestion infrastructure. Meanwhile, Oregon and Washington's parallel clean fuel policies are spurring investments in organic waste recovery and renewable energy production. As LCFS credits are monetized, they enhance the financial viability of companies in organic waste collection and processing. This boost is hastening the adoption of source-separated organic waste programs, propelling short-term market growth across the western United States in the coming two years.
Federal and State Incentives for Renewable Natural Gas (RNG) Production from Organic Waste
Section 45Z provides production tax credits through 2029 for low-carbon transportation fuels, using a GREET (Greenhouse gases, Regulated Emissions, and Energy use in Transportation)-based model that includes organic waste digestion pathways, thereby strengthening project economics for dairies, wastewater, and landfill gas. Treasury guidance issued in February 2026 clarifies that emissions rates for manure pathways can be negative, increasing the credit value for livestock digesters and accelerating underwriting for new builds. Provincial support in Canada, such as Alberta's TIER grant to Taurus Canada RNG, demonstrates parallel policy alignment that de-risks capital for large-scale manure-to-RNG projects with defined offtake pathways. Private developers are moving to commercial operations, with Clean Energy Fuels commissioning a major Texas dairy RNG facility and achieving full RIN (Renewable Identification Number) eligibility under the Renewable Fuel Standard. Verification under ISO frameworks and RFS (Renewable Fuel Standard) Part 80 helps maintain integrity of credit generation, while California's schedule to phase down avoided methane crediting after 2029 creates a timing window that is front-loading development and procurement cycles.
High Collection and Processing Costs in Low-Density Suburban and Rural Areas
Some districts report sharp increases in processing fees and disposal costs since 2022, which raises rate pressure and limits service expansion without revenue adjustments. State mandates in California and zero-emission fleet rules add costs and compress the capital cycle, making it harder to absorb on sparse routes that lack density advantages. Urban routes can trim fuel and labor by removing unnecessary stops with data tools, yet rural deployment of sensors and route optimization yields smaller savings due to distance and participation variability. Federal grants help seed projects, but competition for limited funds can favor larger and more scalable proposals over isolated rural pilots. This cost structure slows program rollouts in lower-density markets within the North America organic waste collection service market.
Other drivers and restraints analyzed in the detailed report include:
- Municipal Climate Action Plans Aimed at Reducing Landfill Methane Emissions
- Infrastructure Investment Through Federal Climate and Infrastructure Funding Programs
- Limited Anaerobic Digestion and Composting Facility Capacity
For complete list of drivers and restraints, kindly check the Table Of Contents.
Segment Analysis
Yard and landscape waste accounted for 66.2% of 2025 collections, while food waste is set to grow at a 6.89% CAGR to 2031 as mandates and RNG credit values favor high-energy feedstocks. The North American organic waste collection service market benefits when food waste streams unlock avoided methane and fuel credits under the LCFS and RFS frameworks, thereby improving. Operators are investing in depackaging to improve contamination control and feed anaerobic digestion plants, thereby scaling fuel output and increasing certainty around offtake for digestate products and processing revenue. State-level organics separation mandates that apply to large generators continue to extend beyond early adopters, which builds a multi-year lift for commercial and institutional food waste diversion. Agricultural residues remain a small share due to dispersed supply and seasonality, though co-located manure projects supported by TIER grants add throughput and regional RNG supply.
Food waste's methane yield and credit intensity draw capital toward integrated depackaging and digestion facilities that can lock in offtake, stabilize tipping fees, and create long-term contracts for haulers in the North America organic waste collection service market. Niche biosolids and industrial byproducts are being valorized through advanced drying and conversion technologies that support power generation and carbon benefits. Yard waste programs remain the backbone of municipal services, but their growth pace is slower than food waste as fewer policy incentives attach to low-energy feedstocks. Over time, cross-contamination controls and education improve diversion quality, which supports lower processing costs and higher recovery in the North America organic waste collection service industry.
Residential collection accounted for 74.3% in 2025, reflecting municipal contracts and subscription density that anchor the North American organic waste collection service market, while commercial is projected to expand at a 7.62% CAGR through 2031. Regulations that require large generators to separate food scraps within defined distances of processing sites formalize demand and shift voluntary pilots into contracted service volumes. Commercial and institutional sites respond to standardized cart sizes and service levels with weight tracking and contamination metrics that guide behavior and fees. Large retailers and manufacturers are building direct processing and RNG offtake ties to secure environmental outcomes and cost predictability, which strengthens commercial pipeline visibility. Residential growth relies on convenience and outreach, and a program design that converts awareness into repeat set-outs can improve diversion performance in the North America organic waste collection service market.
Commercial volumes are also influenced by floor-plan density and back-of-house workflows that determine contamination patterns, service cadence, and viable container options. For industrial food processing, on-site depackaging and direct injection facilities can enable predictable throughput, supporting investment and stable tip rates. Residential programs remain core to local climate strategies. When bundled with yard waste and educational materials, they can deliver scale that improves route economics in the North America organic waste collection service industry. Over the forecast horizon, commercial momentum outpaces residential growth in percentage terms, but residential remains the largest contributor to total volumes.
Complete Report Scope:
- By Waste Type
- Food Waste (Pre and Post Consumer)
- Yard & Landscape Waste
- Agricultural Residues
- Others
- By End-User
- Residential
- Commercial (HoReCa, Retail)
- Industrial (Food Processing & Manufacturing)
- Others (Agri-waste)
- By Collection Method
- Door-to-Door Collection
- Drop-Off / Bring Systems
- Others
- By Technology & Equipment
- Manual Collection Systems
- Semi-Automated Systems
- Fully Automated Systems
- Others
- By Geography
- United States
- Canada
- Mexico
List of Companies Covered in this Report:
- Republic Services
- Waste Connections
- Recology
- Synagro
- CompostNow
- GFL Environmental Inc.
- Compost Crew
- Black Earth Compost
- Bootstrap Compost
- Denali
- Groot Industries
- Atlas Organics
- Rumpke Waste & Recycling
- Sanimax
- Veolia
- TerraCycle
- Convertus Group
- Remix Organics
- AgRecycle
- Action Carting Environmental Services, Inc
Additional Benefits:
- The market estimate (ME) sheet in Excel format
- 3 months of analyst support
TABLE OF CONTENTS
1 Introduction
- 1.1 Study Assumptions & Market Definition
- 1.2 Scope of the Study
2 Research Methodology
3 Executive Summary
4 Market Landscape
- 4.1 Market Overview
- 4.2 Market Drivers
- 4.2.1 Low Carbon Fuel Standard Credits Supporting Organic Waste-To-Energy Projects
- 4.2.2 Federal and State Incentives for Renewable Natural Gas Production from Organic Waste
- 4.2.3 Municipal Climate Action Plans Aimed at Reducing Landfill Methane Emissions
- 4.2.4 Infrastructure Investment Through Federal Climate and Infrastructure Funding Programs
- 4.2.5 Rising Consumer Awareness and Demand for Curbside Organic Waste Collection
- 4.2.6 Food Waste Donation Tax Incentives for Large Generators
- 4.3 Market Restraints
- 4.3.1 High Collection and Processing Costs in Low-Density Suburban and Rural Areas
- 4.3.2 Limited Anaerobic Digestion and Composting Facility Capacity
- 4.3.3 Municipal Budget Constraints and Competing Priorities
- 4.3.4 Low Participation Without Mandatory Collection Programs
- 4.4 Value / Supply-Chain Analysis
- 4.5 Regulatory Landscape
- 4.6 Technological Outlook
- 4.6.1 RFID Smart Bins for Waste Tracking
- 4.6.2 AI Revolutionizes Waste Sorting
- 4.6.3 IoT Optimizing for Fleet Routes
- 4.7 Porter's Five Forces
- 4.7.1 Threat of New Entrants
- 4.7.2 Bargaining Power of Suppliers
- 4.7.3 Bargaining Power of Buyers
- 4.7.4 Threat of Substitutes
- 4.7.5 Industry Rivalry
- 4.8 Fleet Modernization & Electrification in Waste Collection
- 4.9 Analysis of Biomethane Impact on Organic Waste Collection
- 4.10 Collaboration Between Municipalities and Private Operators Gaining Traction
- 4.11 Growing Focus on Methane Capture from Organic Waste to Meet Climate Targets
5 Market Size & Growth Forecasts (Value, In USD Billion)
- 5.1 By Waste Type
- 5.1.1 Food Waste (Pre and Post Consumer)
- 5.1.2 Yard & Landscape Waste
- 5.1.3 Agricultural Residues
- 5.1.4 Others
- 5.2 By End-User
- 5.2.1 Residential
- 5.2.2 Commercial (HoReCa, Retail)
- 5.2.3 Industrial (Food Processing & Manufacturing)
- 5.2.4 Others (Agri-waste)
- 5.3 By Collection Method
- 5.3.1 Door-to-Door Collection
- 5.3.2 Drop-Off / Bring Systems
- 5.3.3 Others
- 5.4 By Technology & Equipment
- 5.4.1 Manual Collection Systems
- 5.4.2 Semi-Automated Systems
- 5.4.3 Fully Automated Systems
- 5.4.4 Others
- 5.5 By Geography
- 5.5.1 United States
- 5.5.2 Canada
- 5.5.3 Mexico
6 Competitive Landscape
- 6.1 Market Concentration
- 6.2 Strategic Moves
- 6.3 Market Share Analysis
- 6.4 Company Profiles {(Includes Global Level Overview, Market Level Overview, Core Segments, Financials as Available, Strategic Information, Products & Services, and Recent Developments)}
- 6.4.1 Republic Services
- 6.4.2 Waste Connections
- 6.4.3 Recology
- 6.4.4 Synagro
- 6.4.5 CompostNow
- 6.4.6 GFL Environmental Inc.
- 6.4.7 Compost Crew
- 6.4.8 Black Earth Compost
- 6.4.9 Bootstrap Compost
- 6.4.10 Denali
- 6.4.11 Groot Industries
- 6.4.12 Atlas Organics
- 6.4.13 Rumpke Waste & Recycling
- 6.4.14 Sanimax
- 6.4.15 Veolia
- 6.4.16 TerraCycle
- 6.4.17 Convertus Group
- 6.4.18 Remix Organics
- 6.4.19 AgRecycle
- 6.4.20 Action Carting Environmental Services, Inc
7 Market Opportunities & Future Outlook
- 7.1 Smart Cities & IoT Integration
- 7.2 Producer Responsibility Expansion
- 7.3 Shift Toward Decentralized Organic Waste Processing


