

|
시장보고서
상품코드
2114397
OTT(Over-the-Top) 시장 : 시장 점유율 분석, 업계 동향 및 통계, 성장 예측(2026-2031년)Over The Top (OTT) - Market Share Analysis, Industry Trends & Statistics, Growth Forecasts (2026 - 2031) |
||||||
 Mordor Intelligence
Mordor Intelligence에 의하면, OTT(Over-the-Top) 시장 규모는 2025년 3,626억 5,000만 달러로 평가되었고, 2026년 4,005억 1,000만 달러에서 2031년까지 6,126억 1,000만 달러로 확대될 것으로 예측되며, 2026-2031년 연평균 복합 성장률(CAGR)은 8.87%를 나타낼 전망입니다.
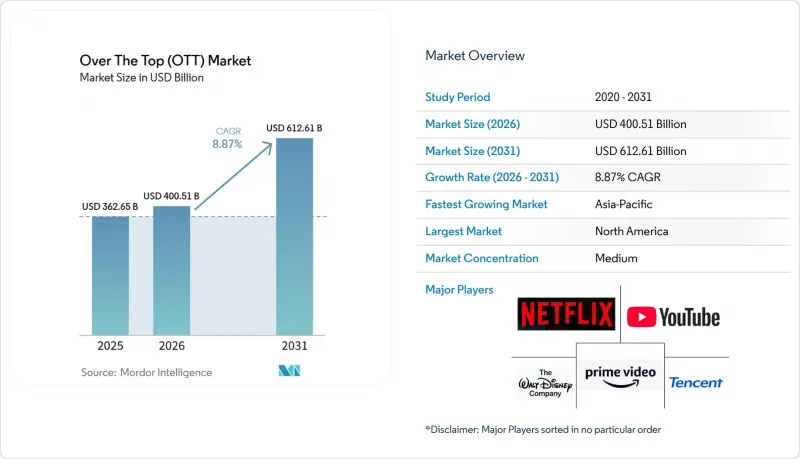
본 보고서는 수익화 모델별(SVOD, AVOD, TVOD, 하이브리드 등), 기기 유형별(스마트폰·태블릿, 스마트 TV, 노트북·데스크톱 PC 등), 컨텐츠 장르별(영화, TV 프로그램·에피소드형 컨텐츠, 다큐멘터리 등), 지역별(북미, 남미, 유럽, 아시아태평양, 중동 및 아프리카)로 분류되어 있습니다. 시장 예측은 금액(달러) 기준으로 제시되어 있습니다.
세계의 OTT(Over-The-Top) 시장 동향 및 인사이트
통신 사업자와의 번들 및 OTT 파트너십
통신 사업자의 번들 서비스는 특히 고객이 가격에 민감한 지역에서 OTT(Over-the-Top) 시장에 있어 중요한 유통 경로가 되고 있습니다. 이 구조를 통해 통신 사업자는 해지율을 낮출 수 있고, 스트리밍 플랫폼은 가입자 확보 비용을 절감할 수 있습니다. 릴라이언스 지오(Reliance Jio)는 2026년 5월, 15개 플랫폼, 1,000개의 라이브 TV 채널, 그리고 28일간의 무제한 5G 접속을 번들로 묶은 200루피(2.10달러)짜리 ‘OTT 패스’를 도입했습니다. 이 패키지는 스트리밍 서비스를 개별 구매 상품으로 취급하기보다는 보다 광범위한 모바일 서비스의 일부로 포지셔닝한 것입니다. 이 모델은 수요가 큰 시장에서 도달 범위를 확대할 수 있지만, 한편으로는 플랫폼 측에 사용자 1인당 수익 감소를 수용하도록 압력을 가하게 됩니다. 이에 따라 제공업체들은 단독 구독으로는 얻을 수 없는 수익을 보충하기 위해 광고나 하이브리드 요금제를 활용하도록 유도되고 있습니다.
스포츠 중계권 가격 급등
스트리밍 플랫폼은 2025년 132억 달러에 비해 2026년에는 스포츠 중계권에 142억 달러를 지출할 것으로 예측됩니다. 아마존 프라임 비디오는 NBA와의 계약을 통해 첫 풀 시즌을 맞이함에 따라 38억 달러를 지출할 것으로 전망되었습니다. 라이브 스포츠는 정해진 시간에 시청자를 끌어모아 OTT(Over-The-Top) 시장에 높은 가치를 지닌 광고 슬롯을 창출할 수 있습니다. 또한, 일반 엔터테인먼트 구독의 성장세가 둔화되고 있는 성숙 시장에서도 동일한 중계권은 신규 가입자 확보를 뒷받침합니다. 그러나 중계권료의 급등은 다른 주요 수익원이 없는 플랫폼에 있어 심각한 비용 부담을 초래하고 있습니다. 따라서 OTT 시장에서는 구독, 광고, 그리고 더 광범위한 상업 생태계 전반에 걸쳐 스포츠 프로그램을 활용할 수 있는 서비스가 유리할 가능성이 높습니다.
급등하는 컨텐츠 확보 및 제작 비용
컨텐츠 지출은 OTT(Over-The-Top) 시장에서 여전히 가장 큰 비용 부담 요인으로 작용하고 있습니다. 넷플릭스는 2025 회계연도에 171억 달러 규모의 컨텐츠 자산을 추가하였고, 240억 달러 규모의 컨텐츠 계약 의무를 보고했습니다. 이 회사의 2025년 매출은 451억 8,000만 달러로, 이는 전 세계 서비스를 유지하는 데 필요한 컨텐츠 투자 규모를 보여줍니다. 스포츠 중계권은 프리미엄 대회의 경우 다년간의 대규모 계약이 요구되기 때문에 추가적인 비용 부담이 되고 있습니다. 인도에서는 각 플랫폼사가 중규모 예산의 제작 프로젝트에 대해 더욱 엄선하게 된 결과,OTT 컨텐츠 지출은 2024년 267억 루피(2억 7,900만 달러)에서 2025년에는 218억 루피(2억 2,800만 달러)로 감소했습니다. 그 결과, OTT(Over-The-Top) 시장에서는 제공업체가 관련 컨텐츠에 대한 접근권을 잃지 않으면서도 리스크를 억제할 수 있는 라이선싱, 공동 제작, 제작 분담과 같은 방식이 촉진되고 있습니다.
부문 분석
2025년, 수익화 모델별로 보면 SVOD가 OTT 시장의 54.52%를 차지했습니다. 구독 수익은 지속적인 수입원이 되며 고객과의 직접적인 관계를 구축할 수 있기 때문에 여전히 주요 플랫폼의 수익 기반을 이루고 있습니다. 하이브리드 서비스는 2026년부터 2031년까지 연평균 성장률(CAGR) 10.54%로 가장 빠른 성장을 기록할 것으로 예측됩니다. 이러한 요금제는 구독료와 동일한 시청자로부터 발생하는 광고 수익을 결합한 것입니다. AVOD는 두 번째로 큰 수익화 모델이며, 아시아태평양이나 남미와 같은 가격에 민감한 시장에서 특히 중요한 역할을 하고 있습니다.
TVOD 및 프리미엄 서비스는 OTT 시장에서 여전히 비교적 작은 비중을 차지하고 있지만, 특정 이용 사례에서는 명확한 역할을 수행하고 있습니다. TVOD는 시청자가 시간 제한이 있는 접근 권한에 대해 거래 수수료를 지불하는 것을 꺼리지 않는 스포츠나 라이브 이벤트에 적합합니다. 프리미엄 서비스는 유료 서비스로 전환하기 전에 소비자가 플랫폼을 체험해 볼 수 있는 수단이 됩니다. 광고가 전혀 없는 구독 모델에서 벗어나는 것은 성숙한 서비스에서 가입자 수 증가세가 둔화되는 가운데, 수익원을 다각화해야 할 필요성을 반영합니다. 넷플릭스는 2025년 광고 수익이 15억 달러를 넘어섰다고 보고했으며, 2026년에는 30억 달러에 육박할 것으로 예측했습니다. 따라서 OTT 업계에서는 하이브리드 요금제를 일시적인 프로모션 수단이 아닌, 지속 가능한 비즈니스 모델로 활용하고 있습니다.
지역별 분석
2025년, 북미는 OTT 시장의 48.22%를 차지했습니다. 가정 내 광대역 보급률의 높음, 정액제 비디오 서비스의 정착, 그리고 성숙한 광고 시스템이 이러한 위상을 뒷받침했습니다. 2025년 12월 기준, 넷플릭스, 디즈니, 아마존 3사가 미국 정액제 VOD 시청자 수의 65%를 차지했습니다. 이 지역에서는 신규 가입자 중 경쟁사로부터 이적한 이용자나 서비스를 재개한 기존 가입자가 많아 시장 포화라는 과제에 직면해 있습니다. 2026년에 법제화된 캐나다의 ‘국내 프로그램 15% 제공 의무’는 세계 플랫폼의 제작 위탁 선택에 변화를 가져오고 있습니다.
아시아태평양은 2026-2031년 연평균 성장률(CAGR) 11.17%를 기록할 전망이며, OTT 시장에서 가장 빠르게 성장하는 지역이 될 것으로 예측됩니다. 2025년, 이 지역의 온라인 동영상 수익의 46%를 중국이 차지했고, 그 다음으로 일본이 17%, 호주가 10%를 차지했습니다. 인도는 2030년까지 개인 가입자 수 3억 5,800만 명을 보유한 세계 최대의 SVOD(정액제 동영상 스트리밍) 시장이 될 것으로 예측됩니다. 아시아태평양 전체 SVOD 가입자의 84%를 현지 플랫폼이 차지하고 있어, OTT(Over-The-Top) 시장이 확대되고 있음에도 불구하고 국제 서비스가 확보할 수 있는 수익 점유율은 제한적입니다.
유럽은 OTT 시장에서 두 번째로 큰 지역 부문이며, 독일, 영국, 프랑스가 중심을 이루고 있습니다. 유럽의 서비스 사업자는 컨텐츠의 30%를 유럽산으로 제공해야 한다는 요건 하에 운영되고 있습니다. 독일에서는 2027년 1월부터 수익의 8%를 현지 투자에 충당해야 하는 요건이 적용될 전망입니다. 남미는 신흥 지역으로, 브라질이 보급을 주도하고 있으며, 통신 사업자의 번들 서비스를 통해 주요 도시 이외의 지역으로도 접근성이 확대되고 있습니다. 중동에서는 사우디아라비아와 아랍에미리트가 수익의 중심지인 반면, 아프리카에서는 남아프리카공화국, 이집트, 나이지리아의 모바일 접속이 여전히 주를 이루고 있습니다.
기타 혜택 :
- 엑셀 형식 시장 예측(ME) 시트
- 3개월간의 애널리스트 지원
자주 묻는 질문
목차
제1장 서론
제2장 조사 방법
제3장 주요 요약
제4장 시장 구도
제5장 시장 규모 및 성장 예측
제6장 경쟁 구도
제7장 시장 기회 및 향후 전망
AJY 26.08.26According to Mordor Intelligence, the over the top (OTT) market size is projected to expand from USD 362.65 billion in 2025 and USD 400.51 billion in 2026 to USD 612.61 billion by 2031, registering a CAGR of 8.87% between 2026 to 2031.
This report is Segmented by Monetization Model (SVOD, AVOD, TVOD, Hybrid, and More), Device Types (Smartphones and Tablets, Smart TVs, Laptops and Desktops, and More), Content Genre (Movies and Films, TV Shows and Episodic Content, Documentaries, and More), and Geography (North America, South America, Europe, Asia-Pacific, Middle East, and Africa). The Market Forecasts are Provided in Terms of Value (USD).
Global Over The Top (OTT) Market Trends and Insights
Bundled Telco and OTT Partnerships
Telecom bundles have become an important distribution route for the over the top (OTT) market, especially where customers are price sensitive. The arrangement can reduce cancellation rates for operators and lower subscriber acquisition costs for streaming platforms. Reliance Jio introduced an INR 200 (USD 2.10) OTT Pass in May 2026 that bundled 15 platforms, 1,000 live TV channels, and unlimited 5G access for 28 days. This package placed streaming services within a broader mobile offer rather than treating them as separate purchases. The model can broaden reach in high-volume markets, but it also places pressure on platforms to accept lower revenue per user. It has encouraged providers to use advertising and hybrid plans to recover revenue that a standalone subscription may not deliver.
Live Sports Rights Inflation
Streaming platforms are expected to spend USD 14.2 billion on sports rights in 2026, compared with USD 13.2 billion in 2025. Amazon Prime Video was expected to spend USD 3.8 billion, supported by the first full season of its NBA agreement. Live sports can attract viewers at a fixed time and create valuable advertising inventory for the over the top (OTT) market. The same rights can also support subscriber acquisition in mature markets where general entertainment subscriptions have slowed. However, rising rights fees create a difficult cost position for platforms that lack other large revenue streams. The OTT market is therefore likely to reward services that can use sports programming across subscriptions, advertising, and wider commercial ecosystems.
Escalating Content Acquisition and Production Costs
Content spending remains the largest cost pressure in the over the top (OTT) market. Netflix added USD 17.1 billion in content assets in fiscal 2025 and reported USD 24.0 billion in content obligations. Its 2025 revenue was USD 45.18 billion, which shows the scale of content investment needed to maintain a global service. Sports rights add a further cost burden because premium competitions require large multiyear commitments. In India, OTT content spending fell to INR 21.8 billion (USD 228 million) in 2025 from INR 26.7 billion (USD 279 million) in 2024 as platforms became more selective with mid-budget commissions. The over the top (OTT) market is consequently encouraging licensing, co-productions, and shared production arrangements where providers can limit risk without losing access to relevant content.
Other drivers and restraints analyzed in the detailed report include:
- Connected TV Advertising Shift
- Government Domestic Content Quotas
- High Churn and Subscription Stacking
For complete list of drivers and restraints, kindly check the Table Of Contents.
Segment Analysis
SVOD held 54.52% of the over the top (OTT) market by monetization model in 2025. Subscription revenue still anchors the largest platforms because it provides recurring income and a direct customer relationship. Hybrid services are projected to record the fastest growth at a 10.54% CAGR from 2026 to 2031. These plans combine a subscription charge with advertising revenue from the same viewer. AVOD is the second-largest monetization model and has particular relevance in price-sensitive markets across Asia-Pacific and South America.
TVOD and freemium services remain smaller parts of the OTT market, but they retain a clear role in selected use cases. TVOD is relevant for sports and live events where viewers may accept a transaction fee for time-sensitive access. Freemium services can introduce consumers to a platform before a paid conversion. The shift away from entirely ad-free subscriptions reflects the need to diversify revenue as mature services face slower subscriber additions. Netflix reported that advertising revenue exceeded USD 1.5 billion in 2025 and forecast that it would approach USD 3 billion in 2026. The OTT industry is therefore using hybrid plans as an enduring commercial model rather than a temporary promotional option.
Complete Report Scope:
- By Monetization Model
- SVOD
- AVOD
- TVOD
- Hybrid
- Freemium
- By Device Types
- Smartphones and Tablets
- Smart TVs
- Laptops and Desktops
- Other Device Types
- By Content Genre
- Movies and Films
- TV Shows and Episodic Content
- Documentaries
- Other Content Genres
- By Geography
- North America
- United States
- Canada
- Mexico
- South America
- Brazil
- Argentina
- Chile
- Rest of South America
- Europe
- Germany
- United Kingdom
- France
- Italy
- Spain
- Rest of Europe
- Asia-Pacific
- China
- Japan
- India
- South Korea
- Australia
- Rest of Asia-Pacific
- Middle East
- Saudi Arabia
- United Arab Emirates
- Qatar
- Rest of Middle East
- Africa
- South Africa
- Egypt
- Nigeria
- Rest of Africa
- North America
Geography Analysis
North America held 48.22% of the over the top market in 2025. High household broadband availability, established subscription video use, and mature advertising systems supported this position. Netflix, Disney, and Amazon collectively accounted for 65% of U.S. subscription VOD viewership in December 2025. The region faces a saturation challenge because new subscribers often come from competitors or from reactivated former subscribers. Canada's 15% domestic-programming contribution requirement, formalized in 2026, is changing the commissioning choices of global platforms.
Asia-Pacific is projected to be the fastest-growing OTT geography at an 11.17% CAGR from 2026 to 2031. China accounted for 46% of the region's online video revenue in 2025, followed by Japan at 17% and Australia at 10%. India is expected to become the world's largest SVOD subscription market by 2030 with 358 million individual subscriptions. Local platforms held 84% of SVOD subscriptions across Asia-Pacific, which limits the revenue share available to international services even as the over the top (OTT) expands.
Europe is the second-largest geographic segment in the over the top market and is centered on Germany, the United Kingdom, and France. European services operate under a 30% European content availability requirement. Germany is expected to apply an 8% local-revenue investment requirement from January 2027. South America is an emerging region where Brazil anchors adoption and telecom bundles are extending access beyond major cities. The Middle East has premium revenue centers in Saudi Arabia and the United Arab Emirates, while Africa remains centered on mobile access in South Africa, Egypt, and Nigeria.
- Netflix Inc.
- Google LLC
- Prime Video (Amazon.com, Inc.)
- The Walt Disney Company
- Tencent Holdings Limited
- Apple Inc.
- Warner Bros. Discovery, Inc.
- Comcast Corporation
- Paramount Global
- Roku, Inc.
- Baidu, Inc.
- Alibaba Group Holding Limited
- DAZN Group Limited
- JioStar Private Limited
- PCCW Media Limited
- Zee Entertainment Enterprises Limited
- MBC Group
- Canal+ Group
- Rakuten Group, Inc.
- Starz Entertainment, LLC
Additional Benefits:
- The market estimate (ME) sheet in Excel format
- 3 months of analyst support
TABLE OF CONTENTS
1 INTRODUCTION
- 1.1 Study Assumptions and Market Definition
- 1.2 Scope of the Study
2 RESEARCH METHODOLOGY
3 EXECUTIVE SUMMARY
4 MARKET LANDSCAPE
- 4.1 Market Overview
- 4.2 Market Drivers
- 4.2.1 Bundled Telco and OTT Partnerships
- 4.2.2 Live Sports Rights Inflation
- 4.2.3 Connected TV Advertising Shift
- 4.2.4 Government Domestic Content Quotas
- 4.2.5 Cloud-Based Content Delivery and AI Personalization
- 4.2.6 Hybrid Monetization and Ad Tier Expansion
- 4.3 Market Restraints
- 4.3.1 Escalating Content Acquisition and Production Costs
- 4.3.2 High Churn and Subscription Stacking
- 4.3.3 Bandwidth Constraints and Playback Quality Gaps
- 4.3.4 Regulatory, Privacy, and Content Compliance Complexity
- 4.4 Impact of Macroeconomic Factors on the Market
- 4.5 Industry Value Chain Analysis
- 4.6 Regulatory Landscape
- 4.7 Technological Outlook
- 4.8 Porter's Five Forces Analysis
- 4.8.1 Bargaining Power of Suppliers
- 4.8.2 Bargaining Power of Buyers
- 4.8.3 Threat of New Entrants
- 4.8.4 Threat of Substitutes
- 4.8.5 Competitive Rivalry
5 MARKET SIZE AND GROWTH FORECASTS (VALUE)
- 5.1 By Monetization Model
- 5.1.1 SVOD
- 5.1.2 AVOD
- 5.1.3 TVOD
- 5.1.4 Hybrid
- 5.1.5 Freemium
- 5.2 By Device Types
- 5.2.1 Smartphones and Tablets
- 5.2.2 Smart TVs
- 5.2.3 Laptops and Desktops
- 5.2.4 Other Device Types
- 5.3 By Content Genre
- 5.3.1 Movies and Films
- 5.3.2 TV Shows and Episodic Content
- 5.3.3 Documentaries
- 5.3.4 Other Content Genres
- 5.4 By Geography
- 5.4.1 North America
- 5.4.1.1 United States
- 5.4.1.2 Canada
- 5.4.1.3 Mexico
- 5.4.2 South America
- 5.4.2.1 Brazil
- 5.4.2.2 Argentina
- 5.4.2.3 Chile
- 5.4.2.4 Rest of South America
- 5.4.3 Europe
- 5.4.3.1 Germany
- 5.4.3.2 United Kingdom
- 5.4.3.3 France
- 5.4.3.4 Italy
- 5.4.3.5 Spain
- 5.4.3.6 Rest of Europe
- 5.4.4 Asia-Pacific
- 5.4.4.1 China
- 5.4.4.2 Japan
- 5.4.4.3 India
- 5.4.4.4 South Korea
- 5.4.4.5 Australia
- 5.4.4.6 Rest of Asia-Pacific
- 5.4.5 Middle East
- 5.4.5.1 Saudi Arabia
- 5.4.5.2 United Arab Emirates
- 5.4.5.3 Qatar
- 5.4.5.4 Rest of Middle East
- 5.4.6 Africa
- 5.4.6.1 South Africa
- 5.4.6.2 Egypt
- 5.4.6.3 Nigeria
- 5.4.6.4 Rest of Africa
- 5.4.1 North America
6 COMPETITIVE LANDSCAPE
- 6.1 Market Concentration
- 6.2 Strategic Moves
- 6.3 Market Share Analysis
- 6.4 Company Profiles (includes Global Level Overview, Market Level Overview, Core Segments, Financials as available, Strategic Information, Market Rank/Share, Products and Services, Recent Developments)
- 6.4.1 Netflix Inc.
- 6.4.2 Google LLC
- 6.4.3 Prime Video (Amazon.com, Inc.)
- 6.4.4 The Walt Disney Company
- 6.4.5 Tencent Holdings Limited
- 6.4.6 Apple Inc.
- 6.4.7 Warner Bros. Discovery, Inc.
- 6.4.8 Comcast Corporation
- 6.4.9 Paramount Global
- 6.4.10 Roku, Inc.
- 6.4.11 Baidu, Inc.
- 6.4.12 Alibaba Group Holding Limited
- 6.4.13 DAZN Group Limited
- 6.4.14 JioStar Private Limited
- 6.4.15 PCCW Media Limited
- 6.4.16 Zee Entertainment Enterprises Limited
- 6.4.17 MBC Group
- 6.4.18 Canal+ Group
- 6.4.19 Rakuten Group, Inc.
- 6.4.20 Starz Entertainment, LLC
7 MARKET OPPORTUNITIES AND FUTURE OUTLOOK
- 7.1 White-Space and Unmet-Need Assessment


