
|
시장보고서
상품코드
2124570
미국의 OTT : 시장 점유율 분석, 업계 동향 및 통계, 성장 예측(2026-2031년)United States OTT - Market Share Analysis, Industry Trends & Statistics, Growth Forecasts (2026 - 2031) |
||||||
 Mordor Intelligence
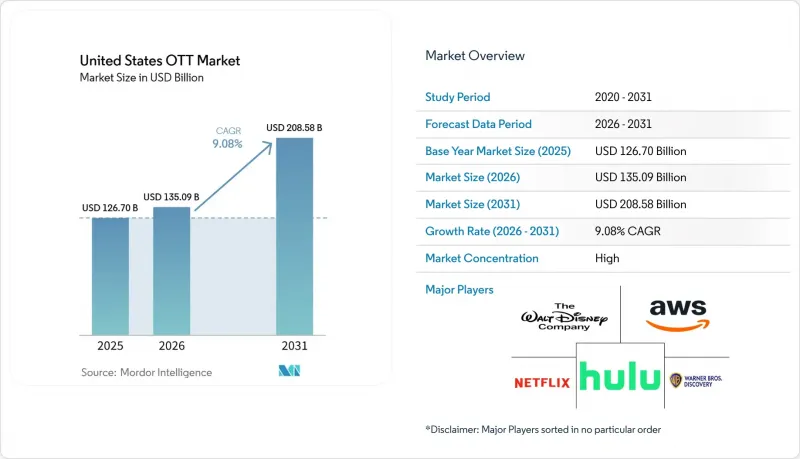
Mordor Intelligence에 의하면, 미국의 OTT 시장 규모는 2026년에 1,350억 9,000만 달러에 이르고, 2031년까지 2,085억 8,000만 달러로 확대되어 CAGR 9.08%를 나타낼 것으로 예측됩니다.
본 보고서는 수익 모델(SVOD, TVOD, AVOD 및 구독과 광고의 하이브리드), 기기 유형(스마트폰·태블릿,스마트 TV, 노트북·데스크톱 PC, 게임기, 셋톱박스·미디어 스트리머), 컨텐츠 장르(영화, TV 프로그램·에피소드형 컨텐츠, 다큐멘터리, 기타 컨텐츠 장르)별로 분류되어 있습니다. 시장 예측은 금액(달러) 기준으로 제시되어 있습니다.
미국의 OTT 시장 동향 및 인사이트
미국 가구의 ‘코드 커팅’ 비율 상승이 DTC(Direct-to-Consumer)의 보급을 가속화
2025년, 유료 TV를 구독하지 않는 가구 수가 유료 TV 구독 가구 수를 넘어섬에 따라 ‘코드 커팅’은 미국의 OTT 시장을 형성하는 결정적인 요인이 되었습니다. 비디오 광고국(Video Advertising Bureau)의 보고서에 따르면, 2025년에는 7,720만 가구가 코드 커팅을 실천했으며, 2026년 말까지 그 총수는 8,070만 가구에 달할 것으로 예측됩니다. 2025년 12월 기준, 미국 TV 시청 총 시간 중 스트리밍이 47.5%를 차지했고, 케이블 TV는 20.2%, 지상파 방송은 21.4%를 기록했습니다. 기존 유료 TV를 해지하는 각 가구는 하나 이상의 OTT 서비스의 직접 고객이 됩니다. 이러한 변화로 인해 플랫폼 측은 과금, 요금제 선택, 광고 노출에 대해 더 큰 통제권을 갖게 될 것입니다. 또한 소비자가 쉽게 제공업체를 바꿀 수 있게 됨에 따라 고객 유지의 중요성이 높아지고 있습니다.
광섬유 및 5G 네트워크의 급속한 확장이 더 높은 품질의 스트리밍을 실현
광대역 품질 향상은 고해상도 동영상 스트리밍의 신뢰성을 높여 미국의 OTT 시장을 뒷받침하고 있습니다. 유선 및 무선 회선 속도가 향상됨에 따라 버퍼링이 줄어들고, 4K 프로그램의 시청 완료율이 높아질 가능성이 있습니다. 시청 경험의 향상은 서비스 품질 저하로 인한 해지를 줄이고, 커넥티드 TV 서비스의 광고 공간을 늘리는 결과로 이어집니다. 광섬유 및 고정 무선 접속을 통해 기존 케이블 네트워크로는 안정적인 고대역폭 시청이 어려웠던 교외 및 농촌 지역에도 프리미엄 스트리밍 서비스를 확대할 수 있게 됩니다. 연방통신위원회(FCC)는 농촌 지역의 통신망 정비 및 인프라 확장을 위한 광대역 지원을 지속하고 있습니다. 플랫폼이 새로 인터넷에 연결된 가구의 요구를 충족하는 서비스와 컨텐츠를 제공할 수 있다면, 이러한 투자를 통해 예측 기간 동안 서비스 제공 대상 가구 수를 확대할 가능성이 있습니다.
컨텐츠 라이선싱 비용 증가와 프리미엄 IP를 둘러싼 경쟁이 이익률을 압박
컨텐츠 라이선싱 비용은 미국의 OTT 시장에 여전히 큰 제약 요인으로 작용하고 있습니다. 넷플릭스와 소니 픽처스 엔터테인먼트는 2026년 1월, 70억 달러 이상의 가치를 지닌 세계 ‘Pay-1’ 라이선스 계약을 체결했습니다. 한편, 디즈니는 2026 회계연도 컨텐츠 예산을 10억 달러 증액해 240억 달러로 책정했으며, 그 주된 요인으로 NBA 중계권을 꼽았습니다. 이러한 움직임은 주요 플랫폼에게 프리미엄 프랜차이즈, 극장 개봉권, 그리고 라이브 스포츠가 여전히 중요함을 보여줍니다. 또한, 새로운 AVC(H.264) 스트리밍 요금 체계 역시 대규모 플랫폼의 경우 연간 고정비 증가 요인이 될 수 있습니다. 소규모 서비스 사업자의 경우, 컨텐츠 및 기술 비용을 다수의 가입자에게 분산시키는 데 필요한 규모가 부족할 가능성이 있습니다. 각 플랫폼은 가격 책정, 광고 수익, 엄격한 컨텐츠 지출 관리, 라이선싱 제휴 및 인수를 통해 이러한 과제에 대응하고 있습니다.
부문별 분석
2025년, SVOD는 미국의 OTT 시장 점유율의 51.75%를 차지하며 가장 큰 수익 모델이 되었습니다. 월간 정기 구독은 예측 가능한 수익 기반을 제공하므로 플랫폼의 경제성에서 여전히 중심적인 역할을 하고 있습니다. 연속 드라마와 폭넓은 컨텐츠 라이브러리는 주요 작품 출시 시 재사용을 뒷받침하고 있습니다. 디즈니가 제공하는 ‘Disney+’, ‘Hulu’, ‘ESPN+’의월29.99달러 번들 요금제는 서비스를 결합함으로써 가구당 가치를 얼마나 높일 수 있는지를 보여줍니다. 보도에 따르면, 이 번들 요금제 덕분에 2026년 1월 이후 국내에서 1,100만 명의 신규 가입자가 증가했다고 합니다. TVOD는 정기적인 서비스 계약을 유지하는 것보다 개별 타이틀이나 라이브 이벤트에 대해 일회성 결제를 원하는 시청자에게 서비스를 제공합니다. 구독 서비스가 신작을 더 빠르게 카탈로그에 추가함에 따라 TVOD의 역할은 점점 더 제한적으로 변하고 있습니다.
구독과 광고를 결합한 하이브리드 요금제는 주요 플랫폼이 다양한 예산을 가진 가구에 서비스를 제공하는 방식을 변화시키고 있습니다. 초안에 따르면, 2026년에는 OTT 구독자 중 80.4%가 적어도 하나의 광고 포함 구독 서비스를 이용할 것으로 예상되며, 이는 2024년의 71.5%에서 증가한 수치입니다. AVOD는 가장 빠르게 성장하는 수익 모델이며, 미국의 OTT 시장에서 AVOD의 규모는 2031년까지 연평균 성장률(CAGR) 9.71%로 확대될 것으로 예측됩니다. 비디오 광고국(Video Advertising Bureau)의 예측에 따르면, 2026년에는 미국에서 2억 940만 명의 AVOD 시청자가 있을 것으로 전망됩니다. 또한, FAST의 시청자 수도 2026년에는 1억 2,500만 명을 넘어설 것으로 예측됩니다. 이러한 규모 확대는 광고주를 유치하고, 컨텐츠 확보를 위한 자금원이 되며, 무료 또는 저가 서비스의 매력을 높이는 결과로 이어집니다. 넷플릭스의 자체 광고 플랫폼이 보여주듯이, 주요 구독 서비스 기업들은 현재 광고 인프라를 전략적 기능으로 자리매김하고 있습니다.
기타 혜택 :
- 엑셀 형식 시장 예측(ME) 시트
- 3개월간의 애널리스트 지원
자주 묻는 질문
목차
제1장 서론
제2장 조사 방법
제3장 주요 요약
제4장 시장 구도
제5장 시장 규모 및 성장 예측
제6장 경쟁 구도
제7장 시장 기회 및 향후 전망
KTH 26.09.14According to Mordor Intelligence, the United States OTT market size reached USD 135.09 billion in 2026 and is projected to climb to USD 208.58 billion by 2031, advancing at an 9.08% CAGR.
This report is Segmented by Revenue Model (SVOD, TVOD, AVOD, and Hybrid Subscription and Ads), Device Type (Smartphones and Tablets, Smart TVs, Laptops and Desktops, Game Consoles, and Set-Top Boxes and Media Streamers), and Content Genre (Movies and Films, TV Shows and Episodic Content, Documentaries, and Other Content Genres). The Market Forecasts are Provided in Terms of Value (USD).
United States OTT Market Trends and Insights
Rising Cord-Cutting Rates Among US Households Accelerate Direct-to-Consumer Adoption
Cord-cutting became a defining force for the United States OTT market in 2025, when non-pay-TV households outnumbered pay-TV households. The Video Advertising Bureau reported that 77.2 million US households had cut the cord in 2025, and it expects the total to reach 80.7 million by the end of 2026. Streaming accounted for 47.5% of total US television viewing in December 2025, compared with 20.2% for cable and 21.4% for broadcast. Each household that leaves traditional pay television becomes a direct customer of one or more OTT services. The change gives platforms more control over billing, plan selection, and advertising exposure. It also makes retention more important, as consumers can switch providers with little effort.
Rapid Expansion of Fiber and 5G Networks Enables Higher-Quality Streaming
Broadband quality supports the United States OTT market by improving the reliability of high-resolution video delivery. Faster fixed and wireless connections reduce buffering and can improve completion rates for 4K programming. Better viewing experiences can reduce cancellations caused by poor service quality and increase advertising inventory on connected television services. Fiber and fixed wireless access can extend premium streaming to exurban and rural areas where legacy cable networks may not support consistent high-bandwidth viewing. The Federal Communications Commission has continued to direct broadband support toward rural coverage and infrastructure expansion. These investments can enlarge the addressable household base over the forecast period if platforms offer services and content that meet the needs of newly connected households.
Growing Content Licensing Costs and Competition for Premium IP Squeeze Margins
Content licensing costs remain a significant restraint on the United States OTT market. Netflix and Sony Pictures Entertainment finalized a global Pay-1 licensing agreement valued above USD 7 billion in January 2026, while Disney increased its fiscal 2026 content budget by USD 1 billion to USD 24 billion, with NBA rights identified as a major driver. These commitments show the continuing importance of premium franchises, theatrical rights, and live sports to leading platforms. New AVC, or H.264, streaming fee structures can also add fixed annual expenses for large platforms. Smaller services may lack the scale needed to spread content and technology costs across a large subscriber base. Platforms are responding through pricing, advertising income, disciplined content spending, licensing partnerships, and acquisitions.
Other drivers and restraints analyzed in the detailed report include:
- Shift Toward Ad-Supported and Hybrid Models Expands Audience Reach
- Niche SVOD Services Targeting Multicultural and Faith-Based Audiences Unlock New Subscriber Pools
- Market Saturation and Subscriber Churn Fueled by Low Switching Costs
For complete list of drivers and restraints, kindly check the Table Of Contents.
Segment Analysis
SVOD held 51.75% of the United States OTT market share in 2025, making it the largest revenue model. Recurring monthly subscriptions remain central to platform economics because they provide a predictable revenue base. Serialized programming and broad content libraries support reuse across major releases. Disney's USD 29.99 monthly bundle for Disney+, Hulu, and ESPN+ illustrates how combined services can increase value for households. The bundle reportedly added 11 million domestic subscribers since January 2026. TVOD serves viewers who prefer to pay for individual titles or live events rather than maintain a recurring service. Its role is more limited as subscription services move recent releases into their catalogs faster.
Hybrid subscription and advertising plans are changing the way leading platforms serve households across different budgets. The draft states that 80.4% of sub-OTT viewers are expected to have at least 1 advertising-supported subscription in 2026, compared with 71.5% in 2024. AVOD is the fastest-growing revenue model, with the United States OTT market size for AVOD projected to expand at a 9.71% CAGR through 2031. The Video Advertising Bureau projects that there will be 209.4 million AVOD viewers in the United States in 2026. FAST viewership is also projected to exceed 125 million viewers in 2026. Greater scale can attract advertisers, fund content acquisitions, and improve the appeal of free or low-cost services. Netflix's in-house advertising platform shows that the largest subscription services now treat advertising infrastructure as a strategic capability.
Complete Report Scope:
- By Revenue Model
- SVOD
- TVOD
- AVOD
- Hybrid Subscription and Ads
- By Device Type
- Smartphones and Tablets
- Smart TVs
- Laptops and Desktops
- Game Consoles
- Set-Top Boxes and Media Streamers
- By Content Genre
- Movies and Films
- TV Shows and Episodic Content
- Documentaries
- Other Content Genres
List of Companies Covered in this Report:
- Netflix, Inc.
- The Walt Disney Company
- Amazon.com, Inc.
- Hulu, LLC (The Walt Disney Company)
- Warner Bros. Discovery, Inc.
- Comcast Corporation
- Paramount Global
- Apple Inc.
- Roku, Inc.
- Google LLC
- DISH Network Corporation (EchoStar Corporation)
- FuboTV Inc.
- Fox Corporation
- Crunchyroll, LLC (Sony Group Corporation)
- BritBox LLC
- Starz Entertainment, LLC (Lions Gate Entertainment Corp.)
- ESPN+ (The Walt Disney Company)
- AMC Networks Inc.
Additional Benefits:
- The market estimate (ME) sheet in Excel format
- 3 months of analyst support
TABLE OF CONTENTS
1 INTRODUCTION
- 1.1 Study Assumptions and Market Definition
- 1.2 Scope of the Study
2 RESEARCH METHODOLOGY
3 EXECUTIVE SUMMARY
4 MARKET LANDSCAPE
- 4.1 Market Overview
- 4.2 Market Drivers
- 4.2.1 Rising Cord-Cutting Rates Among US Households Accelerating Direct-to-Consumer Adoption
- 4.2.2 Rapid Expansion of Fiber and 5G Networks Enabling Higher-Quality Streaming
- 4.2.3 Shift Toward Ad-Supported and Hybrid Models Expanding Audience Reach
- 4.2.4 Emergence of Niche SVOD Services Targeting Multicultural and Faith-Based Audiences Unlocking New Subscriber Pools
- 4.2.5 Tax Incentive Programs by States for In-State Original Content Production Lowering Cost Barriers
- 4.2.6 Adoption of AI-Powered Hyper-Personalization Increasing Average Watch Time and Retention
- 4.3 Market Restraints
- 4.3.1 Growing Content Licensing Costs and Competition for Premium IP Squeezing Margins
- 4.3.2 Market Saturation and Subscriber Churn Fueled by Low Switching Costs
- 4.3.3 Declining Content Discoverability Amid App Overload Reducing Engagement
- 4.3.4 Rising Carbon Footprint Scrutiny of Streaming Workloads Triggering Regulatory Headwinds
- 4.4 Industry Value Chain Analysis
- 4.5 Regulatory Outlook
- 4.6 Impact of Macroeconomic Factors on the Market
- 4.7 Technological Outlook
- 4.8 Porter's Five Forces Analysis
- 4.8.1 Bargaining Power of Suppliers
- 4.8.2 Bargaining Power of Buyers
- 4.8.3 Threat of New Entrants
- 4.8.4 Threat of Substitutes
- 4.8.5 Intensity of Competitive Rivalry
5 MARKET SIZE AND GROWTH FORECASTS (VALUE)
- 5.1 By Revenue Model
- 5.1.1 SVOD
- 5.1.2 TVOD
- 5.1.3 AVOD
- 5.1.4 Hybrid Subscription and Ads
- 5.2 By Device Type
- 5.2.1 Smartphones and Tablets
- 5.2.2 Smart TVs
- 5.2.3 Laptops and Desktops
- 5.2.4 Game Consoles
- 5.2.5 Set-Top Boxes and Media Streamers
- 5.3 By Content Genre
- 5.3.1 Movies and Films
- 5.3.2 TV Shows and Episodic Content
- 5.3.3 Documentaries
- 5.3.4 Other Content Genres
6 COMPETITIVE LANDSCAPE
- 6.1 Market Concentration
- 6.2 Strategic Moves
- 6.3 Market Share Analysis
- 6.4 Company Profiles (includes Global Level Overview, Market Level Overview, Core Segments, Financials as Available, Strategic Information, Market Rank/Share for Key Companies, Products and Services, and Recent Developments)
- 6.4.1 Netflix, Inc.
- 6.4.2 The Walt Disney Company
- 6.4.3 Amazon.com, Inc.
- 6.4.4 Hulu, LLC (The Walt Disney Company)
- 6.4.5 Warner Bros. Discovery, Inc.
- 6.4.6 Comcast Corporation
- 6.4.7 Paramount Global
- 6.4.8 Apple Inc.
- 6.4.9 Roku, Inc.
- 6.4.10 Google LLC
- 6.4.11 DISH Network Corporation (EchoStar Corporation)
- 6.4.12 FuboTV Inc.
- 6.4.13 Fox Corporation
- 6.4.14 Crunchyroll, LLC (Sony Group Corporation)
- 6.4.15 BritBox LLC
- 6.4.16 Starz Entertainment, LLC (Lions Gate Entertainment Corp.)
- 6.4.17 ESPN+ (The Walt Disney Company)
- 6.4.18 AMC Networks Inc.
7 MARKET OPPORTUNITIES AND FUTURE OUTLOOK
- 7.1 White-Space and Unmet-Need Assessment