

|
시장보고서
상품코드
2115057
아시아태평양의 전기 버스 시장 : 시장 점유율 분석, 업계 동향 및 통계, 성장 예측(2026-2031년)Asia Pacific Electric Bus - Market Share Analysis, Industry Trends & Statistics, Growth Forecasts (2026 - 2031) |
||||||
 Mordor Intelligence
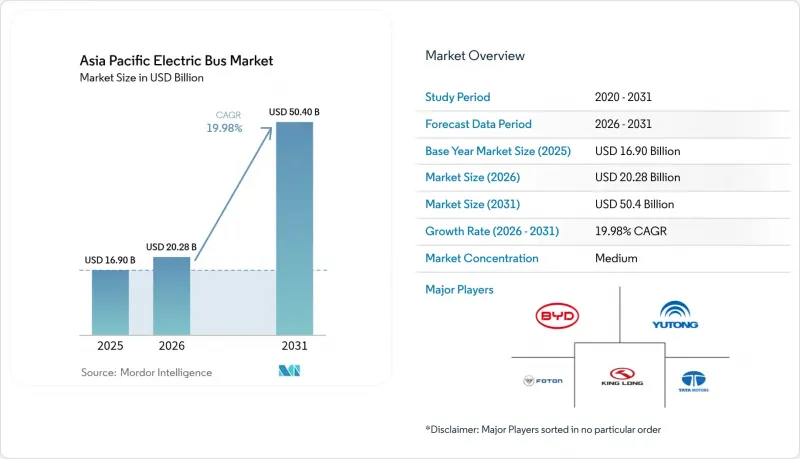
Mordor Intelligence에 의하면, 아시아태평양의 전기 버스 시장 규모는 2025년에 169억 달러로 평가되었고, 2026년 202억 8,000만 달러에서 2031년까지 504억 달러에 이를 것으로 예측되며, 예측 기간(2026-2031년) CAGR은 19.98%를 나타낼 전망입니다.
본 보고서는 추진 방식별(배터리식 전기 버스, 하이브리드식 전기 버스 등), 버스 전장별(9미터 미만, 9-14미터, 기타), 용도별(도시 간, 시내, 기타), 최종 사용자별(대중교통 기관 및 민간 차량 운영 사업자), 국가별(중국, 인도, 기타)로 분류되어 있습니다. 시장 전망은 금액(달러) 및 수량(대)으로 제시되어 있습니다.
아시아태평양의 전기 버스 시장 동향 및 인사이트
중국 및 인도에서의 주요 구매 보조금 갱신 물결
보조금 연장이 동시에 이루어짐에 따라, 미결 주문에 힘입어 꾸준한 수요가 발생하여 대규모 생산을 정당화하고, 부품 공급 계약을 긴박하게 만드는 요인이 되고 있습니다. 베이징시의 버스 구매 장려책에 포함된 70% 현지 조달률 규정은 국내 공급업체를 보호하는 한편, 인도의 5,500 카롤 루피(6억 6,000만 달러) 예산 배분으로 인해 주 정부의 입찰이 수년에 걸친 차량 도입 계획으로 유도되고 있습니다. 각 제조업체들은 두 프로그램의 갱신 후 몇 주 이내에 상당한 수의 주문을 확보하여 공장 가동률을 안정시키는 한편, 지속적인 재정 지원 없이도 디젤 차량과 비용 parity를 실현하는 단계로 나아가고 있습니다.
LFP 배터리 팩 가격이 1kWh당 100달러 아래로 떨어지며 TCO 비용 균형을 실현
2024년, 중국 공장의 생산 능력 확대를 배경으로 인산철 리튬(LFP) 배터리 팩의 가격이 대폭 하락했습니다. 이 획기적인 진전으로 제조업체들은 고정 비용을 더 많은 생산량에 분산시킬 수 있게 되어, 이 기술의 비용 효율성이 높아졌습니다. 비용 감소로 인해 표준 도시 노선에서의 투자 회수 기간이 현저히 단축되어, 보조금 없이도 전기차 구매가 경제적으로 가능해졌습니다. 또한, 비용 예측 가능성이 향상됨에 따라 리스 회사는 주행 거리에 따른 계약을 제공할 수 있게 되었으며, 재정적 제약이 있는 지방자치단체의 배터리 성능에 대한 리스크가 완화되었습니다. 동남아시아의 구매자들은 이러한 추세로부터 가장 큰 혜택을 볼 것으로 예측됩니다.
팬데믹으로 인한 운임 수입 감소 이후 지방 자치단체의 재정 제약
지자체 수지는 팬데믹 이전 수준에 비해 상당한 수입 부족에 직면해 있어 재정 안정성에 문제를 야기하고 있습니다. 이러한 지속적인 수지 격차로 인해 대출 한도 접근이 제한되고, 전기 버스 도입을 우선시해야 할 차량 교체 입찰이 지연되고 있습니다. 뭄바이에서는 BEST가 상당한 재정적 손실에 직면해 있으며, 운영 비용 절감이 예상된다는 명확한 증거가 있음에도 불구하고 조달 계획을 대폭 축소할 수밖에 없는 상황입니다. 마찬가지로 방콕의 교통 기관도 팬데믹으로 인한 재정 적자로 인해 추가 차입 확보가 제한되고 있다는 점을 이유로, 유사한 감축을 피할 수 없는 상황입니다.
부문 분석
배터리식 전기 버스(BEB)는 2025년 인도 대수의 78.62%를 차지했으며, 고밀도 도시 순환 운행에 적합한 검증된 차고 충전 생태계를 제공합니다. 이 점유율은 아시아태평양 전기 버스 시장에서 가장 높은 것으로, LFP(인산철 리튬) 배터리와 저상 섀시 설계가 단거리 운행 일정에 얼마나 적합한지를 여실히 보여줍니다. 고출력 차고용 충전기, 에너지 가격 차익 거래, 그리고 투자 회수 기간 단축이 BEB의 경제성을 더욱 높이고 있습니다. 그러나 신흥 연료전지 전기버스와 비교하면 이 부문의 성장은 둔화되고 있습니다. 도시 간 노선에서 수소 충전 비용의 경쟁력이 향상됨에 따라 BEB의 성장 우위가 서서히 사라지고 있기 때문입니다.
연료전지 전기 버스는 2030년까지 900곳의 충전소를 설치하겠다는 일본과 한국의 수소 로드맵을 활용하여 연평균 성장률(CAGR) 27.88%를 나타낼 것으로 예측됩니다. 노선 시뮬레이션에 따르면, 1일 주행 거리가 400km를 초과하는 경우, 거리 가중 비용 측면에서 연료전지 전기 버스(FCEB)가 배터리식 버스를 능가합니다. 현재 각 OEM 업체들은 버스 계약에 수소 공급 계약을 포함시켜, 가격 변동에 대한 사업자의 우려를 완화하고 있습니다. 한편, 태국과 말레이시아에서는 단계적인 전동화로 인해 자본 비용이 더 긴 기간에 분산되기 때문에 하이브리드차와 플러그인 하이브리드차가 여전히 주류를 이루고 있습니다.
9-14미터급은 2025년 출하 대수의 56.71%를 차지했으며, 기동성, 승객 밀도 및 TCO(총 소유 비용) 측면에서 최적의 부문임이 확인되었습니다. 이러한 우위 덕분에 아시아태평양 전기 버스 시장에서 가장 큰 하위 부문 규모를 자랑하고 있으며, 상하이, 자카르타, 델리에서의 재주문이 수명 주기 경제성을 뒷받침하고 있습니다. OEM 플랫폼은 저상 설계 하에 350-450kWh의 배터리 팩을 통합하면서도 통로 레이아웃을 유지하고 있습니다.
14미터 초과 버스의 경우, 사업자들이 운전기사 인건비 절감과 노선망 통합을 추진함에 따라 2031년까지 연평균 성장률(CAGR) 21.65%로 확대될 것으로 예측됩니다. 서울과 홍콩에서는 출퇴근 시간대 혼잡 해소 방안으로 2층 버스나 연결 버스가 도입되고 있으며, 대만의 해안 고속 노선에서는 배터리 교환식 버스가 도입되고 있습니다. 9미터 미만의 미니버스는 여전히 틈새 시장이지만, 캠퍼스 내, 공항 및 피더 서비스에서 수요가 증가하고 있습니다.
기타 혜택 :
- 엑셀 형식 시장 예측(ME) 시트
- 3개월간의 애널리스트 지원
자주 묻는 질문
목차
제1장 서론
제2장 조사 방법
제3장 주요 요약
제4장 시장 구도
제5장 시장 규모 및 성장 예측(금액 : 달러, 수량 : 단위)
제6장 경쟁 구도
제7장 시장 기회 및 향후 전망
AJY 26.08.28According to Mordor Intelligence, the Asia Pacific electric bus market size was valued at USD 16.90 billion in 2025 and estimated to grow from USD 20.28 billion in 2026 to reach USD 50.4 billion by 2031, at a CAGR of 19.98% during the forecast period (2026-2031).
This report is Segmented by Propulsion Type (Battery Electric Bus, Hybrid Electric Bus, and More), Bus Length (Below 9 M, 9-14 M, and More), Application (Inter-City, Intra-City, and More), End-User (Public Transport Authorities and Private Fleet Operators), and Country (China, India, and More). The Market Forecasts are Provided in Terms of Value (USD) and Volume (Units).
Asia Pacific Electric Bus Market Trends and Insights
Mainstream Purchase-Subsidy Renewal Waves in China and India
Synchronizing subsidy extensions has generated steady backlog-driven demand that justifies large production runs and tightens component supply contracts. Beijing's bus incentive with 70% local-content rules protects domestic suppliers, while India's INR 5,500 crore (USD 660 million) allocation channels state tenders into multi-year fleet plans. Manufacturers secured a significant number of orders within weeks of both programs' renewal, locking in factory utilization rates and advancing cost parity against diesel fleets without perpetual fiscal support.
Falling LFP Battery-Pack Prices Below USD 100 kWh Enabling TCO Parity
In 2024, lithium-iron-phosphate (LFP) pack prices experienced a significant decline, driven by the increased production capacity of Chinese plants. This milestone allowed manufacturers to distribute fixed costs over larger volumes, making the technology more cost-effective. The reduced costs have notably shortened payback periods for standard urban routes, making electric vehicle purchases more financially viable even without subsidies. Additionally, improved cost predictability has enabled leasing firms to offer mileage-indexed contracts, mitigating battery-performance risks for financially constrained agencies. Southeast Asian buyers are expected to benefit the most from this development.
Municipal Balance-Sheet Constraints After Pandemic Fare Losses
Municipal ledgers are struggling with significant revenue shortfalls compared to pre-pandemic levels, creating challenges for financial stability. These ongoing gaps are restricting access to credit lines and delaying fleet-replacement tenders, which would otherwise prioritize the adoption of electric buses. In Mumbai, BEST is facing considerable financial losses, which have forced a substantial reduction in its procurement plans, even though there is clear evidence of potential savings in operating costs. Similarly, Bangkok's transit agency has been compelled to make similar cutbacks, citing financial deficits stemming from the pandemic that have limited its ability to secure additional borrowing.
Other drivers and restraints analyzed in the detailed report include:
- National Zero-Emission Fleet Mandates (e.g., Singapore 2040, S-Korea 2030)
- Dedicated Green-Bond Financing Models for Transit Agencies
- Sub-MW Depot Connection Bottlenecks in Tier-2/3 Indian and ASEAN Cities
For complete list of drivers and restraints, kindly check the Table Of Contents.
Segment Analysis
Battery electric buses (BEBs) account for 78.62% of 2025 deliveries, offering proven depot-charging ecosystems that fit dense urban loops. This slice translates to the largest Asia Pacific electric bus market share, underscoring how LFP chemistry and low-floor chassis designs align with short-haul scheduling. High-power depot chargers, energy-price arbitrage, and shorter payback windows reinforce BEB economics. Yet the segment's growth is decelerating compared with emerging fuel-cell electric buses, whose hydrogen refueling parity on inter-city routes is eroding BEB's growth lead.
Fuel-cell electric buses notch a projected 27.88% CAGR by leveraging Japan and South Korea's hydrogen roadmaps, which include 900 refueling stations by 2030 . Route modeling shows FCEBs outperform batteries on distance-weighted cost when daily mileage exceeds 400 km. OEMs now bundle hydrogen supply agreements into bus contracts, easing operator fears over price volatility. Meanwhile, hybrid and plug-in hybrid variants persist in Thailand and Malaysia, where phased electrification spreads capital cost over longer cycles.
The 9-14 meter class holds 56.71% of 2025 shipments, confirming its sweet spot for maneuverability, passenger density, and TCO. Its prominence also yields the largest Asia Pacific electric bus market size sub-segment, with repeat orders from Shanghai, Jakarta, and Delhi validating lifecycle economics. OEM platforms integrate 350-450 kWh packs under low-floor designs, keeping aisle layouts intact.
Buses above 14 meters are projected to expand 21.65% CAGR through 2031 as operators target driver labor savings and network consolidation. Double-deck and articulated formats address peak-hour crowding in Seoul and Hong Kong, while battery-swap variants are entering Taiwan's coastal express lines. Sub-9-meter minibuses remain niche but gain traction in campus, airport, and feeder services.
Complete Report Scope:
- By Propulsion Type
- Battery Electric Bus (BEB)
- Hybrid Electric Bus (HEB)
- Plug-in Hybrid Electric Bus (PHEB)
- Fuel-Cell Electric Bus (FCEB)
- By Bus Length
- Below 9 M
- 9 - 14 M
- Above 14 M
- By Application
- Inter-city
- Intra-city
- Airport Shuttle
- School Transport
- By End-User
- Public Transport Authorities
- Private Fleet Operators
- By Country
- China
- India
- Japan
- South Korea
- Rest of Asia-Pacific
List of Companies Covered in this Report:
- BYD Company Ltd.
- Zhengzhou Yutong Bus Co., Ltd.
- CRRC Electric Vehicle Co., Ltd.
- Xiamen King Long Motor Group Co., Ltd.
- Zhongtong Bus Holding Co., Ltd.
- Beijing Foton AUV Bus Co., Ltd.
- Anhui Ankai Automobile Co., Ltd.
- Higer Bus Company Limited
- Skywell New Energy Automobile Group
- Shanghai Sunwin Bus Corporation
- Tata Motors Limited
- Ashok Leyland Limited
- Olectra Greentech Limited
- JBM Group
- Hyundai Motor Company
- Mitsubishi Fuso Truck and Bus Corporation
- Isuzu Motors Limited
- NFI Group (Alexander Dennis Limited)
- Volvo Buses
Additional Benefits:
- The market estimate (ME) sheet in Excel format
- 3 months of analyst support
TABLE OF CONTENTS
1 Introduction
- 1.1 Study Assumptions and Market Definition
- 1.2 Scope of the Study
2 Research Methodology
3 Executive Summary
4 Market Landscape
- 4.1 Market Overview
- 4.2 Market Drivers
- 4.2.1 Mainstream Purchase-Subsidy Renewal Waves in China and India
- 4.2.2 Falling Lithium Iron Phosphate (LFP) Battery-Pack Prices Below USD 100 kWh Enabling Total Cost of Ownership (TCO) Parity
- 4.2.3 National Zero-Emission Fleet Mandates (e.g., Singapore 2040, S-Korea 2030)
- 4.2.4 Dedicated Green-Bond Financing Models for Transit Agencies
- 4.2.5 Battery Electric Bus (BEB) Depot-Charging Load-Management Software Reduces Grid-Upgrade CAPEX
- 4.2.6 Local-Content Incentives Spawning ASEAN Assembly Hubs
- 4.3 Market Restraints
- 4.3.1 Municipal Balance-Sheet Constraints After Pandemic Fare Losses
- 4.3.2 Sub-MW Depot Connection Bottlenecks in Tier-2/3 Indian and ASEAN Cities
- 4.3.3 Excess Battery-Cell Capacity Compressing Supplier Margins and Raising Failure Risk
- 4.3.4 Persistent Range-Anxiety on Hilly Inter-City Routes
- 4.4 Value / Supply-Chain Analysis
- 4.5 Regulatory Landscape
- 4.6 Technological Outlook
- 4.7 Porter's Five Forces
- 4.7.1 Threat of New Entrants
- 4.7.2 Bargaining Power of Suppliers
- 4.7.3 Bargaining Power of Buyers
- 4.7.4 Threat of Substitutes
- 4.7.5 Competitive Rivalry
5 Market Size and Growth Forecasts (Value in USD and Volume in Units)
- 5.1 By Propulsion Type
- 5.1.1 Battery Electric Bus (BEB)
- 5.1.2 Hybrid Electric Bus (HEB)
- 5.1.3 Plug-in Hybrid Electric Bus (PHEB)
- 5.1.4 Fuel-Cell Electric Bus (FCEB)
- 5.2 By Bus Length
- 5.2.1 Below 9 M
- 5.2.2 9 - 14 M
- 5.2.3 Above 14 M
- 5.3 By Application
- 5.3.1 Inter-city
- 5.3.2 Intra-city
- 5.3.3 Airport Shuttle
- 5.3.4 School Transport
- 5.4 By End-User
- 5.4.1 Public Transport Authorities
- 5.4.2 Private Fleet Operators
- 5.5 By Country
- 5.5.1 China
- 5.5.2 India
- 5.5.3 Japan
- 5.5.4 South Korea
- 5.5.5 Rest of Asia-Pacific
6 Competitive Landscape
- 6.1 Market Concentration
- 6.2 Strategic Moves
- 6.3 Market Share Analysis
- 6.4 Company Profiles (Includes Global Level Overview, Market Level Overview, Core Segments, Financials as Available, Strategic Information, Market Rank/Share for Key Companies, Products and Services, SWOT Analysis, and Recent Developments)
- 6.4.1 BYD Company Ltd.
- 6.4.2 Zhengzhou Yutong Bus Co., Ltd.
- 6.4.3 CRRC Electric Vehicle Co., Ltd.
- 6.4.4 Xiamen King Long Motor Group Co., Ltd.
- 6.4.5 Zhongtong Bus Holding Co., Ltd.
- 6.4.6 Beijing Foton AUV Bus Co., Ltd.
- 6.4.7 Anhui Ankai Automobile Co., Ltd.
- 6.4.8 Higer Bus Company Limited
- 6.4.9 Skywell New Energy Automobile Group
- 6.4.10 Shanghai Sunwin Bus Corporation
- 6.4.11 Tata Motors Limited
- 6.4.12 Ashok Leyland Limited
- 6.4.13 Olectra Greentech Limited
- 6.4.14 JBM Group
- 6.4.15 Hyundai Motor Company
- 6.4.16 Mitsubishi Fuso Truck and Bus Corporation
- 6.4.17 Isuzu Motors Limited
- 6.4.18 NFI Group (Alexander Dennis Limited)
- 6.4.19 Volvo Buses
7 Market Opportunities & Future Outlook
- 7.1 White-space & Unmet-Need Assessment


