

|
시장보고서
상품코드
2117458
북미의 전기차 시장 : 점유율 분석, 산업 동향 및 통계 데이터, 성장 예측(2026-2031년)North America Electric Vehicle - Market Share Analysis, Industry Trends & Statistics, Growth Forecasts (2026 - 2031) |
||||||
 Mordor Intelligence
Mordor Intelligence에 의하면, 북미 전기차 시장 규모는 2025년 950억 5,000만 달러, 2026년 1,026억 6,000만 달러에서 2031년까지 1,509억 2,000만 달러로 확대되어 2026년부터 2031년까지 CAGR 8.01%를 나타낼 것으로 예측됩니다.
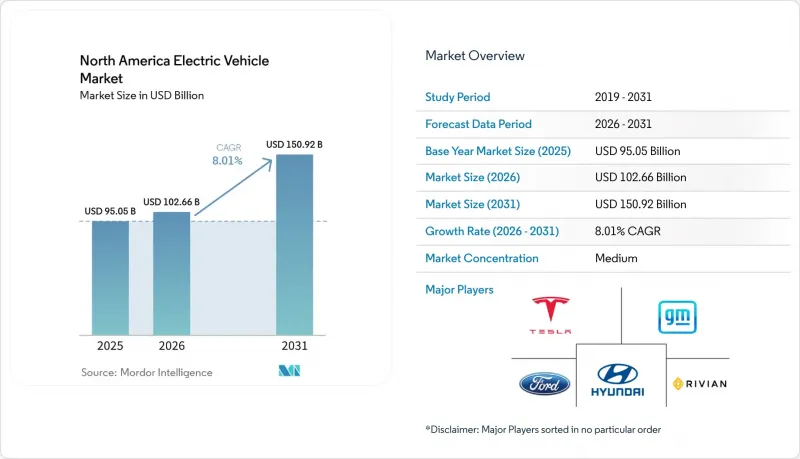
본 보고서는 차종(승용차, 소형 상용차 등), 추진 방식(배터리식 전기차, 플러그인 하이브리드차 등), 구동 방식(전륜 구동, 후륜구동 등), 출력(100kW 미만, 100-250kW 등) 및 국가별로 분류되어 있습니다. 시장 전망은 금액(달러) 및 수량(대수)의 관점에서 제시되어 있습니다.
북미 전기차 시장 동향 및 분석
배터리 비용 하락 및 주행 거리 연장
배터리 팩 가격은 2025년에 108달러/kWh까지 하락할 것이며, 인산철리튬(LFP) 화학 계열의 양산화가 진행됨에 따라 더욱 낮아질 것으로 예측됩니다. 테슬라와 LG 에너지 솔루션은 2027년에 미시간주에서 LFP 셀 공장을 가동할 예정이라고 발표(2)했으며, 이는 배터리 화학 계열의 생산 거점이 지역적으로 이동하고 있음을 뒷받침합니다. 2026년에 출시되는 모델의 대부분이 300마일이라는 대마일을 돌파하고 있으며, 시작 가격이 3만 5,000달러인 쉐보레 이쿼녹스 EV에서 볼 수 있듯이 ‘주행 거리 불안’은 점차 완화되고 있습니다. 그러나 추운 지역에서의 성능 저하로 인해 정격 주행 거리의 약 3분의 1이 감소하기 때문에 특히 캐나다에서의 보급이 제한되고 있습니다. 그럼에도 불구하고 비용이 조금씩 절감될 때마다, 구매 시 지불하는 프리미엄 가격을 상회하는 총 소유 비용 절감 효과를 기대할 수 있는 잠재적 구매자층이 확대되고 있습니다.
연방 세제 혜택과 IRA 보조금
‘인플레이션 감축법’(IRA)은 막대한 제조 세액 공제를 제공하여 소비자와 자동차 제조업체 양측의 투자 회수 기간을 단축하고 있습니다. 적격 기준은 매년 상향 조정되고 있어, 기업들은 공급망을 북미산 부품으로 재편할 수밖에 없는 상황입니다. 2024년 재무부가 발표한 지침에 따라, 우려 대상 사업체에서 공급되는 흑연을 포함한 배터리는 대상에서 제외됨에 따라, 각 OEM 업체들은 호주 및 캐나다와의 계약으로 방향을 전환하고 있습니다. 국내에 셀 생산 라인을 보유한 수직 통합형 제조업체는 이러한 규정에 대응하기 쉬워, 합작 사업에 의존하는 경쟁사들에 비해 비용 면에서 우위를 점하고 있습니다. 상용차 1대당 최대 4만 달러의 세액 공제는 택배 및 지자체 차량의 전기화를 촉진했으며, 법인 구매자가 이 보조금을 최대한 활용할 수 있게 했습니다. 적용 기준이 단계적으로 상향됨에 따라, 규정 준수 비용 측면에서는 국내에 정제 및 미드스트림 공정 생산 능력을 갖춘 공급업체가 유리해집니다.
부족한 공공 충전 인프라 밀도
NREL의 추산에 따르면, 2030년까지 2,800만 개의 충전 포트가 필요할 것으로 예상되지만, 2025년 말 시점에서는 800만 개밖에 존재하지 않았습니다. 50억 달러 규모의 연방 회랑 프로그램이 있음에도 불구하고, 인허가 병목 현상이 확장을 제한하고 있습니다. 중서부 및 애팔래치아 지역의 농촌 지역에서는 100제곱마일당 1개 미만의 충전기 밀도에 그치고 있어 장거리 이동에 걸림돌이 되고 있습니다. 캐나다 각 주별 네트워크 간에는 상호 운용성이 부족하여, 주 경계를 넘어 주행할 때는 여러 결제 시스템이 필요합니다. 충전기 설치 밀도의 격차가 줄어들기 전까지는 소비자의 신뢰도와 중고차의 재판매 가치가 계속해서 압박을 받을 것입니다.
부문 분석
승용차는 2025년 매출의 77.13%를 차지했으나, 1차 초기 채택자들에 의한 시장이 포화 상태에 이르러 성장 곡선이 완만해지고 있습니다. 가장 빠르게 성장하고 있는 부문인 소형 상용차는 9.02%의 연평균 성장률(CAGR)이 예상되는데, 이는 소포 배송업체와 지자체 차량이 일제히 배터리 구동 밴으로 전환하고 있음을 반영합니다. 미국 우정공사와 아마존의 주문은 상용차 수요의 지속성을 뒷받침하고 있으며, 한편 지자체 버스 입찰을 통해 대중교통의 전기화도 확대되고 있습니다. 따라서 북미 상용 밴용 전기차 시장 규모는 절대적인 규모는 작지만, 승용 세단보다 빠르게 확대될 전망입니다.
차량 함대의 운영 주기는 가동 시간 향상을 촉진합니다. 예측 가능한 경로를 통해 기지에서의 충전과 일일 이용률 향상이 가능해져, 1마일당 비용이 절감됩니다. 지자체 차량의 무공해화를 의무화하는 규제로 인해, 쓰레기 수거나 공항 셔틀 등의 용도에서 그 기세가 더욱 강해지고 있습니다. 자금 조달 모델도 진화하고 있으며, 리스 회사는 현재 충전기와 유지보수를 패키지로 묶어 지자체 기관의 자본 부담을 경감시키고 있습니다. 인센티브가 단계적으로 축소되더라도, 대규모 소포 배송 차량은 부하가 낮은 용도를 위한 중고 밴의 2차 시장을 제공하기 때문에 사업자는 잔존 가치의 명확성 덕분에 여전히 혜택을 받을 것입니다.
배터리식 전기차는 2025년 북미 전기차 시장에서 70.25%의 점유율을 차지하며, 연평균 성장률(CAGR) 11.22%라는 가장 빠른 성장률을 기록할 전망입니다. 캘리포니아주의 60곳 이상의 수소 충전소 네트워크와 캐나다의 파일럿 코리도(Pilot Corridor)는 배터리 중량 증가를 우려하는 대형 차량 사업자들을 끌어들이고 있습니다. 따라서 북미 전기차 시장에서 FCEV의 점유율은 신속한 연료 보급을 통해 자산 활용이 촉진되는 장거리 화물 운송이나 도시 간 장거리 버스 같은 틈새 시장에서 점차 상승할 것입니다.
각 OEM의 자원 배분에서는 서로 다른 전략을 엿볼 수 있습니다. 몇몇 유서 깊은 브랜드는 플러그인 하이브리드 차량의 모델 업데이트를 중단하고, 컨텐츠 규제를 충족하며, 크레딧 대상이 되는 배터리 팩으로 자본을 재분배하고 있습니다. 한편, 트럭 제조업체와 산업용 가스 공급업체간의 제휴는 그린 수소의 비용 곡선에 대한 자신감을 보여주고 있습니다. 시장 분석가들은 수소 가격이 정책 입안자들이 목표로 하는 1kg당 2달러의 패리티 수준 근처까지 하락하지 않는 한, 경차 부문에서 연료전지는 경쟁자가 아닌 보완적인 존재로 남을 것으로 예상하고 있습니다.
기타 혜택:
- Excel 형식 시장 예측(ME) 시트
- 3개월간의 애널리스트 지원
자주 묻는 질문
목차
제1장 서론
제2장 분석 방법
제3장 주요 요약
제4장 시장 구도
제5장 시장 규모·성장률 예측
제6장 경쟁 구도
제7장 시장 기회와 향후 전망
JHS 26.09.03According to Mordor Intelligence, the North America electric vehicle market size is projected to expand from USD 95.05 billion in 2025 and USD 102.66 billion in 2026 to USD 150.92 billion by 2031, registering an 8.01% CAGR between 2026 and 2031.
This report is Segmented by Vehicle Type (Passenger Cars, Light Commercial Vehicles, and More), Propulsion Type (Battery Electric Vehicles, Plug-In Hybrid Electric Vehicles, and More), Drive Type (Front-Wheel Drive, Rear-Wheel Drive, and More), Power Output (Below 100 KW, 100-250 KW, and More), and Country. The Market Forecasts are Provided in Terms of Value (USD) and Volume (Units).
North America Electric Vehicle Market Trends and Insights
Declining Battery Costs and Extended Range
Pack prices fell to USD 108/kWh in 2025 and are expected to ease further as lithium-iron-phosphate chemistries scale. Tesla and LG Energy Solution announced a Michigan LFP cell facility scheduled for 2027[2], underscoring the regional shift in chemistry production. Range anxiety is easing because most 2026 model launches clear the 300-mile mark, as seen in the Chevrolet Equinox EV at a USD 35,000 entry price. Cold-weather degradation, however, still trims roughly one-third of the rated range, particularly constraining Canadian uptake. Even so, every incremental cost reduction expands the addressable pool of buyers for whom total ownership savings eclipse sticker premiums.
Federal Tax Incentives and IRA Subsidies
The Inflation Reduction Act offers sizeable manufacturing credits, shortening payback periods for both consumers and automakers. Eligibility thresholds rise each year, forcing firms to realign their supply chains toward North American components. Treasury guidance issued in 2024 disqualified batteries with graphite from entities of concern, pushing OEMs toward Australian and Canadian contracts. Vertically integrated manufacturers with domestic cell lines meet these rules more easily, strengthening their cost position versus joint-venture-reliant peers. The commercial-vehicle credit of up to USD 40,000 per unit has spurred conversions of parcel and municipal fleets, enabling corporate buyers to fully monetize the subsidy. As the thresholds ratchet upward, compliance costs will favor suppliers with onshore refining and midstream capacity.
Inadequate Public Charging Infrastructure Density
NREL calculates a need for 28 million ports by 2030, but only 8 million existed at 2025's close. Permitting bottlenecks limit roll-outs despite a USD 5 billion federal corridor program. Rural areas in the Midwest and Appalachia fall below one charger per 100 square miles, dissuading long-distance travel. Canada's province-specific networks lack interoperability, requiring multiple payment systems for cross-border drives. Until density gaps shrink, consumer confidence and resale values will remain under pressure.
Other drivers and restraints analyzed in the detailed report include:
- Automakers' Electrification Roadmaps and Investments
- Domestic Battery Supply-Chain Localization Under USMCA Incentives
- High Upfront Purchase Price vs. ICE Alternatives
For complete list of drivers and restraints, kindly check the Table Of Contents.
Segment Analysis
Passenger cars held 77.13% of 2025 revenue but face a gentler growth curve as first-wave early adopters saturate. Light commercial vehicles, the fastest-growing slice, are slated for a 9.02% CAGR, reflecting parcel carriers and municipal fleets switching en masse to battery vans. Contract awards from the U.S. Postal Service and Amazon validate the durability of fleet demand, while municipal bus tenders extend electrification into public transit. The North American electric vehicle market size for commercial vans will therefore expand more quickly than for passenger sedans, even though the absolute base is smaller.
Fleet duty cycles amplify uptime gains: predictable routes enable depot charging and higher daily utilization, lowering cost per mile. Regulations mandating zero-emission municipal fleets intensify momentum in refuse collection and airport shuttle applications. Financing models are also evolving; leasing companies now bundle chargers and maintenance, flattening capital burdens for city agencies. As incentives taper, operators should still benefit from residual-value clarity because large-parcel fleets provide a secondary market for used vans in less-demanding roles.
Battery-electric platforms secured 70.25% of 2025 sales, anchoring the propulsion landscape of the North American electric vehicle market. Fuel-cell models will, however, chart the quickest percentage rise at 11.22% CAGR, albeit from a much smaller baseline. California's network of 60-plus hydrogen stations and Canada's pilot corridors lure heavy-duty operators wary of battery weight penalties. The North American electric vehicle market share of FCEVs will therefore inch upward in the long-haul freight and intercity coach niches, where rapid refueling unlocks asset utilization.
OEM resource allocation signals diverging bets: several legacy brands canceled plug-in hybrid updates to redeploy capital toward battery packs that meet content rules and qualify for credits. Meanwhile, partnerships between truck makers and industrial-gas suppliers demonstrate confidence in green-hydrogen cost curves. Market watchers expect fuel cells to remain complementary rather than competitive in light-duty segments unless hydrogen prices drop near the USD 2/kg parity threshold policymakers target.
Complete Report Scope:
- By Vehicle Type
- Passenger Cars
- Light Commercial Vehicles (LCVs)
- Medium and Heavy Commercial Vehicles (M&HCVs)
- Buses and Coaches
- By Propulsion Type
- Battery Electric Vehicles (BEV)
- Plug-in Hybrid Electric Vehicles (PHEV)
- Hybrid Electric Vehicles (HEV)
- Fuel-Cell Electric Vehicles (FCEV)
- By Drive Type
- Front-Wheel Drive (FWD)
- Rear-Wheel Drive (RWD)
- All-Wheel Drive (AWD)
- By Power Output
- Below 100 kW
- 100-250 kW
- Above 250 kW
- By Country
- United States
- Canada
- Mexico
List of Companies Covered in this Report:
- Tesla, Inc.
- General Motors Company
- Ford Motor Company
- Hyundai Motor Company
- Rivian Automotive, Inc.
- Stellantis N.V.
- Lucid Group, Inc.
- Nissan Motor Co., Ltd.
- Honda Motor Co., Ltd.
- BMW Group
- Mercedes-Benz Group AG
- Volvo Car AB
- BYD Auto Co., Ltd.
- Lion Electric Company
- Nikola Corporation
- Daimler Truck Holding AG
- PACCAR Inc.
Additional Benefits:
- The market estimate (ME) sheet in Excel format
- 3 months of analyst support
TABLE OF CONTENTS
1 Introduction
- 1.1 Study Assumptions & Market Definition
- 1.2 Scope of the Study
2 Research Methodology
3 Executive Summary
4 Market Landscape
- 4.1 Market Overview
- 4.2 Market Drivers
- 4.2.1 Declining Battery Costs and Extended Range
- 4.2.2 Federal Tax Incentives and IRA Subsidies
- 4.2.3 Automakers' Electrification Roadmaps and Investments
- 4.2.4 Domestic Battery Supply-Chain Localization Under USMCA Incentives
- 4.2.5 Vehicle-to-Grid (V2G) Pilots by Regional Utilities
- 4.2.6 Vertically-Integrated Battery Recycling Ecosystems
- 4.3 Market Restraints
- 4.3.1 Inadequate Public Charging Infrastructure Density
- 4.3.2 High Upfront Purchase Price vs. ICE Alternatives
- 4.3.3 BEV Resale-Value Uncertainty in Secondary Markets
- 4.3.4 Grid Interconnection Delays for DC Fast-Charging Hubs
- 4.4 Value / Supply-Chain Analysis
- 4.5 Regulatory Landscape
- 4.6 Technological Outlook
- 4.7 Porter's Five Forces
- 4.7.1 Threat of New Entrants
- 4.7.2 Bargaining Power of Suppliers
- 4.7.3 Bargaining Power of Buyers
- 4.7.4 Threat of Substitutes
- 4.7.5 Competitive Rivalry
5 Market Size & Growth Forecasts (Value (USD) and Volume (Units))
- 5.1 By Vehicle Type
- 5.1.1 Passenger Cars
- 5.1.2 Light Commercial Vehicles (LCVs)
- 5.1.3 Medium and Heavy Commercial Vehicles (M&HCVs)
- 5.1.4 Buses and Coaches
- 5.2 By Propulsion Type
- 5.2.1 Battery Electric Vehicles (BEV)
- 5.2.2 Plug-in Hybrid Electric Vehicles (PHEV)
- 5.2.3 Hybrid Electric Vehicles (HEV)
- 5.2.4 Fuel-Cell Electric Vehicles (FCEV)
- 5.3 By Drive Type
- 5.3.1 Front-Wheel Drive (FWD)
- 5.3.2 Rear-Wheel Drive (RWD)
- 5.3.3 All-Wheel Drive (AWD)
- 5.4 By Power Output
- 5.4.1 Below 100 kW
- 5.4.2 100-250 kW
- 5.4.3 Above 250 kW
- 5.5 By Country
- 5.5.1 United States
- 5.5.2 Canada
- 5.5.3 Mexico
6 Competitive Landscape
- 6.1 Market Concentration
- 6.2 Strategic Moves
- 6.3 Market Share Analysis
- 6.4 Company Profiles (Includes Global Level Overview, Market Level Overview, Core Segments, Financials as Available, Strategic Information, Market Rank/Share for Key Companies, Products and Services, SWOT Analysis, and Recent Developments)
- 6.4.1 Tesla, Inc.
- 6.4.2 General Motors Company
- 6.4.3 Ford Motor Company
- 6.4.4 Hyundai Motor Company
- 6.4.5 Rivian Automotive, Inc.
- 6.4.6 Stellantis N.V.
- 6.4.7 Lucid Group, Inc.
- 6.4.8 Nissan Motor Co., Ltd.
- 6.4.9 Honda Motor Co., Ltd.
- 6.4.10 BMW Group
- 6.4.11 Mercedes-Benz Group AG
- 6.4.12 Volvo Car AB
- 6.4.13 BYD Auto Co., Ltd.
- 6.4.14 Lion Electric Company
- 6.4.15 Nikola Corporation
- 6.4.16 Daimler Truck Holding AG
- 6.4.17 PACCAR Inc.
7 Market Opportunities & Future Outlook
- 7.1 White-space & Unmet-Need Assessment


