
|
시장보고서
상품코드
2121998
고성능 전기자동차 : 시장 점유율 분석, 업계 동향과 통계, 성장 예측(2026-2031년)Automotive High Performance Electric Vehicles - Market Share Analysis, Industry Trends & Statistics, Growth Forecasts (2026 - 2031) |
||||||
 Mordor Intelligence
Mordor Intelligence에 따르면 고성능 전기자동차 시장 규모는 2025년 2,054억 2,000만 달러에서 2026년에는 2,301억 3,000만 달러로 확대하며, 2026-2031년에 CAGR 12.03%로 추이하며, 2031년에는 4,059억 9,000만 달러에 달할 것으로 예측됩니다.
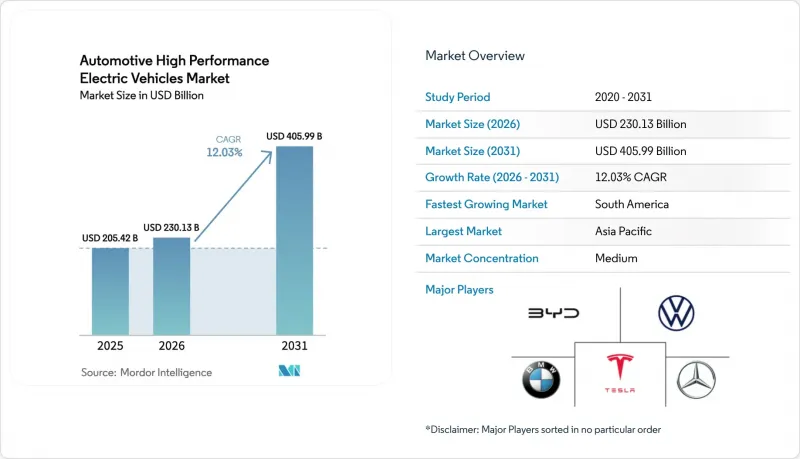
이 보고서는 구동 방식(배터리식 전기자동차 및 플러그인 하이브리드차), 차종(승용차 및 상용차), 모터 유형(영구자석 동기 모터, 유도 모터 등), 배터리 화학 조성(리튬이온(NMC/NCA) 등),파워트레인 구성(싱글 모터 후륜 구동 등), 지역별로 분류되어 있습니다. 시장 예측은 금액(달러) 기준으로 제시되어 있습니다.
세계 고성능 전기자동차 시장의 동향 및 인사이트
배터리 비용 하락 및 800V 채택
2025년에는 테슬라의 ‘4680’ 라인이 양산 단계에 진입하고, 중국 공급업체가 6C 충전 팩을 상용화함에 따라 NMC 및 NCA 셀 가격은 kWh당 90달러 미만을 유지하며, 팩 수준의 비용 구조는 두 자릿수 감소를 실현했습니다. 포르쉐 ‘타이칸’이 선구적으로 도입한 800V 아키텍처는 현재 프리미엄 부문에 널리 보급되어 있으며, DC 급속 충전 시간을 40% 단축하는 동시에 모터 중량 증가분을 상쇄하는 경량 케이블 사용을 가능하게 하고 있습니다. 인피니온 및 울프스피드(Wolfspeed)의 실리콘 카바이드 MOSFET 인버터는 3모터 및 4모터 레이아웃에서 스위칭 손실을 줄여, 열적 지연 없이 10분 만에 완전 충전이 가능하게 했습니다. 이러한 시너지 효과로 인해 자동차용 고성능 EV 시장은 초고출력을 유지하면서도 더 폭넓은 가격대에서 보급되는 방향으로 나아가고 있습니다.
정부의 우대 조치 및 배기가스 규제
미국의 ‘인플레이션 억제법(Inflation Reduction Act)’에 따라 차량 1대당 최대 7,500달러의 보조금이 지급되며, 여기에 각 주의 리베이트가 더해져 실질적인 구매 가격은 최대 1만 5,000달러까지 낮아집니다. 유럽연합(EU)의 ‘Fit-for-55’ 패키지는 2030년까지 차량 총 배출량 중 평균 CO₂ 배출량을 55% 감축하도록 법적으로 의무화하고 있으며,각 OEM 업체들은 남아 있는 내연기관(ICE)의 배출량을 상쇄하기 위해 고성능 전기자동차의 양산에 주력할 수밖에 없게 되었습니다. 중국의 듀얼 크레딧 제도 덕분에 BYD의 2024년 인도 대수는 427만 대에 달했으며, 2년 만에 전기자동차 누적 판매 대수를 2배 이상 늘렸습니다.
열 관리의 한계
현재의 리튬이온 배터리 팩은 60°C를 초과하면 용량이 급격히 저하되며, 멀티 모터 구성의 가혹한 작동 사이클에서는 몇 분 만에 셀이 이 임계값에 도달할 가능성이 있습니다. 액체 냉각 플레이트, 상변화 복합재료, 냉매식 칠러는 비용, 중량 및 유지보수의 복잡성을 증가시킵니다. 페르시아만 지역에서는 여름철 주변 온도로 인해 스포티한 주행시 실제 주행 거리가 이미 최대 20% 단축되고 있습니다. 각 OEM 업체들은 구조적 냉각 및 침지 냉각 방식을 모색하고 있지만, 단기적인 설비 투자는 여전히 자동차용 고성능 전기자동차 시장에 걸림돌이 되고 있습니다.
부문 분석
2025년 매출 중 배터리식 전기자동차(BEV)가 70.87%를 차지하여, 순수 전기 구동과 단순화된 구동계에 대한 구매자의 선호도가 두드러지게 나타났습니다. BEV는 즉각적인 토크와 보다 정밀한 출력 제어를 활용할 수 있으며, 샤오미 SU7 Ultra의 뉘르부르크링 벤치마크 랩 기록이 이를 여실히 보여줍니다. 또한 이 부문은 유지보수 수요 감소와 OTA(Over-the-Air)를 통한 성능 튜닝의 이점도 누리고 있습니다. 한편, 플러그인 하이브리드차량(PHEV)은 연평균 성장률(CAGR) 13.13%로 성장하고 있으며, 350kW 공공 충전기가 여전히 부족한 지역의 애호가들에게 지지를 받고 있습니다.
유럽에서는 차량군의 평균 CO₂ 배출량 규제가 강화되고 있으며, 규제 준수 측면에서 PHEV가 주목받고 있습니다. 또한 프리미엄 브랜드 각사는 서킷 주행용 전기 부스트 모드를 탑재하여 지속적인 랩 성능을 실현하고 있습니다. 독일과 영국의 세제는 법인용 차량으로서 PHEV를 우대하고 있으며, 경영진층의 도입을 지원하고 있습니다.
2025년 자동차용 고성능 EV 시장 규모에서 매출의 84.12%를 승용차가 차지하며, 그 원동력은 기존 슈퍼카를 가속 성능 면에서 능가하는 스포츠 세단과 고급 SUV입니다. 배터리를 차체 하부에 탑재하여 무게 중심이 낮아지고, 토크 벡터링이 핸들링을 향상시키기 때문에 메르세데스-AMG, BMW M, 아우디 스포츠는 4도어 차량으로서의 실용성을 유지하면서도 0-60mph 가속 3초 미만을 실현하고 있습니다. 소프트웨어를 통한 기능 추가에 대해 고객이 기꺼이 추가 비용을 지불하는 경향도 이익률을 더욱 끌어올리고 있습니다.
성능 지향적인 픽업 트럭과 배송용 밴을 필두로 하는 상용차 시장은 2031년까지 연평균 성장률(CAGR) 12.66%를 기록할 전망입니다. 차량 관리자들은 견인 및 적재 능력에 필요한 토크를 높이 평가하는 동시에, 연료비와 정비비 절감이라는 이점도 누리고 있습니다. 리비안의 ‘R1T’와 포드의 ‘F-150 라이트닝’은 실용성이 높은 차량임에도 불구하고 극한 조건을 위해 설계된 구동 시스템에서 프리미엄 가치를 이끌어낼 수 있음을 입증하고 있습니다. 가동 주기 데이터가 예측 유지보수에 활용됨에 따라 잔존 가치가 향상되고, 이는 기관 투자자들의 자본이 자동차용 고성능 전기자동차 시장으로 유입되는 계기가 되고 있습니다.
지역별 분석
아시아태평양은 2025년 매출 점유율의 46.32%를 차지하며 선두를 유지하고 있으며, 그 원동력은 중국입니다. 중국에서는 2025년에 전기자동차가 소형차 총 판매 대수의 60%에 달할 전망입니다. 일본은 여전히 하이브리드차량이 주를 이루고 있지만, 한국과 호주에서는 구매 리베이트 제도의 확충과 350kW 고속도로용 충전기의 도입에 힘입어 두 자릿수 성장이 예상됩니다. 통합된 공급망을 통해 배터리, 인버터, 칩 공급업체가 동일한 거점에 집적될 수 있게 되어, 리드타임 단축과 해당 지역의 자동차용 고성능 전기자동차 시장에서 구조적인 가격 우위 확보로 이어지고 있습니다.
유럽에서는 2024년에 성장세가 주춤한 후, 2025년 1분기에 BEV 판매 대수가 약 30% 증가하며 회복세로 돌아섰습니다. 이는 2030년까지 100만 곳의 공공 충전소를 구축한다는 목표를 세운 민관 공동 자금 지원에 힘입은 결과입니다. 독일과 영국은 잔존 가치 보증 및 포뮬러 E의 기술 파급 효과의 혜택을 받아 각각 견고한 성장세를 기록했습니다. 멕시코가 2030년을 목표로 계획하고 있는 소형 EV 허브는 NAFTA의 지역내 조달 규칙을 통합하고, 낮은 인건비를 활용하여 지역의 경쟁력을 강화하는 연속적인 공급 벨트를 형성할 것입니다. 이러한 현지 생산 동향은 국가 안보 관점에도 부합하며, 자동차용 고성능 전기자동차 시장을 원격지에서의 공급 차질로부터 보호하고 있습니다.
남미는 2024년 라틴아메리카의 전기자동차 등록 대수가 두 배로 증가한 데 힘입어 연평균 성장률(CAGR) 12.99%라는 가장 높은 전망치를 보였습니다. 우루과이는 지역내 1인당 보급률에서 1위를 차지하고 있습니다. 브라질은 국내 조립 프로그램을 가속화하기 위해 수입 관세를 인하했으며, 파라과이는 수력발전을 기반으로 한 배터리 등급 리튬 사업에 주력하고 있습니다. 그러나 주요 도시권 이외의 지역에서는 충전 인프라 구축이 여전히 미흡하므로 플릿는 정비 공장을 거점으로 한 운영을 우선시할 수밖에 없습니다. 재생에너지 발전이 확대되는 가운데, 자동차용 고성능 전기자동차 시장은 고급 수입차의 청정 에너지 브랜딩 측면에서 호기를 맞이하게 될 것입니다.
기타 혜택:
- 엑셀 형식의 시장 예측(ME) 시트
- 3개월간의 애널리스트 지원
목차
제1장 서론
제2장 조사 방법
제3장 개요
제4장 시장 구도
제5장 시장 규모와 성장 예측
제6장 경쟁 구도
제7장 시장 기회와 향후 전망
KSAAccording to Mordor Intelligence, the automotive high performance electric vehicles market size is expected to grow from USD 205.42 billion in 2025 to USD 230.13 billion in 2026 and is forecast to reach USD 405.99 billion by 2031 at 12.03% CAGR over 2026-2031.
This report is Segmented by Drive Type (Battery Electric and Plug-In Hybrid Electric), Vehicle Type (Passenger Cars and Commercial Vehicles), Motor Type (Permanent-Magnet Synchronous, Induction, and More), Battery Chemistry (Lithium-Ion (NMC/NCA) and More), Powertrain Architecture (Single-Motor RWD and More), and Geography. The Market Forecasts are Provided in Terms of Value (USD).
Global Automotive High Performance Electric Vehicles Market Trends and Insights
Battery Cost Decline & 800 V Adoption
NMC and NCA cell prices continued falling below USD 90 kWh in 2025 as Tesla's 4680 line hit volume production and Chinese suppliers commercialized 6C-charge packs, shrinking pack-level cost structures by double digits. Eight-hundred-volt architectures pioneered by the Porsche Taycan now permeate premium segments, slicing DC fast-charge sessions by 40% and allowing lighter cabling that offsets added motor mass. Silicon-carbide MOSFET inverters from Infineon and Wolfspeed drop switching losses for tri- and quad-motor layouts, supporting 10-minute full charges without thermal derate. The combined effect propels the automotive high performance EVs market toward broader affordability while sustaining ultra-high power outputs.
Government Incentives & Emission Norms
The U.S. Inflation Reduction Act grants up to USD 7,500 per vehicle, complemented by state rebates that trim effective transaction prices by as much as USD 15,000. The European Union's Fit-for-55 package legally binds a 55% fleet-average CO2 cut by 2030, compelling OEMs to lean into high performance EV volume to counterbalance residual ICE output. China's dual-credit regime pushed BYD deliveries to 4.27 million units in 2024, more than doubling its EV tally in two years.
Thermal-management Limits
Current lithium-ion packs lose capacity rapidly above 60 °C, and extreme duty cycles in multi-motor setups can push cells to these thresholds in minutes. Liquid-cooling plates, phase-change composites, and refrigerant-based chillers add cost, weight, and service complexity. In the Persian Gulf, summer ambient temperatures already trim real-world range by up to 20% during spirited driving. OEMs are exploring structural cooling and immersion methods, yet short-term capex remains a hurdle for the automotive high performance EVs market.
Other drivers and restraints analyzed in the detailed report include:
- Ultra-fast Charging Corridors
- SiC Inverters for Track Duty
- Rare-earth Price Risk
For complete list of drivers and restraints, kindly check the Table Of Contents.
Segment Analysis
Battery Electric Vehicles secured 70.87% of 2025 revenue, underscoring buyer preference for pure-electric thrust and simplified drivetrains. BEVs exploit instant torque and finer power modulation, exemplified by the Xiaomi SU7 Ultra's Nurburgring benchmark lap. The segment also benefits from lighter maintenance demand and OTA-driven performance tuning. Meanwhile, Plug-in Hybrid Electric Vehicles are expanding at a 13.13% CAGR, appealing to enthusiasts in regions where 350 kW public chargers remain scarce.
Europe's stricter CO2 fleet averages make PHEVs attractive for compliance, and premium marques integrate track-oriented electric boost modes that deliver sustained lap performance. Tax regimes in Germany and the U.K. favor PHEVs for company fleets, propelling adoption among executive buyers.
Passenger cars commanded 84.12% of 2025 revenue of the automotive high performance EVs market size, propelled by sports sedans and luxury SUVs that now out-accelerate legacy supercars. Battery floor mounting drops centers of gravity, and torque vectoring enhances handling, enabling Mercedes-AMG, BMW M, and Audi Sport to offer sub-3-second 0-60 mph times with four-door practicality. Customer willingness to pay for software-unlock extras further fortifies margins.
Commercial vehicles, led by performance-oriented pickups and delivery vans, record a 12.66% CAGR through 2031. Fleet managers appreciate torque for towing and payload while benefiting from lower fuel and service bills. Rivian's R1T and Ford's F-150 Lightning prove that workhorse fleets can extract premium value from propulsion systems designed for extremes. As duty-cycle data feeds predictive maintenance, residuals improve, inviting institutional capital into the automotive high performance EVs market.
Complete Report Scope:
- By Drive Type
- Battery Electric (BEV)
- Plug-in Hybrid Electric (PHEV)
- By Vehicle Type
- Passenger Cars
- Commercial Vehicles
- By Motor Type
- Permanent-Magnet Synchronous
- Induction
- Switched Reluctance
- Axial Flux
- By Battery Chemistry
- Lithium-ion (NMC/NCA)
- Lithium Iron Phosphate (LFP)
- Solid-state & Semi-solid
- By Powertrain Architecture
- Single-Motor RWD
- Dual-Motor AWD
- Tri-/Quad-Motor AWD
- Geography
- North America
- United States
- Canada
- Rest of North America
- South America
- Brazil
- Argentina
- Rest of South America
- Europe
- Germany
- United Kingdom
- France
- Italy
- Spain
- Russia
- Rest of Europe
- Asia-Pacific
- China
- Japan
- India
- South Korea
- Australia
- Rest of Asia-Pacific
- Middle East and Africa
- United Arab Emirates
- Saudi Arabia
- South Africa
- Turkey
- Rest of Middle East and Africa
- North America
Geography Analysis
Asia-Pacific dominated with 46.32% 2025 revenue share, anchored by China where electric vehicles are slated to reach 60% of total light-duty sales in 2025. Japan remains hybrid-skewed, yet South Korea and Australia witness double-digit growth under expanded purchase rebates and 350 kW highway charger deployments. Integrated supply chains allow battery, inverter, and chip suppliers to co-locate, compressing lead times and securing a structural price edge for the automotive high performance EVs market in the region.
Europe rebounded with around 30% BEV sales growth in Q1 2025 after a 2024 plateau, supported by joint public-private funding that targets one million public charge points by 2030. Germany and the U.K. posted a decent respective gains, benefiting from residual-value guarantees and Formula E technology spillovers. Mexico's planned mini-EV hub for 2030 integrates NAFTA content rules and low labor costs, creating a contiguous supply belt that reinforces regional competitiveness. Such build-local trends align with national security narratives, shielding the automotive high performance EVs market from distant supply disruptions.
South America delivered the fastest 12.99% CAGR outlook as Latin American EV registrations doubled units in 2024. Uruguay tops regional per-capita adoption; Brazil cut import tariffs to accelerate domestic assembly programs, and Paraguay eyes battery-grade lithium business anchored on hydropower. Yet charging coverage remains patchy outside capital corridors, prompting fleets to prioritize depot-based operations. As renewable generation expands, the automotive high performance EVs market should find fertile ground in clean-energy branding for premium imports.
- Tesla
- BYD Auto
- Volkswagen Group
- BMW Group
- Mercedes-Benz Group
- General Motors
- Ford Motor Company
- Stellantis NV
- Hyundai Motor Group
- Toyota Motor Corporation
- Nissan Motor Co.
- Lucid Group
- Rivian Automotive
- Rimac Automobili
Additional Benefits:
- The market estimate (ME) sheet in Excel format
- 3 months of analyst support
TABLE OF CONTENTS
1 Introduction
- 1.1 Study Assumptions & Market Definition
- 1.2 Scope of the Study
2 Research Methodology
3 Executive Summary
4 Market Landscape
- 4.1 Market Overview
- 4.2 Market Drivers
- 4.2.1 Battery cost decline & 800 V adoption
- 4.2.2 Government incentives & emission norms
- 4.2.3 Ultra-fast charging corridors
- 4.2.4 SiC inverters for track duty
- 4.2.5 EV-only racing halo
- 4.2.6 OTA performance-upgrade revenue
- 4.3 Market Restraints
- 4.3.1 Thermal-management limits
- 4.3.2 Rare-earth price risk
- 4.3.3 Insurance-premium spike
- 4.3.4 Grid bottlenecks for MW chargers
- 4.4 Value/Supply-Chain Analysis
- 4.5 Regulatory Landscape
- 4.6 Technological Outlook
- 4.7 Porter's Five Forces Analysis
- 4.7.1 Threat of New Entrants
- 4.7.2 Bargaining Power of Buyers/Consumers
- 4.7.3 Bargaining Power of Suppliers
- 4.7.4 Threat of Substitute Products
- 4.7.5 Intensity of Competitive Rivalry
- 4.8 Investment & Funding Trends
5 Market Size & Growth Forecasts (Value (USD))
- 5.1 By Drive Type
- 5.1.1 Battery Electric (BEV)
- 5.1.2 Plug-in Hybrid Electric (PHEV)
- 5.2 By Vehicle Type
- 5.2.1 Passenger Cars
- 5.2.2 Commercial Vehicles
- 5.3 By Motor Type
- 5.3.1 Permanent-Magnet Synchronous
- 5.3.2 Induction
- 5.3.3 Switched Reluctance
- 5.3.4 Axial Flux
- 5.4 By Battery Chemistry
- 5.4.1 Lithium-ion (NMC/NCA)
- 5.4.2 Lithium Iron Phosphate (LFP)
- 5.4.3 Solid-state & Semi-solid
- 5.5 By Powertrain Architecture
- 5.5.1 Single-Motor RWD
- 5.5.2 Dual-Motor AWD
- 5.5.3 Tri-/Quad-Motor AWD
- 5.6 Geography
- 5.6.1 North America
- 5.6.1.1 United States
- 5.6.1.2 Canada
- 5.6.1.3 Rest of North America
- 5.6.2 South America
- 5.6.2.1 Brazil
- 5.6.2.2 Argentina
- 5.6.2.3 Rest of South America
- 5.6.3 Europe
- 5.6.3.1 Germany
- 5.6.3.2 United Kingdom
- 5.6.3.3 France
- 5.6.3.4 Italy
- 5.6.3.5 Spain
- 5.6.3.6 Russia
- 5.6.3.7 Rest of Europe
- 5.6.4 Asia-Pacific
- 5.6.4.1 China
- 5.6.4.2 Japan
- 5.6.4.3 India
- 5.6.4.4 South Korea
- 5.6.4.5 Australia
- 5.6.4.6 Rest of Asia-Pacific
- 5.6.5 Middle East and Africa
- 5.6.5.1 United Arab Emirates
- 5.6.5.2 Saudi Arabia
- 5.6.5.3 South Africa
- 5.6.5.4 Turkey
- 5.6.5.5 Rest of Middle East and Africa
- 5.6.1 North America
6 Competitive Landscape
- 6.1 Market Concentration
- 6.2 Strategic Moves
- 6.3 Market Share Analysis
- 6.4 Company Profiles (Includes Global Level Overview, Market Level Overview, Core Segments, Financials as Available, Strategic Information, Market Rank/Share for Key Companies, Products and Services, SWOT Analysis, and Recent Developments)
- 6.4.1 Tesla
- 6.4.2 BYD Auto
- 6.4.3 Volkswagen Group
- 6.4.4 BMW Group
- 6.4.5 Mercedes-Benz Group
- 6.4.6 General Motors
- 6.4.7 Ford Motor Company
- 6.4.8 Stellantis NV
- 6.4.9 Hyundai Motor Group
- 6.4.10 Toyota Motor Corporation
- 6.4.11 Nissan Motor Co.
- 6.4.12 Lucid Group
- 6.4.13 Rivian Automotive
- 6.4.14 Rimac Automobili
7 Market Opportunities & Future Outlook
- 7.1 White-space & Unmet-Need Assessment