

|
시장보고서
상품코드
2118036
OTT용 AI 시장 : 시장 점유율 분석, 업계 동향 및 통계, 성장 예측(2026-2031년)AI In OTT - Market Share Analysis, Industry Trends & Statistics, Growth Forecasts (2026 - 2031) |
||||||
 Mordor Intelligence
Mordor Intelligence에 의하면, OTT용 AI 시장 규모는 2025년 70억 4,000만 달러로 평가되었고, 2026년 85억 5,000만 달러에서 2031년까지 206억 9,000만 달러로 확대될 것으로 예측되며, 2026-2031년 연평균 복합 성장률(CAGR)은 19.33%를 나타낼 전망입니다.
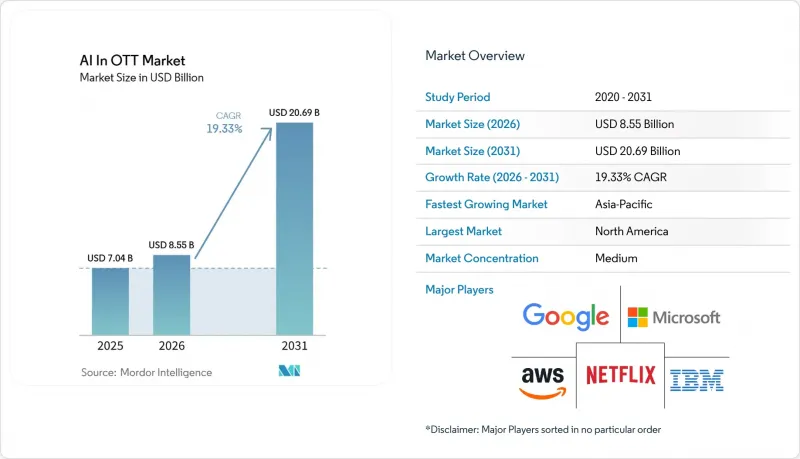
본 보고서는 기술별(머신러닝, 자연어 처리, 컴퓨터 비전, 생성형 AI), 용도별(AI 컨텐츠 개인화 시장, AI 추천 엔진 시장, 광고 타겟팅 및 수익화 최적화, 컨텐츠 검토 등), 최종 사용자별(스튜디오 및 제작사, 방송국 및 TV 네트워크 등), 지역별로 분류되어 있습니다. 시장 예측은 금액(달러)으로 표시되어 있습니다.
세계의 OTT용 AI 동향 및 인사이트
초개인화된 시청 경험에 대한 수요 증가
2026년, 지속적인 시청 시간을 놓고 경쟁을 벌이는 OTT 서비스에서 하이퍼 개인화는 기본적인 기대 사항이 되었습니다. 넷플릭스는 GenPage를 개별 추천 항목을 최적화하는 도구가 아닌, 홈페이지를 구축하기 위한 엔드투엔드 시스템으로 자리매김하고 있습니다. 이 회사는 성숙한 다단계 시스템과의 실제 운영 테스트에서 통계적으로 유의미한 참여도 향상과 엔드투엔드 전송 지연 시간을 20% 단축했다고 보고했습니다. 이러한 접근 방식을 통해 서비스는 시청자에게 홈페이지를 표시할 때 컨텐츠 유형, 행 위치, 아트워크 선택을 종합적으로 고려할 수 있게 됩니다. 시청 행동은 특정 시청자층에서 타이틀의 성과를 보다 즉각적으로 파악할 수 있게 해주므로, 그 결과 얻어지는 시청자 신호는 컨텐츠 조달 및 제작 결정의 판단 자료가 되기도 합니다. 독립된 추천 모듈만을 사용하는 서비스의 경우, 이러한 신호를 편성이나 수익화 결정에 연결하기 어려울 수 있습니다.
컨텐츠 추천 및 고객 유지 분야에서 AI 활용 확대
추천 및 고객 유지 도구는 과거 행동을 보고하는 것에서 가입자의 해지를 방지할 가능성이 있는 행동을 식별하는 방향으로 전환되고 있습니다. 넷플릭스는 2026년 실적 설명회에서 추천 기능을 컨텐츠 투자의 ‘시너지 요인’으로 규정하며, 주요 플랫폼들이 효과적인 컨텐츠 발견을 얼마나 중요하게 여기는지 보여주었습니다. 해지 예측 모델에서는 시청 완료율의 변화, 결제 문제, 가구 활동 상황 등을 종합적으로 분석함으로써 해지가 확정되기 전에 위험 요소를 파악할 수 있습니다. 이를 통해 고객 지원 팀은 관련성이 높은 컨텐츠를 제안하거나, 요금제 변경, 혹은 기타 개별 맞춤형 대응책을 마련할 시간을 확보할 수 있습니다. OTT용 AI의 가치는 해지 방지에 그치지 않습니다. 동일한 데이터를 활용하여 상품 기획 및 시청자층 계획 수립에도 활용할 수 있기 때문입니다. 다만, 이러한 조치의 질은 여전히 신뢰할 수 있는 가입자 기록과 개인 데이터 처리에 관한 명확한 규칙에 달려 있습니다.
통합된 AI 네이티브 OTT 스택 구축에 드는 높은 비용
통합된 AI 네이티브 아키텍처를 구축하려면 많은 중견 및 지역 서비스 사업자가 신속하게 실행하기에는 부담스러운 수준의 투자가 필요합니다. 이러한 사업자들은 대개 미디어 자산 관리, 트랜스코딩, 디지털 저작권 관리, 전송 시스템을 개별적으로 운영하고 있으며, 파일 전송이나 맞춤형 인터페이스를 통해 정보를 교환하고 있습니다. 이러한 시스템들이 연동되지 않은 상태에서는 추천 엔진이 시청 행동과 계약 현황, 광고 성과를 확실하게 연결하기 어려울 수 있습니다. 이러한 제약으로 인해 아무리 설계가 뛰어난 모델이라 하더라도 OTT용 AI 전반에 제공할 수 있는 가치가 제한될 수밖에 없습니다. Amagi사는 이러한 운영상의 부담 일부를 경감할 수 있는 매니지드 클라우드 서비스를 제공한 결과, 견실한 수익 성장과 조정 후 EBITDA 흑자 전환을 달성했습니다. 매니지드 서비스는 유용하지만, 전환에는 여전히 시간, 데이터 준비, 조직 전반에 걸친 변화가 필요하며, 소규모 사업자에게는 여전히 과제로 남아 있습니다.
부문 분석
2025년, 머신러닝은 OTT용 AI 시장 점유율의 33.46%를 차지했으며, 확립된 스트리밍 워크플로우 전반에서 주도적인 기술 부문이 되었습니다. 머신 러닝은 플랫폼이 이미 이해하고 있는 규모에서 개인화, 해지 위험 점수 산정, 실시간 광고 결정, 컨텐츠 품질 모니터링을 지원합니다. 이는 이러한 용도가 자유 형식의 미디어 생성이 아니라 정의된 신호의 반복적인 분석에 의존하기 때문입니다. 이러한 위상은 대규모 가입자 기반에서 예측 가능한 운영 비용과 성숙한 도입 패턴을 반영하며, 이를 통해 사업자는 컨텐츠 발견, 마케팅, 광고, 고객 서비스와 같은 각 프로세스에서 동일한 핵심 기법을 활용할 수 있게 됩니다. 이러한 시스템은 일반적으로 여러 모델을 결합하여 시청 행동, 타이틀 특성, 세션 컨텍스트를 평가하며, 시청자가 기기나 시청 시간, 선택한 컨텐츠의 유형을 변경하더라도 추천을 업데이트할 수 있습니다. 이 기술이 여전히 유용한 이유는 플랫폼이 방대한 컨텐츠 카탈로그와 트래픽 양을 관리하는 과정에서 신속하고 반복적인 의사 결정을 내릴 수 있을 뿐만 아니라, 운영 팀에 성과를 테스트하고 미흡한 결과를 시정하기 위한 확립된 지표를 제공할 수 있기 때문입니다.
생성형 AI는 2026-2031년 연평균 성장률(CAGR) 19.52%를 나타낼 것으로 예측되며, 이는 기술 부문 중 가장 높은 성장률입니다. 생성형 AI는 컨텐츠 제작, 포스트 프로덕션을 통한 품질 향상, 합성 음성을 활용한 더빙, 대화형 검색, 그리고 더욱 풍부한 홈페이지 연출 등에 활용되고 있으며, 자동화를 단일 제작 단계로 한정하지 않고 창의적인 작업과 컨텐츠 발견, 고객 경험을 연결하고 있습니다. 넷플릭스는 2026년에 300편의 작품에서 생성형 AI가 주로 포스트프로덕션에 활용되었다고 밝히며, 한 다큐멘터리 작품의 제작이 기존 프로세스에 비해 2배 빠른 속도로, 절반의 비용으로 완료되었다고 설명했습니다. 또한, 자연어 처리는 의미 검색 및 음성 주도형 발견 기능을 지원하고, 컴퓨터 비전은 컨텐츠 검토, 썸네일 생성, 동영상 이해를 지원함으로써, 플랫폼은 텍스트, 음성, 시각, 행동 신호를 통해 동일한 카탈로그를 다각적으로 해석할 수 있게 되었습니다. 넷플릭스의 ‘MediaFM’은 동영상, 음성, 텍스트를 활용하여 샷 단위의 미디어 표현을 생성하고, 신작 컨텐츠에 대한 이해를 돕습니다. 강화 학습이나 개인정보 보호 접근 방식을 포함한 기타 도구들은 아직 규모는 작지만, 서비스가 효율적이고 적절하게 관리된 개인화를 추구하는 데 중요한 역할을 하고 있습니다. 특히, 개별 모델이 이용할 수 있는 개인정보의 양을 늘리지 않으면서도 관련성을 향상시켜야 하는 상황에서 그 중요성은 더욱 커지고 있습니다.
지역별 분석
2025년, 북미는 OTT용 AI 시장의 40.76%를 차지했습니다. 이는 대규모 스트리밍 플랫폼, 확립된 프로그래매틱 광고 시스템, 그리고 미디어 기술 역량의 현저한 집중에 힘입은 결과입니다. 이 지역의 플랫폼들은 제작, 배포, 컨텐츠 발견, 시청자 유지, 광고 등 각 분야에서 AI를 활용하고 있으며, 이를 통해 성과를 평가하기 위한 다수의 데이터 포인트와 비용 절감 및 서비스 개선을 기대할 수 있는 여러 운영 영역을 확보하고 있습니다. 넷플릭스는 2026년에 300편의 작품에서 생성형 AI가 사용되었으며, 그 대부분이 포스트 프로덕션 단계에서 활용되었다고 발표했습니다. 이 지역의 규모가 크기 때문에 주요 서비스는 자사 시청 데이터와 독자적인 모델 개발을 위한 리소스에 접근할 수 있지만, 이 데이터의 유용성은 여전히 개인정보 보호 조치, 명확한 소유권, 그리고 정확한 타이틀 정보와의 연계 능력에 달려 있습니다. 또한, 플랫폼이 광고 상품과 지역에 맞춘 경험을 확대함에 따라 캐나다와 멕시코에도 기회가 생기고 있습니다.
아시아태평양은 2026-2031년 연평균 성장률(CAGR) 20.18%를 나타낼 것으로 예측되며, 이는 각 지역 중 가장 빠른 속도입니다. 모바일 우선 시청자층, 다양한 현지 언어, 그리고 활발한 현지 플랫폼의 존재로 인해 자막 생성, 시맨틱 검색, 시청자 세분화, 유연한 광고 형식에 대한 수요가 증가하고 있습니다. 이는 단일 카탈로그와 인터페이스로 서로 다른 언어 선호도, 시청 습관, 기기 제약을 가진 시청자들을 모두 수용해야 하기 때문입니다. 릴라이언스 인더스트리즈(Reliance Industries)의 보고서에 따르면, JioStar는 2026 회계연도에 월간 활성 사용자 수가 평균 4억 5,100만 명에 달했습니다. 이 회사의 ‘JioStar GenAI Media Studio’는 컨텐츠 아이디어 창출, 음성 및 동영상 제작, 그리고 최종 제작 워크플로우를 지원합니다. 아시아 비디오 산업 협회(AVIA)의 보고서에 따르면, 아시아태평양 전체의 구독형 비디오 온 디맨드(SVOD) 계약 중 84%를 현지 플랫폼이 차지하고 있어, 이 지역에서 현지 상황에 맞춘 AI 도입이 중요해지고 있습니다.
유럽, 남미, 중동 및 아프리카에서는 OTT용 AI의 성장 경로가 각각 다릅니다. 유럽에서는 자동화된 의사 결정이 시청자나 크리에이터에게 영향을 미치는 경우, 투명성, 문서화 및 인적 감독에 대한 요구 사항이 엄격하여 이로 인해 도입 작업이 증가할 가능성이 있지만, 한편으로는 제공업체가 보다 명확한 관리 체제와 설명 책임이 있는 운영 관행을 확립하는 계기가 될 수도 있습니다. 남미의 각 플랫폼 기업들은 스페인어권 시청자 및 기타 지역 커뮤니티에 서비스를 제공하기 위해 현지화 및 광고 도구를 활용하고 있습니다. 또한, Prime Video는 특정 타이틀의 접근성을 높이기 위해 기존 현지화 버전이 없는 컨텐츠를 대상으로 AI 기반 더빙 시범 프로그램을 도입했습니다. 중동에서는 광대역 및 스마트 TV 보급이 진행되고 있지만, 아프리카는 여전히 발전 초기 단계에 있으며 남아프리카공화국이나 나이지리아 등 시장이 중심을 이루고 있습니다. 이러한 지역에서는 검색, 추천, 더빙의 가치가 사용자가 서비스 내에서 자신의 시청 상황을 파악할 수 있는지 여부에 달려 있으므로, 북미 시청자 모델을 그대로 적용할 수 있다고 가정하지 않고, 현지 언어, 다양한 네트워크 환경, 지역별 컨텐츠 선호도에 대응할 수 있는 시스템이 필요합니다.
기타 혜택 :
- 엑셀 형식 시장 예측(ME) 시트
- 3개월간의 애널리스트 지원
자주 묻는 질문
목차
제1장 서론
제2장 조사 방법
제3장 주요 요약
제4장 시장 구도
제5장 시장 규모 및 성장 예측
제6장 경쟁 구도
제7장 시장 기회 및 향후 전망
AJY 26.09.03According to Mordor Intelligence, the AI in OTT market size is projected to expand from USD 7.04 billion in 2025 and USD 8.55 billion in 2026 to USD 20.69 billion by 2031, registering a CAGR of 19.33% between 2026 to 2031.
This report is Segmented by Technology (ML, NLP, Computer Vision, and Generative AI), Application (AI Content Personalization Market, AI Recommendation Engine Market, Advertising Targeting and Monetization Optimization, Content Moderation, and More), End User (Studios and Production Houses, Broadcasters and Television Networks, and More), and Geography. The Market Forecasts are Provided in Terms of Value (USD).
Global AI In OTT Market Trends and Insights
Rising Demand for Hyper-Personalized Viewing Experiences
Hyper-personalization has become a basic expectation for OTT services that compete for recurring viewing time in 2026. Netflix documented GenPage as an end-to-end system for constructing its homepage, rather than a tool that optimizes individual recommendation rows. The company reported statistically significant engagement gains and a 20% reduction in end-to-end serving latency in production tests against a mature multi-stage system. This approach lets a service consider content type, row position, and artwork choices together when it presents a viewer with a homepage. The resulting audience signals can also inform content acquisition and greenlight decisions, since viewing behavior provides a more immediate view of how titles perform with specific audiences. Services that only use a separate recommendation module may find it harder to connect those signals with programming and monetization decisions.
Increasing Use of AI for Content Recommendations and Retention
Recommendation and retention tools are shifting from reporting past behavior to identifying actions that may prevent a subscriber from leaving. Netflix described recommendations as a force multiplier for its content spending during its 2026 earnings discussion, showing the importance that a leading platform assigns to effective discovery. Churn models can combine changes in viewing completion, payment problems, and household activity to identify risk before a cancellation is completed. This gives customer teams more time to offer a relevant title, a plan change, or another tailored intervention. The value for the AI in OTT market is not limited to preventing cancellations, because the same data can guide merchandising and audience planning. The quality of these actions still depends on reliable subscriber records and clear rules for using personal data.
High Cost of Building Unified AI-Native OTT Stacks
A unified AI-native architecture requires investment that many mid-tier and regional services cannot undertake quickly. These operators often rely on separate media asset management, transcoding, digital rights management, and delivery systems that exchange information through file transfers or custom interfaces. When these systems remain disconnected, a recommendation engine may struggle to link viewing activity reliably with subscription and advertising outcomes. This constraint limits the value that even a well-designed model can deliver to the broader AI in OTT market. Amagi reported strong revenue growth and positive adjusted EBITDA after providing managed cloud services that can ease some of this operational burden. While managed services can help, migrations still require time, data preparation, and organization-wide changes, which remain challenging for smaller operators.
Other drivers and restraints analyzed in the detailed report include:
- Growing Adoption of AI for Ad Targeting and Monetization Optimization
- Expansion of AI-Driven Metadata, Search, and Discovery Workflows
- Fragmented Metadata Limiting Model Accuracy and Search Relevance
For complete list of drivers and restraints, kindly check the Table Of Contents.
Segment Analysis
Machine learning held 33.46% of the AI in OTT market share in 2025, making it the leading technology segment across established streaming workflows. It supports personalization, churn scoring, real-time advertising decisions, and content quality monitoring at a scale that platforms already understand, because these uses depend on repeated analysis of defined signals rather than open-ended media generation. Its position reflects predictable operating costs and mature deployment patterns for large subscriber bases, which allows operators to use the same core methods across discovery, marketing, advertising, and customer service processes. These systems commonly combine multiple models to assess viewing behavior, title features, and session context, and they can update recommendations as a viewer changes device, time of viewing, or type of content selected. The technology remains useful because it can make repeated decisions quickly while platforms manage sizable catalogs and traffic volumes, while also giving operating teams established measures for testing performance and correcting weak results.
Generative AI is projected to grow at a 19.52% CAGR from 2026 to 2031, the fastest rate among the technology segments. It is being used for content creation, post-production enhancement, synthetic voice dubbing, conversational search, and richer homepage presentation, which links creative work with discovery and customer-facing experience instead of limiting automation to one production stage. Netflix stated that generative AI had been used on 300 titles in 2026, mainly in post-production, and said a documentary segment was produced twice as fast and at half the cost of a conventional process. Natural language processing also supports semantic search and voice-led discovery, while computer vision supports moderation, thumbnails, and video understanding, giving platforms several ways to interpret the same catalog through written, spoken, visual, and behavioral signals. Netflix's MediaFM uses video, audio, and text to produce shot-level media representations that can help with understanding newly released material. Other tools, including reinforcement learning and privacy-preserving approaches, remain smaller but relevant as services seek efficient and governed personalization, especially where providers must improve relevance without expanding the amount of personal information available to an individual model.
Complete Report Scope:
- By Technology
- Machine Learning (ML)
- Natural Language Processing (NLP)
- Computer Vision
- Generative AI
- Other Technologies
- By Application
- AI Content Personalization Market
- AI Recommendation Engine Market
- Advertising Targeting and Monetization Optimization
- Content Moderation
- Metadata, Search, and Discovery
- Churn Prediction and Audience Analytics
- Fraud Detection and Account Security
- Other Applications
- By End User
- Streaming Platforms
- Studios and Production Houses
- Broadcasters and Television Networks
- Digital Media and Content Agencies
- Other End Users
- By Geography
- North America
- United States
- Canada
- Mexico
- South America
- Brazil
- Argentina
- Chile
- Rest of South America
- Europe
- Germany
- United Kingdom
- France
- Italy
- Spain
- Rest of Europe
- Asia-Pacific
- China
- Japan
- India
- South Korea
- Australia
- Rest of Asia-Pacific
- Middle East
- Saudi Arabia
- United Arab Emirates
- Qatar
- Rest of Middle East
- Africa
- South Africa
- Egypt
- Nigeria
- Rest of Africa
- North America
Geography Analysis
North America held 40.76% of the AI in OTT market share in 2025, supported by large streaming platforms, established programmatic advertising systems, and a substantial concentration of media technology capability. Platforms in the region are applying AI across production, distribution, discovery, audience retention, and advertising, which gives them several data points from which to assess performance and several operational areas where savings or service improvements may be captured. Netflix stated that 300 titles used generative AI in 2026, with most use in post-production. The region's scale gives major services access to first-party viewing data and resources for proprietary model development, although the usefulness of this data still depends on privacy practices, clear ownership rights, and the ability to link it to accurate title information. Canada and Mexico also provide opportunities as platforms expand advertising products and localized experiences.
Asia-Pacific is projected to grow at a 20.18% CAGR from 2026 to 2031, the fastest pace among the regions. Mobile-first audiences, diverse local languages, and active local platforms are increasing demand for subtitle generation, semantic search, audience segmentation, and flexible advertising formats, because a single catalog and interface must serve viewers with different language preferences, viewing habits, and device constraints. Reliance Industries reported that JioStar reached an average of 451 million monthly active users in FY26. Its JioStar GenAI Media Studio supports content ideation, audio, video, and final production workflows. The Asia Video Industry Association reported that local platforms held 84% of subscription video-on-demand subscriptions across Asia-Pacific, which makes locally relevant AI deployment important for the region.
Europe, South America, the Middle East, and Africa provide separate growth paths for the AI in OTT market, with high European requirements for transparency, documentation, and human oversight where automated decisions affect viewers or creators, which can increase implementation work but may also encourage providers to develop clearer controls and more accountable operating practices. South American platforms are using localization and advertising tools to serve Spanish-language audiences and other regional communities, and Prime Video introduced an AI dubbing pilot for content without existing localization to improve access for selected titles. The Middle East has growing broadband and smart television adoption, while Africa remains earlier in development and is centered on markets including South Africa and Nigeria. These regions need systems that handle local languages, varying network conditions, and local content preferences without assuming that North American audience models will transfer directly, since the value of search, recommendations, and dubbing depends on whether users can recognize their own viewing context in the service.
- Amazon Web Services, Inc.
- Google LLC
- Microsoft Corporation
- IBM Corporation
- Netflix, Inc.
- The Walt Disney Company
- Warner Bros. Discovery, Inc.
- Hulu, LLC
- Roku, Inc.
- Apple Inc.
- Adobe Inc.
- Brightcove Inc.
- Conviva, Inc.
- Kaltura Inc.
- Amagi Media Labs Pvt. Ltd.
- Gracenote, Inc.
- Veritone, Inc.
- Accedo Group AB
- Synamedia Ltd.
Additional Benefits:
- The market estimate (ME) sheet in Excel format
- 3 months of analyst support
TABLE OF CONTENTS
1 INTRODUCTION
- 1.1 Study Assumptions and Market Definition
- 1.2 Scope of the Study
2 RESEARCH METHODOLOGY
3 EXECUTIVE SUMMARY
4 MARKET LANDSCAPE
- 4.1 Market Overview
- 4.2 Market Drivers
- 4.2.1 Rising Demand for Hyper-Personalized Viewing Experiences
- 4.2.2 Increasing Use of AI for Content Recommendations and Retention
- 4.2.3 Growing Adoption of AI for Ad Targeting and Monetization Optimization
- 4.2.4 Expansion of AI-Driven Metadata, Search, and Discovery Workflows
- 4.2.5 AI-Assisted Localization, Dubbing, and Subtitle Scale-Up
- 4.2.6 Culturally Aware Recommendation Models Improving Regional Stickiness
- 4.3 Market Restraints
- 4.3.1 High Cost of Building Unified AI Native OTT Stacks
- 4.3.2 Fragmented Metadata Limiting Model Accuracy and Search Relevance
- 4.3.3 Copyright, Deepfake, and Talent-Labor Concerns Slowing Adoption
- 4.3.4 Model Drift Across Languages, Dialects, and Local Content Libraries
- 4.4 Impact of Macroeconomic Factors on the Market
- 4.5 Industry Value Chain Analysis
- 4.6 Regulatory Landscape
- 4.7 Technological Outlook
- 4.8 Porter's Five Forces Analysis
- 4.8.1 Bargaining Power of Suppliers
- 4.8.2 Bargaining Power of Buyers
- 4.8.3 Threat of New Entrants
- 4.8.4 Threat of Substitutes
- 4.8.5 Competitive Rivalry
5 MARKET SIZE AND GROWTH FORECASTS (VALUE)
- 5.1 By Technology
- 5.1.1 Machine Learning (ML)
- 5.1.2 Natural Language Processing (NLP)
- 5.1.3 Computer Vision
- 5.1.4 Generative AI
- 5.1.5 Other Technologies
- 5.2 By Application
- 5.2.1 AI Content Personalization Market
- 5.2.2 AI Recommendation Engine Market
- 5.2.3 Advertising Targeting and Monetization Optimization
- 5.2.4 Content Moderation
- 5.2.5 Metadata, Search, and Discovery
- 5.2.6 Churn Prediction and Audience Analytics
- 5.2.7 Fraud Detection and Account Security
- 5.2.8 Other Applications
- 5.3 By End User
- 5.3.1 Streaming Platforms
- 5.3.2 Studios and Production Houses
- 5.3.3 Broadcasters and Television Networks
- 5.3.4 Digital Media and Content Agencies
- 5.3.5 Other End Users
- 5.4 By Geography
- 5.4.1 North America
- 5.4.1.1 United States
- 5.4.1.2 Canada
- 5.4.1.3 Mexico
- 5.4.2 South America
- 5.4.2.1 Brazil
- 5.4.2.2 Argentina
- 5.4.2.3 Chile
- 5.4.2.4 Rest of South America
- 5.4.3 Europe
- 5.4.3.1 Germany
- 5.4.3.2 United Kingdom
- 5.4.3.3 France
- 5.4.3.4 Italy
- 5.4.3.5 Spain
- 5.4.3.6 Rest of Europe
- 5.4.4 Asia-Pacific
- 5.4.4.1 China
- 5.4.4.2 Japan
- 5.4.4.3 India
- 5.4.4.4 South Korea
- 5.4.4.5 Australia
- 5.4.4.6 Rest of Asia-Pacific
- 5.4.5 Middle East
- 5.4.5.1 Saudi Arabia
- 5.4.5.2 United Arab Emirates
- 5.4.5.3 Qatar
- 5.4.5.4 Rest of Middle East
- 5.4.6 Africa
- 5.4.6.1 South Africa
- 5.4.6.2 Egypt
- 5.4.6.3 Nigeria
- 5.4.6.4 Rest of Africa
- 5.4.1 North America
6 COMPETITIVE LANDSCAPE
- 6.1 Market Concentration
- 6.2 Strategic Moves
- 6.3 Vendor Positioning Analysis
- 6.4 Company Profiles (includes Global Level Overview, Market Level Overview, Core Segments, Financials as available, Strategic Information, Products and Services, Recent Developments)
- 6.4.1 Amazon Web Services, Inc.
- 6.4.2 Google LLC
- 6.4.3 Microsoft Corporation
- 6.4.4 IBM Corporation
- 6.4.5 Netflix, Inc.
- 6.4.6 The Walt Disney Company
- 6.4.7 Warner Bros. Discovery, Inc.
- 6.4.8 Hulu, LLC
- 6.4.9 Roku, Inc.
- 6.4.10 Apple Inc.
- 6.4.11 Adobe Inc.
- 6.4.12 Brightcove Inc.
- 6.4.13 Conviva, Inc.
- 6.4.14 Kaltura Inc.
- 6.4.15 Amagi Media Labs Pvt. Ltd.
- 6.4.16 Gracenote, Inc.
- 6.4.17 Veritone, Inc.
- 6.4.18 Accedo Group AB
- 6.4.19 Synamedia Ltd.
7 MARKET OPPORTUNITIES AND FUTURE OUTLOOK
- 7.1 White-Space and Unmet-Need Assessment


