

|
시장보고서
상품코드
2118903
OTT 분석 플랫폼 시장 : 시장 점유율 분석, 업계 동향 및 통계, 성장 예측(2026-2031년)OTT Analytics Platform - Market Share Analysis, Industry Trends & Statistics, Growth Forecasts (2026 - 2031) |
||||||
 Mordor Intelligence
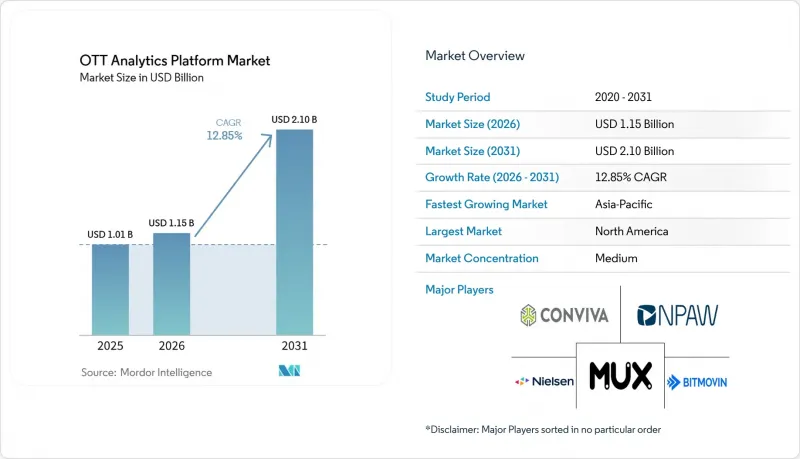
Mordor Intelligence에 의하면, OTT 분석 플랫폼 시장 규모는 2025년에 10억 1,000만 달러로 평가되었고, 2026년 11억 5,000만 달러에서 2031년까지 21억 달러에 이를 것으로 예측되며, 예측 기간(2026-2031년) CAGR은 12.85%를 나타낼 전망입니다.
본 보고서는 분석 기능별(동영상 시청 품질 및 재생 분석, 시청자·참여도·컨텐츠 분석, 광고 및 수익화 분석 등), 최종 사용자별(OTT 및 D2C(Direct-To-Consumer) 스트리밍 제공업체, 방송사 및 미디어 네트워크, 통신 사업자 및 유료 TV 사업자 등), 그리고 지역별로 분류되어 있습니다. 시장 예측은 금액(달러)으로 제시되어 있습니다.
세계의 OTT 분석 플랫폼 시장 동향 및 인사이트
CTV 및 OTT에서의 광고 측정 요구 사항 증가
광고 예산은 계속해서 시청자를 따라 커넥티드 TV 화면으로 이동하고 있으며, 스트리밍 광고 성과를 독립적이고 상세하게 측정해야 할 필요성이 높아지고 있습니다. Premion과 Advertiser Perceptions의 조사에 따르면, 커넥티드 TV 광고주의 70% 가까이가 2026년에 평균 17%의 지출 증가를 계획하고 있는 반면, 97%는 프리미엄 커넥티드 TV가 광고 투자 수익률(ROI)을 향상시켰다고 응답했습니다. 광고주들은 TV와 디지털 광고 공간 전반에 걸쳐 노출과 비즈니스 성과를 연계하고자 하기 때문에 크로스 플랫폼 측정은 구매 시 핵심 요건이 되고 있습니다. 구매자가 광고 슬롯 데이터에만 의존하지 않고, 도달 범위, 빈도, 전달 및 성과에 관한 신뢰할 수 있는 정보를 요구하게 되면 OTT 분석 플랫폼 시장은 그 혜택을 누리게 될 것입니다. 서비스 간에 광고 신호를 대조할 수 있는 플랫폼은 캠페인 계획 및 수익화 관련 의사결정을 보다 효과적으로 지원할 수 있습니다. 이러한 요구 사항은 광고 성과와 시청 품질, 그리고 시청자 행동을 연결할 수 있는 제품의 가치를 높이는 결과로 이어집니다.
AI를 활용한 시청자 세분화 및 컨텐츠 최적화
AI를 활용한 분석을 통해, 기존에는 광범위한 인구통계학적 그룹에 의존하던 스트리밍 제공업체에게 있어 상세한 시청자 세분화가 점점 더 실용적인 수단이 되고 있습니다. Bitmovin은 2025년 3월, 추천, 광고 배치, 숏폼 컨텐츠 제작을 지원하는 동영상 메타데이터를 생성하는 ‘AI Scene Analysis’를 도입했습니다. 2025년 12월에는 ThinkAnalytics사의 ‘ThinkMediaAI’ 플랫폼과의 통합이 이루어졌으며, 이를 통해 컨텐츠 수준의 분석이 스트리밍 서비스 운영 워크플로우의 일부로 자리 잡고 있음을 보여주었습니다. 더 정밀한 시청자 신호는 광고 슬롯의 관련성을 높이고, 편성 팀이 컨텐츠 제시 방식을 결정하는 데 도움이 됩니다. 이를 통해 컨텐츠, 시청자, 수익화 데이터를 단일 시스템에 통합하는 것의 상업적 타당성이 대두됩니다. 또한 전문적인 쿼리나 데이터 사이언스 기술을 보유하지 않은 팀에게도 실용적인 결과를 제공할 수 있는 벤더가 유리해집니다.
분산된 크로스 플랫폼 신원 및 도달 범위 측정
ID의 파편화는 광고주가 요구하는 완전하고 중복 제거된 시청자 프로파일을 제공하는 플랫폼의 능력을 제한하고 있습니다. 또한, 앱 계약에서 기기 제조업체가 특정 서비스에 대한 인식 기능을 비활성화하도록 요구받는 경우, 자동 컨텐츠 인식 데이터에는 공개되지 않은 누락이 포함될 가능성이 있습니다. OpenAP의 ‘Open Identity’ 프레임워크는 퍼블리셔, 바이어, 인터넷 서비스 제공업체 및 제3자 ID 데이터를 통합하기 위한 연합형(federated)이자 클린룸 방식의 접근 방식을 제공합니다. 상호 운용 가능한 신원 프레임워크를 지원하지 못하는 벤더는 크로스 플랫폼 캠페인 계획에서 유용성이 낮을 수 있습니다. ‘혁신적인 미디어 측정을 위한 연합(Coalition for Innovative Media Measurement)’은 신원 확인 문제가 첨단 TV 및 동영상 분야의 성과 기반 측정을 가로막는 장벽이 되고 있다고 지적합니다. 또한, 파편화로 인해 광고주가 커넥티드 TV나 기타 동영상 환경에서 캠페인 성과를 일관되게 비교하기 어려워질 수 있습니다.
부문 분석
2025년, 동영상 시청 경험 품질 및 재생 분석은 OTT 분석 플랫폼 시장 점유율의 23.49%를 차지했습니다. 이러한 선두 위치는 사업자들이 일반적으로 채택하는 도입 순서를 반영하며, 시청자 어트리뷰션이나 광고 최적화에 대한 투자에 앞서 신뢰할 수 있는 재생을 우선시하고 있음을 보여줍니다. 컨텐츠 발견, 광고 전달 및 구독 유지는 일관되게 작동하는 서비스에 의존하기 때문에 품질 측정은 여전히 필수적입니다. NPAW의 2025년 업계 보고서에 따르면, 스트리밍의 주요 품질 지표가 지속적으로 개선되고 있는 것으로 나타나, 기본적인 측정 기능보다 최적화 및 벤치마킹에 대한 관심이 성숙해가고 있음을 시사합니다. Witbe의 2026년 AI 네이티브 모니터링에 관한 연구에서는 실제 디바이스와 네트워크 전반에 걸쳐 MOS 기반 측정이 이루어지고 있으며, 이 분야가 단순한 임계값 경보 단계를 넘어선 단계로 진화하고 있음을 보여주었습니다. 통신 사업자는 더 높은 수준의 상실적 데이터를 바탕으로 조치를 취하기 전에 신뢰할 수 있는 운영 현황 파악이 필요하기 때문에 이러한 기능 덕분에 재생 분석은 OTT 분석 플랫폼 업계에서 여전히 중심적인 위치를 차지하고 있습니다.
광고 및 수익화 분석은 2026-2031년 연평균 성장률(CAGR) 13.55%를 나타낼 것으로 예측되며, OTT 분석 플랫폼 시장에서 가장 빠르게 성장하는 분석 기능이 될 것입니다. Amagi는 2026년 6월 ‘AIRTIME 보고서’에서 전 세계 FAST 채널의 시청 시간이 전년 대비 55% 증가했고, 광고 노출 수가 53% 증가했다고 보고했습니다. 이러한 추세에 따라 노출 검증, 수익률 관리, 그리고 경쟁사의 광고 동향에 대한 경쟁 정보에 대한 수요가 증가하고 있습니다. 시청자, 참여도, 컨텐츠, 용도 및 제품 경험에 대한 분석은 프로그램 편성 및 인터페이스 결정에 도움이 되는 인사이트력을 제공합니다. CDN, 전송 및 인프라 분석은 네트워크 에지에서의 성능 관리를 지속적으로 뒷받침하고 있습니다. 중·대규모 사업자들은 작업별로 개별 시스템을 관리하기보다는 연계된 데이터 흐름을 활용하고자 하므로, 통합 플랫폼으로의 전환이 중요합니다.
지역별 분석
2025년, 북미는 OTT 분석 플랫폼 시장 점유율의 54.27%를 차지했습니다. 이 지역은 성숙한 커넥티드 TV 광고 환경, 스트리밍 제공업체의 고밀도 집적, 그리고 측정, 어트리뷰션, 서비스 품질 관련 제품에 대한 수요라는 이점을 누리고 있습니다. 닐슨의 보고서에 따르면, 2026년 5월 스트리밍 시청 시간은 전체 TV 시청 시간의 48.6%에 달했으며, 이는 휴가 시즌을 제외한 기간 중 사상 최고 수준이었습니다. 개인정보 보호 규제가 강화되면서 데이터 처리 요건이 재편되는 한편, 캐나다와 멕시코에서는 커넥티드 TV 시청, 프로그래매틱 광고, 스페인어 스트리밍 서비스의 확대에 따라 수요가 증가하고 있습니다.
아시아태평양에서는 2026년부터 2031년에 걸쳐 OTT 분석 플랫폼 시장이 연평균 성장률(CAGR) 13.48%를 나타낼 것으로 예측됩니다. 이 지역에서는 모바일 우선 스트리밍 서비스, 대규모 라이브 이벤트, 그리고 더욱 발전된 광고 지원형 서비스가 융합되고 있습니다. NIQ는 2026년 6월, 넷플릭스, 프라임 비디오, 디즈니+, 크런치롤을 위한 크로스 플랫폼 분석을 제공하기 위해 일본에서 ‘Showlabs’를 출범했습니다. 인도는 대규모 라이브 스트리밍 워크로드에서 중요한 기준점이 되고 있는 반면, 한국, 호주, 인도네시아, 말레이시아에서는 프리미엄 동영상 서비스 및 다양한 기술 환경의 개발이 진행되고 있습니다.
유럽은 OTT(Over-The-Top) 분석 플랫폼 시장에서 세계 2위의 규모를 자랑하는 지역입니다. 방송 사업자들이 DTC(Direct-to-Consumer) 서비스를 구축하는 가운데, 영국과 독일이 광고 분석 도입을 주도하고 있습니다. Synamedia와 MoMe는 2026년 3월, 스페인 최초의 스트리밍 최적화 CDN을 출시하며, 전송 인프라 및 관련 분석 도구에 대한 지속적인 투자를 보여주고 있습니다. 남미, 중동 및 아프리카는 여전히 수요 규모가 작은 지역이지만, FAST 채널의 확대, 스포츠 중계권 관련 동향, 그리고 2026년 4월부터 6월까지 남미에서 FAST 시청 시간이 전년 동기 대비 190% 증가한 점으로 미루어 볼 때, 광고 측정 및 품질 모니터링에 대한 초기 수요가 발생하고 있습니다.
기타 혜택 :
- 엑셀 형식 시장 예측(ME) 시트
- 3개월간의 애널리스트 지원
자주 묻는 질문
목차
제1장 서론
제2장 조사 방법
제3장 개요
제4장 시장 구도
제5장 시장 규모 및 성장 예측
제6장 경쟁 구도
제7장 시장 기회 및 향후 전망
AJY 26.09.01According to Mordor Intelligence, the OTT analytics platform market size was valued at USD 1.01 billion in 2025 and estimated to grow from USD 1.15 billion in 2026 to reach USD 2.10 billion by 2031, at a CAGR of 12.85% during the forecast period (2026-2031).
This report is Segmented by Analytics Function (Video Quality of Experience and Playback Analytics, Audience, Engagement, and Content Analytics, Advertising and Monetization Analytics, and More), End User (OTT and Direct-To-Consumer Streaming Providers, Broadcasters and Media Networks, Telecom and Pay-TV Operators, and More), and Geography. The Market Forecasts are Provided in Terms of Value (USD).
Global OTT Analytics Platform Market Trends and Insights
Rising CTV and OTT Advertising Measurement Requirements
Advertising budgets continue to follow audiences onto connected television screens, increasing demand for independent and detailed measures of streaming ad performance. A Premion and Advertiser Perceptions survey found that nearly 70% of connected television advertisers planned to raise spending by an average of 17% in 2026, while 97% said premium connected television improved advertising return on investment. Cross-platform measurement has become a central purchasing requirement because advertisers want to link impressions with business outcomes across television and digital inventory. The OTT analytics platform market benefits when buyers require reliable information on reach, frequency, delivery, and outcomes, rather than relying solely on inventory data. Platforms that can reconcile advertising signals across services are better placed to support campaign planning and yield decisions. This requirement also increases the value of products that can join advertising performance with viewing quality and audience behavior.
AI-Enabled Audience Segmentation and Content Optimization
AI-based analysis is making detailed audience segmentation more practical for streaming providers that previously relied on broad demographic groups. Bitmovin introduced AI Scene Analysis in March 2025 to generate video metadata that can support recommendations, advertising placement, and short-form content creation. Its integration with ThinkAnalytics' ThinkMediaAI platform in December 2025 showed how content-level analysis is becoming part of the operational workflow for streaming services. Better audience signals can improve the relevance of advertising inventory and help programming teams decide how to present content. This creates a commercial rationale for integrating content, audience, and monetization data into a single system. It also favors vendors that deliver usable results to teams without specialized query or data-science skills.
Fragmented Cross-Platform Identity and Reach Measurement
Identity fragmentation limits a platform's ability to provide a complete, deduplicated audience view that advertisers want. Automatic content recognition data may also contain undisclosed gaps when app contracts require device makers to turn off recognition for selected services. OpenAP's Open Identity framework provides a federated, clean-room approach to joining publisher, buyer, internet service provider, and third-party identity data. Vendors that cannot work with interoperable identity frameworks may be less useful for cross-platform campaign planning. The Coalition for Innovative Media Measurement has identified identity resolution as a barrier to outcome-based measurement in advanced television and video. Fragmentation can also make it difficult for advertisers to compare campaign outcomes consistently across connected television and other video environments.
Other drivers and restraints analyzed in the detailed report include:
- Real-Time QoE Monitoring as a Churn-Reduction Tool
- Growth of Live Sports and High-Concurrency Streaming
- Privacy Regulation and Consent-Management Complexity
For complete list of drivers and restraints, kindly check the Table Of Contents.
Segment Analysis
Video quality of experience and playback analytics accounted for 23.49% of the OTT analytics platform market share in 2025. Its lead reflects the usual deployment order for operators, prioritizing reliable playback before investing in audience attribution or advertising optimization. Quality measurement remains necessary because content discovery, advertising delivery, and subscription retention depend on a service that works consistently. NPAW's 2025 industry reporting described continued improvement in core streaming quality measures, indicating a maturing focus on optimization and benchmarking rather than basic instrumentation. Witbe's 2026 work on AI-native monitoring used MOS-based measurement across real devices and networks, showing how the category has moved beyond simple threshold alerts. These capabilities keep playback analysis central to the OTT analytics platform industry, as operators need a reliable operational view before they can act on higher-level commercial data.
Advertising and monetization analytics are projected to grow at a 13.55% CAGR from 2026 to 2031, making it the fastest-growing analytics function in the OTT analytics platform market. Amagi reported that global FAST channel viewing hours rose 55% year over year and advertising impressions increased 53% in its June 2026 AIRTIME Report. That activity increases demand for impression verification, yield management, and competitive advertising intelligence. Audience, engagement, content, application, and product experience analytics provide insights that can inform programming and interface decisions. CDN, delivery, and infrastructure analytics continue to serve performance management at the network edge. The move toward unified platforms is important because mid-sized and large operators want to leverage connected data flows rather than manage separate systems for each task.
Complete Report Scope:
- By Analytics Function
- Video Quality of Experience and Playback Analytics
- Audience, Engagement, and Content Analytics
- Advertising and Monetization Analytics
- Application and Product Experience Analytics
- CDN, Delivery, and Infrastructure Analytics
- By End User
- OTT and Direct-to-Consumer Streaming Providers
- Broadcasters and Media Networks
- Telecom and Pay-TV Operators
- Sports and Live-Event Organizations
- Enterprises, Education, and Other Online Video Providers
- By Geography
- North America
- United States
- Canada
- Mexico
- South America
- Brazil
- Rest of South America
- Europe
- United Kingdom
- Germany
- France
- Russia
- Rest of Europe
- Asia-Pacific
- China
- India
- Japan
- South Korea
- Australia
- Rest of Asia-Pacific
- Middle East
- Saudi Arabia
- United Arab Emirates
- Turkey
- Rest of Middle East
- Africa
- South Africa
- Nigeria
- Egypt
- Rest of Africa
- North America
Geography Analysis
North America held 54.27% of the OTT analytics platform market share in 2025. The region benefits from a mature connected television advertising environment, a high concentration of streaming providers, and demand for measurement, attribution, and service-quality products. Nielsen reported that streaming reached 48.6% of total television viewing time in May 2026, its highest level outside the holiday season. Privacy enforcement is reshaping data processing requirements, while Canada and Mexico add demand as connected television viewing, programmatic advertising, and Spanish-language streaming services expand.
Asia-Pacific is projected to record a 13.48% CAGR in the OTT analytics platform market from 2026 to 2031. The region combines mobile-first streaming services, large live events, and more developed ad-supported offerings. NIQ launched Showlabs in Japan in June 2026 to provide cross-platform analysis for Netflix, Prime Video, Disney+, and Crunchyroll. India has become an important reference point for large live-streaming workloads, while South Korea, Australia, Indonesia, and Malaysia continue to develop premium video services and varied technology environments.
Europe is the second-largest regional area for the over-the-top (OTT) analytics platform market. The United Kingdom and Germany lead advertising analytics adoption as broadcasters build direct-to-consumer services. Synamedia and MoMe launched Spain's first streaming-optimized CDN in March 2026, indicating continued investment in delivery infrastructure and related analytics tools. South America, the Middle East, and Africa remain smaller demand areas, but FAST channel expansion, sports-rights activity, and South America's 190% year-over-year growth in FAST viewing hours during April through June 2026 are creating early needs for ad measurement and quality monitoring.
- Conviva, Inc.
- Mux, Inc.
- NPAW, S.L.
- Bitmovin, Inc.
- Nielsen Holdings plc
- Comscore, Inc.
- Parrot Analytics Limited
- Samba TV, Inc.
- iSpot.tv, Inc.
- Amplitude, Inc.
- Mixpanel, Inc.
- Google LLC
- Adobe Inc.
- Oracle Corporation
- Snowflake Inc.
- Databricks, Inc.
- Akamai Technologies, Inc.
- Synamedia Limited
- Agama Technologies AB
- Interra Systems, Inc.
- Telestream, LLC
- Witbe S.A.
- MediaMelon, Inc.
- Velocix Solutions Limited
- Datazoom, Inc.
Additional Benefits:
- The market estimate (ME) sheet in Excel format
- 3 months of analyst support
TABLE OF CONTENTS
1 INTRODUCTION
- 1.1 Study Assumptions and Market Definition
- 1.2 Scope of the Study
2 RESEARCH METHODOLOGY
3 EXECUTIVE SUMMARY
4 MARKET LANDSCAPE
- 4.1 Market Overview
- 4.2 Market Drivers
- 4.2.1 Rising CTV and OTT Advertising Measurement Requirements
- 4.2.2 Expansion of Ad-Supported and Hybrid Monetization Models
- 4.2.3 Real-Time QoE Monitoring as a Churn-Reduction Tool
- 4.2.4 AI-Enabled Audience Segmentation and Content Optimization
- 4.2.5 Shift Toward First-Party, Privacy-Safe Audience Intelligence
- 4.2.6 Growth of Live Sports and High-Concurrency Streaming
- 4.3 Market Restraints
- 4.3.1 Fragmented Cross-Platform Identity and Reach Measurement
- 4.3.2 Privacy Regulation and Consent-Management Complexity
- 4.3.3 Legacy Data and Video-Workflow Integration Gaps
- 4.3.4 Inconsistent Streaming Telemetry and Measurement Standards
- 4.4 Industry Value Chain Analysis
- 4.5 Impact of Macroeconomic Factors on the Market
- 4.6 Regulatory Landscape
- 4.7 Technological Outlook
- 4.8 Porter's Five Forces Analysis
- 4.8.1 Bargaining Power of Buyers
- 4.8.2 Bargaining Power of Suppliers
- 4.8.3 Threat of New Entrants
- 4.8.4 Threat of Substitutes
- 4.8.5 Intensity of Competitive Rivalry
5 MARKET SIZE AND GROWTH FORECASTS (VALUE)
- 5.1 By Analytics Function
- 5.1.1 Video Quality of Experience and Playback Analytics
- 5.1.2 Audience, Engagement, and Content Analytics
- 5.1.3 Advertising and Monetization Analytics
- 5.1.4 Application and Product Experience Analytics
- 5.1.5 CDN, Delivery, and Infrastructure Analytics
- 5.2 By End User
- 5.2.1 OTT and Direct-to-Consumer Streaming Providers
- 5.2.2 Broadcasters and Media Networks
- 5.2.3 Telecom and Pay-TV Operators
- 5.2.4 Sports and Live-Event Organizations
- 5.2.5 Enterprises, Education, and Other Online Video Providers
- 5.3 By Geography
- 5.3.1 North America
- 5.3.1.1 United States
- 5.3.1.2 Canada
- 5.3.1.3 Mexico
- 5.3.2 South America
- 5.3.2.1 Brazil
- 5.3.2.2 Rest of South America
- 5.3.3 Europe
- 5.3.3.1 United Kingdom
- 5.3.3.2 Germany
- 5.3.3.3 France
- 5.3.3.4 Russia
- 5.3.3.5 Rest of Europe
- 5.3.4 Asia-Pacific
- 5.3.4.1 China
- 5.3.4.2 India
- 5.3.4.3 Japan
- 5.3.4.4 South Korea
- 5.3.4.5 Australia
- 5.3.4.6 Rest of Asia-Pacific
- 5.3.5 Middle East
- 5.3.5.1 Saudi Arabia
- 5.3.5.2 United Arab Emirates
- 5.3.5.3 Turkey
- 5.3.5.4 Rest of Middle East
- 5.3.6 Africa
- 5.3.6.1 South Africa
- 5.3.6.2 Nigeria
- 5.3.6.3 Egypt
- 5.3.6.4 Rest of Africa
- 5.3.1 North America
6 COMPETITIVE LANDSCAPE
- 6.1 Market Concentration
- 6.2 Strategic Moves
- 6.3 Market Positioning Analysis
- 6.4 Company Profiles (includes Global Level Overview, Market Level Overview, Core Segments, Financials as available, Strategic Information, Market Rank/Share, Products and Services, Recent Developments)
- 6.4.1 Conviva, Inc.
- 6.4.2 Mux, Inc.
- 6.4.3 NPAW, S.L.
- 6.4.4 Bitmovin, Inc.
- 6.4.5 Nielsen Holdings plc
- 6.4.6 Comscore, Inc.
- 6.4.7 Parrot Analytics Limited
- 6.4.8 Samba TV, Inc.
- 6.4.9 iSpot.tv, Inc.
- 6.4.10 Amplitude, Inc.
- 6.4.11 Mixpanel, Inc.
- 6.4.12 Google LLC
- 6.4.13 Adobe Inc.
- 6.4.14 Oracle Corporation
- 6.4.15 Snowflake Inc.
- 6.4.16 Databricks, Inc.
- 6.4.17 Akamai Technologies, Inc.
- 6.4.18 Synamedia Limited
- 6.4.19 Agama Technologies AB
- 6.4.20 Interra Systems, Inc.
- 6.4.21 Telestream, LLC
- 6.4.22 Witbe S.A.
- 6.4.23 MediaMelon, Inc.
- 6.4.24 Velocix Solutions Limited
- 6.4.25 Datazoom, Inc.
7 MARKET OPPORTUNITIES AND FUTURE OUTLOOK
- 7.1 White-Space and Unmet-Need Assessment


