

|
시장보고서
상품코드
2118194
싱가포르의 플라스틱 폐기물 관리 서비스 시장 : 시장 점유율 분석, 업계 동향 및 통계, 성장 예측(2026-2031년)Singapore Plastic Waste Management Services - Market Share Analysis, Industry Trends & Statistics, Growth Forecasts (2026 - 2031) |
||||||
 Mordor Intelligence
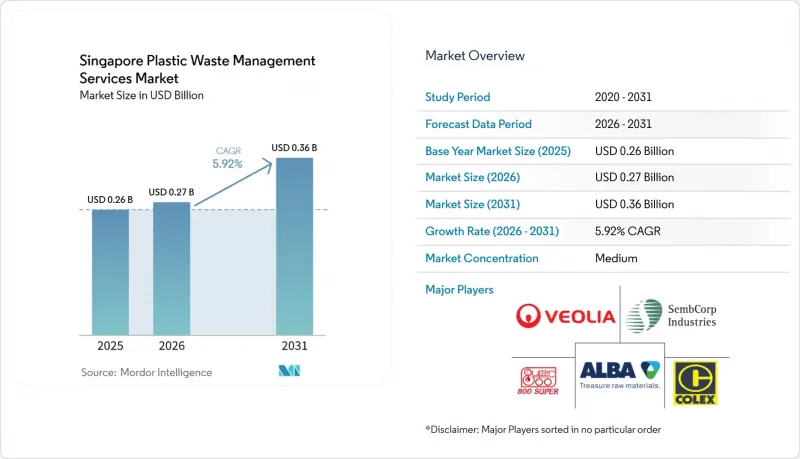
Mordor Intelligence에 의하면, 싱가포르의 플라스틱 폐기물 관리 서비스 시장 규모는 2025년 2억 6,000만 달러로 평가되었고, 2026년 2억 7,000만 달러에서 2031년까지 3억 6,000만 달러로 확대될 것으로 예측되며, 2026-2031년 연평균 복합 성장률(CAGR)은 5.92%를 나타낼 전망입니다.
본 보고서는 발생원별(주거, 상업, 산업, 기타), 서비스 제공업체별(공공/지자체, 민간 폐기물 관리 기업, 기타), 그리고 서비스 유형별(수집, 운송, 선별·분류, 처분/처리, 기타)로 분류되어 있습니다. 시장 전망은 금액(달러) 및 수량(톤) 단위로 제시되어 있습니다.
싱가포르의 플라스틱 폐기물 관리 서비스 시장 동향 및 인사이트
음료 용기 반환 제도(BCRS) 도입
싱가포르의 플라스틱 폐기물 관리 서비스 시장에서는 2019년 자원 지속가능성법에 따른 규제 프레임워크 안에서 2026년 4월 1일에 시작된 음료 용기 반환 제도(BCRS)를 통해 가장 뚜렷한 운영상의 변화가 나타납니다. 이 제도에서는 150ml에서 3,000ml까지의 플라스틱 및 금속 음료 용기에 0.1 싱가포르 달러(0.08 달러)의 보증금이 부과되며, 회수율 향상과 자재 추적성을 확보하기 위한 직접적인 재정적 메커니즘이 제공됩니다. 인가를 받은 비영리 사업자인 BCRS Ltd.는 생산자를 대신하여 회수, 선별, 재활용을 담당하고 있으며, 2026년 3월 기준으로 시장 물량의 95% 이상을 차지하는 약 800개사가 등록되었거나 등록 절차 중이었습니다. 이는 싱가포르의 플라스틱 폐기물 관리 서비스 시장에 중요한 의미를 지닙니다. 혼합 블루빈 제도와는 별도로, 더 깨끗한 PET 공급원이 창출됨으로써 원료의 품질이 향상되고, 서비스 제공업체의 전용 운송 및 수거 업무가 지원되기 때문입니다. NEA는 2026년에 60%, 2029년까지 80%의 회수율을 목표로 하고 있으며, 이 제도를 통해 공식적인 플라스틱 회수량이 급속히 증가할 뿐만 아니라, 음료 포장을 넘어선 향후 생산자 책임 규정의 설계에도 영향을 미칠 가능성이 있습니다.
순환 경제 및 재활용 혁신을 위한 정부 자금
싱가포르의 플라스틱 폐기물 관리 시장은 순환 경제의 기반 구축과 처리 기술의 혁신을 목적으로 한 직접적인 공공 자금 지원도 받고 있습니다. NEA와 NTU는 ‘Closing the Resource Loop Funding Initiative’의 일환으로 3,500만 싱가포르 달러(2,680만 달러)를 투자하여 2026년 6월 ‘TREASURES 센터’를 설립했습니다. 이 센터는 2026년 1월부터 2030년 3월까지 운영됩니다. 이 센터는 NTU, NUS 및 기타 고등교육기관을 결집시켜, 폐기물 연구를 처리 시스템에서의 실용화로 이끌기 위한 공식적인 플랫폼을 국가에 제공합니다. 이와 병행하여 NEA의 ‘3R 기금’은 요건을 충족하는 폐기물 감축 및 재활용 프로젝트에 대해 최대 80%의 공동 자금 지원을 할 수 있으며, 프로젝트 1건당 지원 상한액은 100만 싱가포르 달러(80만 달러)로 정해져 있습니다. 이를 통해 시범 사업 및 중규모 공정 개선에 대한 진입 장벽이 낮아집니다. 이러한 자금 조달 조합을 통해 싱가포르의 플라스틱 폐기물 관리 서비스 시장은 단순한 수거에 그치지 않고, 선별 공정 개선, 처리 설계, 그리고 고부가가치 자원 회수로 전환할 수 있게 됩니다. 또한, 수출 의존형 모델에서 국내 처리 능력 확충으로 단계적으로 전환하는 것을 뒷받침합니다. 이는 현재의 재활용 흐름이 여전히 해외 시장에 크게 의존하고 있다는 점에서 매우 중요한 의미를 지닙니다.
폐기물 에너지화(WTE)를 통한 소각에 대한 과도한 의존
싱가포르의 플라스틱 폐기물 관리 서비스 시장은 여전히 폐기물의 대부분에 대해 소각이 기본 처리 방법인 시스템 내에서 운영되고 있습니다. 싱가포르에서 가동 중인 4개의 폐기물 에너지화(WTE) 플랜트는 하루 총 9,710톤을 처리하고 있으며, 플라스틱은 발열량이 높기 때문에 이러한 플랜트에 있어 여전히 유용한 자원으로 남아 있습니다. 이러한 운영 논리로 인해 재활용 확대는 어려워지고 있습니다. 왜냐하면 현행 시스템 하에서는 플라스틱을 WTE에서 제외하더라도 반드시 단기적인 경제적 성과가 향상되는 것은 아니기 때문입니다. 이러한 격차는 데이터에서도 명확히 드러납니다. 2025년 플라스틱 재활용률은 4%였던 반면, 전체 재활용률은 52%였습니다. ‘통합 폐기물 관리 시설(IWMF)’의 1단계는 2027년부터 순차적으로 완공될 예정이며, 재활용 및 생산자 책임(EPR) 조치가 병행하여 확대되지 않는 한 추가적인 처리 능력이 확보될 것입니다. 따라서 당분간 싱가포르의 플라스틱 폐기물 관리 서비스 시장은 재활용의 광범위한 확대보다는 수거 및 폐기물 에너지화(WTE) 관련 서비스를 더욱 중시하는 추세가 지속될 것으로 보입니다.
부문 분석
2025년 기준, 상업 부문은 싱가포르 플라스틱 폐기물 관리 서비스 시장의 39.4%를 차지했으며, 금액 기준으로 가장 큰 발생원 범주입니다. 이 부문에는 소매점, 음식점, 호텔, 쇼핑몰,사무실 등이 포함되며, 이러한 장소에서는 포장재 사용이 집중되어 있고, 정식 계약을 통해 폐기물 발생량을 기록하기 쉽다는 특징이 있습니다. 싱가포르에는 외식 서비스와 소매업이 밀집해 있어 일회용 음료 용기, 식품 포장용 필름, 소매용 플라스틱 등이 지속적으로 발생하고 있으며, 이러한 폐기물은 전문적인 수거 프로그램에 적합합니다. 따라서 싱가포르의 플라스틱 폐기물 관리 서비스 시장에서 상업시설은 공식 계약 및 추적 가능한 수거 경로를 확립하기에 가장 적합한 공급원으로 간주됩니다.
이러한 위상은 규제 및 운영 패턴을 통해서도 뒷받침되고 있습니다. 2024년 3월 이후, 신축 건물 내 대규모 상업 및 산업계 식품 폐기물 발생원에는 식품 폐기물의 분리수거, 처리, 보고가 의무화되었으며, 이를 통해 폐기물 흐름 기록이 개선되고 혼합 상업 환경에서의 수거 가시성이 강화되었습니다. 산업 부문은 여전히 주롱 섬과 투아스에서 상당한 양을 차지하고 있으며, 특히 전문적인 선별이 필요한 산업용 필름과 PP, PE 소재가 대표적입니다. 주거 부문에서 발생하는 플라스틱 폐기물은 인구의 약 80%가 HDB 단지에 거주하고 있기 때문에 처리량이 여전히 방대합니다. 그러나 블루빈(파란색 쓰레기통)을 통한 수거에서는 혼입률이 여전히 높은 수준을 유지하고 있어, 혼합 가정 쓰레기의 가치는 낮고 회수도 어렵습니다. 싱가포르의 플라스틱 폐기물 관리 서비스 시장에서 이러한 상황으로 인해, 단기적인 서비스 수요의 가장 확실한 기반은 상업 폐기물이 됩니다.
기타 혜택 :
- 엑셀 형식 시장 예측(ME) 시트
- 3개월간의 애널리스트 지원
자주 묻는 질문
목차
제1장 서론
제2장 조사 방법
제3장 주요 요약
제4장 시장 구도
제5장 시장 규모 및 성장 예측
제6장 경쟁 구도
제7장 시장 기회 및 향후 전망
AJY 26.09.03According to Mordor Intelligence, the Singapore plastic waste management services market size is projected to expand from USD 0.26 billion in 2025 and USD 0.27 billion in 2026 to USD 0.36 billion by 2031, registering a CAGR of 5.92% between 2026 to 2031.
This report is Segmented by Source (Residential, Commercial, Industrial, and Others), by Service Provider (Public/Municipal, Private Waste Management Companies, and Others), and by Service Type (Collection, Transportation, Sorting & Segregation, Disposal / Treatment, and Others). The Market Forecasts are Provided in Terms of Value (USD) and Volume (Tons).
Singapore Plastic Waste Management Services Market Trends and Insights
Implementation of the Beverage Container Return Scheme (BCRS)
The Singapore plastic waste management services market is seeing its clearest operational shift through the Beverage Container Return Scheme, which began on 1 April 2026 under regulations issued under the Resource Sustainability Act 2019. The scheme applies a SGD 0.1 deposit (USD 0.08), on plastic and metal beverage containers ranging from 150 ml to 3,000 ml, providing the system with a direct financial mechanism to improve returns and material traceability. BCRS Ltd., the licensed not-for-profit operator, is responsible for collection, sorting, and recycling on behalf of producers, and around 800 companies representing more than 95% of market volume were registered or in the process of registration as of March 2026. This matters for the Singapore plastic waste management services market because it creates a cleaner PET stream outside the mixed blue-bin system, thereby improving feedstock quality and supporting dedicated transport and aggregation work for service providers. NEA targets a 60% return rate in 2026 and 80% by 2029, which means the scheme can quickly lift formal plastic collection volumes and also shape the design of future producer responsibility rules beyond beverage packaging.
Government Funding for Circular Economy and Recycling Innovation
The Singapore plastic waste management market is also gaining support from direct public funding aimed at building circular-economy capacity and advancing treatment innovation. NEA and NTU launched the TREASURES Centre in June 2026 with SGD 35 million (USD 26.8 million) under the Closing the Resource Loop Funding Initiative, and the centre runs from January 2026 to March 2030. The centre brings together NTU, NUS, and other higher education institutions, providing the country with a formal platform to advance waste research toward operational use in treatment systems. In parallel, NEA's 3R Fund can co-fund up to 80% of qualifying waste reduction and recycling projects, with support capped at SGD 1 million (USD 0.8 million) per project, which lowers the entry barrier for pilots and mid-scale process upgrades. This funding mix helps the Singapore plastic waste management services market move beyond collection alone and toward sorting improvement, treatment design, and higher-value resource recovery. It also supports a gradual shift away from an export-heavy model toward greater domestic processing capacity, which is important because current recycling flows still rely heavily on overseas markets.
Heavy Dependence on Waste-to-Energy Incineration
The Singapore plastic waste management services market still operates within a system in which incineration is the default treatment for a large share of waste. Singapore's four active waste-to-energy plants process a combined 9,710 tonnes per day, and plastics remain useful to those plants because of their calorific value. That operating logic makes it harder to expand recycling because diverting plastic away from WTE does not always yield a stronger short-term economic outcome under the current system. The gap is evident in the data: plastic recycling was 4% in 2025, while the overall recycling rate was 52%. The first phase of the Integrated Waste Management Facility is planned to be progressively completed from 2027, adding further treatment capacity unless recycling and EPR measures grow in parallel. This keeps the Singapore plastic waste management services market more supportive of collection and WTE-adjacent services than of broad recycling growth in the near term.
Other drivers and restraints analyzed in the detailed report include:
- Expansion of Reverse Vending Machine (RVM) Network
- Mandatory Packaging Reporting for Producers
- Limited Land Availability for Recycling Infrastructure
For complete list of drivers and restraints, kindly check the Table Of Contents.
Segment Analysis
The commercial segment held 39.4% of the Singapore plastic waste management services market in 2025, making it the largest source category by value. This segment includes retail outlets, food and beverage establishments, hotels, shopping malls, and offices, where packaging use is concentrated, and waste generation is easier to document through formal contracts. Singapore's dense food service and retail environment supports recurring volumes of single-use beverage containers, food packaging films, and retail plastics that are suitable for specialized collection programs. The Singapore plastic waste management services market, therefore, sees commercial locations as the most serviceable source base for formal contracts and traceable recovery routes.
That position is also supported by regulation and operating patterns. Since March 2024, large commercial and industrial food waste generators in new buildings have had to segregate, treat, and report food waste, which has improved waste stream documentation and strengthened collection visibility in mixed commercial settings. The industrial segment still contributes important volumes from Jurong Island and Tuas, especially industrial film and PP and PE materials that need specialized sorting. Residential plastic waste remains large in tonnage because around 80% of the population lives in HDB estates. Still, mixed household streams are lower in value and harder to recover because contamination stays high in blue-bin collection. In the Singapore plastic waste management services market, that mix leaves commercial waste as the clearest anchor for near-term service demand.
Complete Report Scope:
- By Source
- Residential
- Commercial (Retail, Office, etc.)
- Industrial
- Others (Institutional, Agricultural, etc)
- By Service Provider
- Public/Municipal
- Private Waste Management Companies
- Others - Producer Responsibility Organizations (PROs), etc.
- By Service Type
- Collection, Transportation, Sorting & Segregation
- Disposal / Treatment
- Landfill
- Recycling & Resource Recovery
- Incineration & Waste-to-Energy
- Others (Chemical Treatment, etc.)
- Others (Consulting, Audit & Training, etc.)
List of Companies Covered in this Report:
- Veolia Singapore
- SembWaste Pte Ltd
- ALBA Group Asia
- 800 Super Waste Management
- Colex Holdings Limited
- Blue Planet Environmental Solutions
- Wah & Hua Pte Ltd
- TES Envirocorp Pte. Ltd.
- LHN Recycling Pte Ltd
- Hiap Shing Recycling
- Remondis Singapore
- Envcares Waste Management
- Re Sustainability Limited
- TerraCycle
- Virogreen (Singapore) Pte. Ltd.
- SGRecycle Pte. Ltd.
- ECO Industrial Environmental Engineering
- Bee Joo Industries Pte. Ltd.
- Sembcorp Environment Pte. Ltd.
- Choon Poh Recycling Pte. Ltd.
Additional Benefits:
- The market estimate (ME) sheet in Excel format
- 3 months of analyst support
TABLE OF CONTENTS
1 Introduction
- 1.1 Study Assumptions & Market Definition
- 1.2 Scope of the Study
2 Research Methodology
3 Executive Summary
4 Market Landscape
- 4.1 Market Overview
- 4.2 Market Drivers
- 4.2.1 Implementation of the Beverage Container Return Scheme (BCRS)
- 4.2.2 Mandatory Packaging Reporting for Producers
- 4.2.3 Expansion of Reverse Vending Machine (RVM) Network
- 4.2.4 Growth of Circular Packaging Initiatives by FMCG Companies
- 4.2.5 Increasing Plastic Waste from Food Delivery and Convenience Retail
- 4.2.6 Government Funding for Circular Economy and Recycling Innovation
- 4.3 Market Restraints
- 4.3.1 Heavy Dependence on Waste-to-Energy Incineration
- 4.3.2 Limited Land Availability for Recycling Infrastructure
- 4.3.3 High Contamination in Household Plastic Waste
- 4.3.4 Dependence on Export or Specialized Processing for Certain Plastic Streams
- 4.4 Value / Supply-Chain Analysis
- 4.5 Regulatory Landscape
- 4.6 Technological Outlook
- 4.7 Impact Assessment of Geoplotical Events on the Singapore Plastic Waste Management Services Market
- 4.8 Startup Ecosystem Analysis
- 4.9 Analysis of Recycled Plastics on Virgin Plastics
- 4.10 Global Trade Flows & Import Restrictions (Waste Plastics)
5 Market Size and Growth Forecasts
- 5.1 By Source
- 5.1.1 Residential
- 5.1.2 Commercial (Retail, Office, etc.)
- 5.1.3 Industrial
- 5.1.4 Others (Institutional, Agricultural, etc)
- 5.2 By Service Provider
- 5.2.1 Public/Municipal
- 5.2.2 Private Waste Management Companies
- 5.2.3 Others - Producer Responsibility Organizations (PROs), etc.
- 5.3 By Service Type
- 5.3.1 Collection, Transportation, Sorting & Segregation
- 5.3.2 Disposal / Treatment
- 5.3.2.1 Landfill
- 5.3.2.2 Recycling & Resource Recovery
- 5.3.2.3 Incineration & Waste-to-Energy
- 5.3.2.4 Others (Chemical Treatment, etc.)
- 5.3.3 Others (Consulting, Audit & Training, etc.)
6 Competitive Landscape
- 6.1 Market Concentration
- 6.2 Strategic Moves
- 6.3 Market Share Analysis
- 6.4 Company Profiles {(includes Global level Overview, Market level overview, Core Segments, Financials as available, Strategic Information, Products & Services, and Recent Developments)}
- 6.4.1 Veolia Singapore
- 6.4.2 SembWaste Pte Ltd
- 6.4.3 ALBA Group Asia
- 6.4.4 800 Super Waste Management
- 6.4.5 Colex Holdings Limited
- 6.4.6 Blue Planet Environmental Solutions
- 6.4.7 Wah & Hua Pte Ltd
- 6.4.8 TES Envirocorp Pte. Ltd.
- 6.4.9 LHN Recycling Pte Ltd
- 6.4.10 Hiap Shing Recycling
- 6.4.11 Remondis Singapore
- 6.4.12 Envcares Waste Management
- 6.4.13 Re Sustainability Limited
- 6.4.14 TerraCycle
- 6.4.15 Virogreen (Singapore) Pte. Ltd.
- 6.4.16 SGRecycle Pte. Ltd.
- 6.4.17 ECO Industrial Environmental Engineering
- 6.4.18 Bee Joo Industries Pte. Ltd.
- 6.4.19 Sembcorp Environment Pte. Ltd.
- 6.4.20 Choon Poh Recycling Pte. Ltd.
7 Market Opportunities & Future Outlook
- 7.1 White-space & Unmet-need Assessment


