

|
시장보고서
상품코드
2119014
미국의 전자상거래 라스트 마일 배송 : 시장 점유율 분석, 산업 동향 및 통계 데이터, 성장 예측(2026-2031년)United States E-Commerce Last-Mile Delivery - Market Share Analysis, Industry Trends & Statistics, Growth Forecasts (2026 - 2031) |
||||||
 Mordor Intelligence
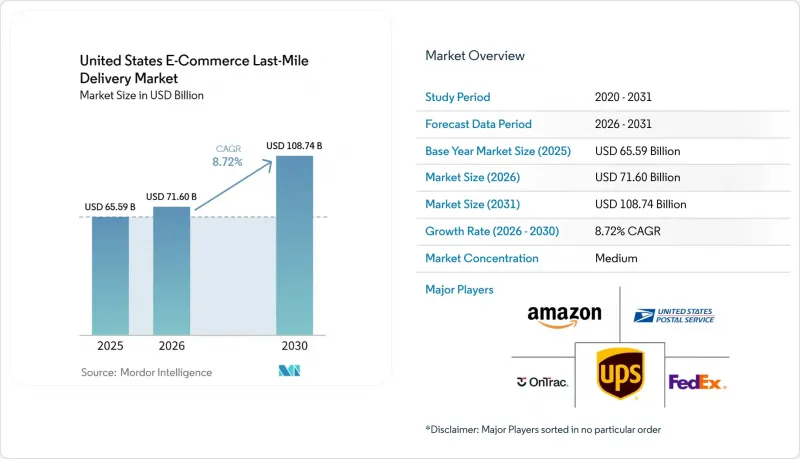
Mordor Intelligence에 의하면, 미국의 전자상거래 라스트 마일 배송 시장 규모는 2025년에 655억 9,000만 달러로 평가되었습니다. 2026년 716억 달러에서 2031년까지 1,087억 4,000만 달러에 이를 것으로 예상되며, 2026년부터 2031년까지 예측 기간 CAGR은 8.72%를 나타낼 전망입니다.
배송 속도는 현재 구매 행동을 보다 직접적으로 좌우하는 요인이 되고 있으며, 아마존이 소규모 도시 및 지방 커뮤니티로 당일·익일 배송 범위를 확대함에 따라 서비스 기준 수준은 점점 더 높아지고 있습니다. 본 보고서는 배송 유형별(표준, 당일, 익일), 배송 모델별(B2C, B2B, C2C), 도시 등급별(Tier 1, Tier 2, Tier 3 이하),제품 유형별(식품 및 음료, 퍼스널케어·가정용품, 패션·라이프스타일, 가구, 기타), 지역별(북동부, 남동부, 중서부, 남서부, 서부)로 분류되어 있습니다. 시장 전망은 금액(달러) 기준으로 제시되어 있습니다.
미국의 전자상거래 라스트 마일 배송 시장 동향 및 인사이트
도시 지역 전자상거래 회랑에서의 당일·익일 배송 수요 증가
속도는 미국의 전자상거래 라스트 마일 배송 시장에서 단순한 프리미엄 부가 서비스가 아닌 핵심 서비스 요건으로 자리 잡고 있습니다. 아마존은 2025년, 농촌 지역 배송 네트워크를 3배로 확대하기 위한 40억 달러 규모의 투자를 바탕으로, 당일 및 익일 배송 대상을 미국 내 4,000개 이상의 소규모 도시 및 농촌 지역으로 확대했습니다. 2026년 5월, 아마존은 ‘Amazon Now’를 시작하여 애틀랜타, 댈러스-포트워스, 필라델피아, 시애틀을 포함한 수십 개의 미국 도시에서 30분 내 배송을 실현했습니다. 이러한 움직임은 대형 사업자들이 재고를 수요지 근처로 이동시켜, 주문 처리 속도를 보다 지역 밀착형 운영 과제로 전환하고 있음을 보여줍니다. 또한, 여전히 느린 전국적 배송 모델에 의존하고 있는 소매업체들에게는 서비스 수준에 대한 기준을 높이는 결과로 이어지고 있습니다. 그 결과, 미국의 전자상거래 라스트 마일 배송 시장에서는 도시 지역의 밀집된 커버리지, 재고의 적절한 배치, 그리고 짧은 시간대 내에서의 일관된 실행력을 갖춘 운송업체나 플랫폼이 우위를 점하고 있습니다.
마이크로 풀필먼트와 경로 최적화를 통한 소포 밀도 향상
소포 밀도는 미국의 전자상거래 라스트 마일 배송 시장에서 가장 중요한 비용 요인 중 하나입니다. 아마존은 교통 상황과 실시간 운영 조건을 활용하여 경로 선정 능력을 개선하고, 화물이 적재되기 직전까지 배송 경로를 최적화하기 위해 20개 이상의 머신러닝 모델을 사용하고 있다고 밝혔습니다. 2026년 7월, 데카르트 시스템즈 그룹은 Drivin을 인수하여 라스트 마일용 소프트웨어 포트폴리오에 경로 최적화 및 AI 기반 배차 도구를 추가했습니다. 2025년 『Scientific Reports』지에 게재된 연구에 따르면, 교통 상황을 고려한 경로 설정과 적응형 배차로 인해 도시 지역 배송 시스템에서 미배달 건수를 줄이고, 1회 방문당 비용을 절감할 수 있는 것으로 밝혀졌습니다. 마이크로 풀필먼트는 재고를 주문처와 가까운 곳에 배치하여 1회 방문당 거리를 단축함으로써 이러한 효과를 뒷받침합니다. 이러한 기법이 보급됨에 따라, 미국의 전자상거래용 라스트 마일 배송 시장에서는 소프트웨어를 통한 인텔리전스와 지역 밀착형 재고 관리 및 경로 계획을 결합할 수 있는 사업자에게 유리한 환경이 조성되고 있습니다.
주거 지역 추가 요금과 배송 실패로 인한 라스트 마일 비용 상승
미국의 전자상거래 라스트 마일 배송 시장에서 주거 지역 배송 비용의 상승 속도는 많은 사업자가 처리량만으로 상쇄할 수 있는 범위를 초과하고 있습니다. UPS와 페덱스는 모두 2026년을 목표로 5.9%의 전반적인 요금 인상을 단행했으나, 주택가 추가 요금의 상승률은 이를 상회하여 페덱스는 5.95달러에서 6.45달러로, UPS는 6.10달러에서 6.50달러로 인상되었습니다. 따라서 일반 운임 인상률만으로는 가늠할 수 없을 정도로, 주택 배송이 주를 이루는 화물 포트폴리오는 큰 위험에 노출되어 있습니다. 이러한 압박은 배송 밀도가 낮은 반면, 고객의 ‘무료 배송’에 대한 기대가 여전히 높은 지역에서 가장 심합니다. 또한 이러한 상황은 배송 경로 재검토, 서비스 지역 계획의 엄격화, 그리고 대체 배송 거점 활용 확대를 촉진하고 있습니다. 미국의 전자상거래 라스트마일 배송 시장에서 이러한 비용 구조는 경로를 단축하고, 재배송 횟수를 줄이며, 노선 수준에서의 추가 요금 위험을 억제할 수 있는 사업자에게 유리하게 작용합니다.
부문별 분석
2025년, 미국의 전자상거래 라스트 마일 배송 시장에서 익일 배송은 41.22%의 점유율을 차지하며, 금액 기준으로 가장 큰 배송 유형이 되었습니다. 이러한 위상은 주요 온라인 소매 카테고리 전반에 걸쳐 신속한 배송이 얼마나 표준적인 기대치가 되었는지를 반영합니다. 아마존 생태계 외부의 소매업체들은 더 이상 차별화를 위해 익일 배송 체계를 구축하는 것이 아닙니다. 그들은 미국의 전자상거래 라스트마일 배송 시장에서 신뢰성을 유지하기 위해 그 체계를 구축하고 있는 것입니다. 규제상의 제약, 배송 경로의 길이, 그리고 낮은 배송 밀도로 인해 국내 많은 지역에서는 여전히 표준 서비스가 중요하게 여겨지고 있습니다.
당일 배송은 2031년까지 연평균 성장률(CAGR) 12.17%로 확대될 것으로 예측되며, 이는 가장 빠른 서비스 계층이 도시 지역의 제한적인 프리미엄 이용 사례의 범위를 넘어 확산되고 있음을 보여줍니다. 아마존이 2026년 5월에 시작한 ‘Amazon Now’는 미국 내 수십 개 도시에서 30분 배송을 제공함으로써 그 기준을 한층 더 낮췄습니다. 이러한 움직임이 중요한 이유는 서비스 계층을 ‘표준’ 대 ‘특급’이라는 이분법에서 보다 세분화된 속도 계층으로 전환시키기 때문입니다. 표준 배송은 장거리 배송이나 신속한 배송에 비해 비용 대비 가치가 낮은 가격 중심의 주문에서 여전히 중요한 역할을 수행하고 있습니다. 앞으로 미국의 전자상거래 라스트마일 배송 시장에서는 인구 밀집 도시 지역에서 당일 배송이 가장 빠르게 성장하는 한편, 익일 배송은 광범위한 상업 기반으로서 자리 잡고, 표준 배송은 교외 및 농촌 지역의 배송 노선에서 중요한 위치를 계속 차지할 것으로 전망됩니다.
2025년, B2C 배송은 미국의 전자상거래 라스트 마일 배송 시장 규모의 65.1%를 차지했으며, 이는 주거용 소매 수요가 여전히 이 부문에서 가장 큰 수요원임을 뒷받침합니다. 대형 소매업체와 택배 사업자들의 오랜 투자를 통해 B2C는 가장 확립된 운영 모델이 되었습니다. 그 규모가 크기 때문에 가정용 배송 비용, 고객 배송 시간대, 그리고 배송 업체의 생산성 변화는 시장 전체에 광범위한 영향을 미칩니다. Instacart는 2026년 1분기, ALDI와의 기업용 주문 처리 제휴를 재설계된 디지털 스토어프론트와 독점적인 주문 처리 지원을 통해 확대했습니다. 이는 플랫폼 기반 주문 처리 모델이 미국의 전자상거래 라스트 마일 배송 시장에서 수요의 경계를 점점 더 모호하게 만들고 있음을 보여줍니다.
C2C는 2031년까지 연평균 성장률(CAGR) 14.84%를 나타낼 것으로 예측되며, 현재 구조에서 가장 빠르게 확장되고 있는 배송 모델이 될 것입니다. 이러한 성장은 기존 소매 공급망 외부에서 소포 수요를 창출하는 재판매 플랫폼 및 리커머스 활동과 관련이 있습니다. C2C의 성장이 중요하게 여겨지는 이유는 더 불규칙한 발송 패턴, 변동하는 수거 지점, 그리고 분산된 발송지를 초래하기 때문입니다. 이러한 특성으로 인해 특정 노선에서는 유연한 지역 사업자나 앱 기반 배송 네트워크의 중요성이 커지고 있습니다. B2B는 전자상거래 라스트 마일 분야에서는 여전히 규모가 작지만, 산업용 자재, 상업용 보충품 및 정기적인 비즈니스 배송에서 여전히 상당한 처리량을 뒷받침하고 있습니다. 이러한 경계의 모호성이 심화됨에 따라, 미국의 전자상거래 라스트 마일 배송 업계에서는 구조화된 소매 흐름과 예측하기 어려운 개인 간(피어 투 피어) 소포 업무 모두에 대응하기 위해, 보다 유연한 수거, 역물류 및 주문 조정 능력이 요구될 것입니다.
기타 혜택 :
- 엑셀 형식 시장 예측(ME) 시트
- 3개월간의 애널리스트 지원
자주 묻는 질문
목차
제1장 서론
제2장 분석 방법
제3장 주요 요약
제4장 시장 구도
제5장 시장 규모 및 성장률 예측(금액 기준, 2026-2031년)
제6장 경쟁 구도
제7장 시장 기회 및 향후 전망
KTH 26.09.04According to Mordor Intelligence, the United States e-commerce last-mile delivery market size was valued at USD 65.59 billion in 2025 and is estimated to grow from USD 71.6 billion in 2026 to reach USD 108.74 billion by 2031, at a CAGR of 8.72% during the forecast period 2026-2031.
Delivery speed now shapes purchasing behavior more directly, and the service baseline keeps moving higher as Amazon expands same-day and next-day coverage into smaller cities and rural communities. This report is Segmented by Delivery Type (Standard, Same-Day, Next-Day), by Delivery Model (B2C, B2B, C2C), City Tier (Tier 1, Tier 2, Tier 3 & Below), by Product Type (Foods & Beverages, Personal & Household Care, Fashion & Lifestyle, Furniture, and More), and by Geography (Northeast, Southeast, Midwest, Southwest, West). The Market Forecasts are Provided in Terms of Value (USD).
United States E-Commerce Last-Mile Delivery Market Trends and Insights
Rising Demand for Same-Day and Next-Day Delivery in Urban E-Commerce Corridors
Speed has become a core service requirement in the United States e-commerce last-mile delivery market, not a premium add-on. Amazon expanded same-day and next-day delivery to more than 4,000 smaller United States cities and rural communities in 2025, supported by a USD 4 billion investment to triple its rural delivery network. In May 2026, Amazon launched Amazon Now and brought 30-minute delivery to dozens of US cities, including Atlanta, Dallas-Fort Worth, Philadelphia, and Seattle. That rollout shows how major operators are shifting inventory closer to demand and turning fulfillment speed into a more local operating problem. It also raises the service threshold for retailers that still depend on slower national routing models. The result is a United States e-commerce last-mile delivery market that rewards carriers and platforms with dense urban coverage, tight inventory positioning, and consistent execution within short windows.
Parcel Density Gains from Micro-Fulfillment and Route Optimization
Parcel density has become one of the most important cost levers in the United States e-commerce last-mile delivery market. Amazon states that it uses more than 20 machine learning models to refine delivery routes up to the point when a package is loaded, using traffic and real-time operating conditions to improve route selection. In July 2026, Descartes Systems Group acquired Drivin, adding route optimization and AI-based dispatch tools to its last-mile software portfolio. Research published in Scientific Reports in 2025 found that traffic-aware routing and adaptive dispatch can reduce missed deliveries and lower per-stop costs in urban delivery systems. Micro-fulfillment supports those gains by placing inventory closer to the order location and reducing the distance per stop. As these methods spread, the United States e-commerce last-mile delivery market becomes more favorable to operators that can combine software intelligence with localized inventory and route planning.
Last-Mile Cost Inflation from Residential Surcharges and Failed Delivery Attempts
Residential delivery costs are rising faster than many operators can offset through volume alone in the United States e-commerce last-mile delivery market. UPS and FedEx both implemented a 5.9% general rate increase for 2026, but residential surcharges increased faster, with FedEx moving from USD 5.95 to USD 6.45 and UPS moving from USD 6.10 to USD 6.50. That makes residential-heavy shipping books more exposed than the headline rate increase suggests. The pressure is strongest where delivery density is low, and customer expectations for free shipping remain high. It also encourages more route audits, stricter service-area planning, and wider use of alternative delivery points. In the United States e-commerce last-mile delivery market, this cost profile favors operators that can shorten routes, reduce reattempts, and control surcharge exposure at the lane level.
Other drivers and restraints analyzed in the detailed report include:
- Carrier Diversification Away from Single-Carrier Dependence
- Automation in Sortation, Dispatch, and Exception Management
- Driver Shortages and Peak-Season Capacity Constraints
For complete list of drivers and restraints, kindly check the Table Of Contents.
Segment Analysis
Next-day delivery held 41.22% of the United States e-commerce last-mile delivery market share in 2025, making it the largest delivery type by value. That position reflects how fast delivery has become a standard expectation across major online retail categories. Retailers outside Amazon's ecosystem are no longer building next-day capacity to stand out. They are building it to stay credible in the United States e-commerce last-mile delivery market. Compliance limits, route length, and low delivery density keep standard service relevant in many parts of the country.
Same-day delivery is projected to expand at a 12.17% CAGR through 2031, indicating that the fastest service tier is moving beyond a narrow urban premium use case. Amazon's May 2026 launch of Amazon Now pushed that benchmark even lower by offering 30-minute delivery in dozens of US cities. That move matters because it shifts the service ladder from standard versus expedited into a more granular speed hierarchy. Standard delivery still plays an important role for long-zone shipments and value-oriented orders where rapid fulfillment does not justify the cost. Over time, the United States e-commerce last-mile delivery market is likely to see same-day grow fastest in dense metros, while next-day remains the broad commercial anchor and standard delivery stays important in outer-zone and rural lanes.
B2C delivery captured 65.1% of the United States e-commerce last-mile delivery market size in 2025, confirming that residential retail demand remains the sector's largest volume engine. Years of investment by major retailers and parcel operators have made B2C the most established operating model. Its scale also means that changes in residential delivery cost, customer promise windows, and carrier productivity have a wide effect across the market. Instacart expanded its enterprise fulfillment relationship with ALDI in Q1 2026 through a redesigned digital storefront and exclusive fulfillment support, showing how platform-based fulfillment models continue to blur demand boundaries across the United States e-commerce last-mile delivery market.
C2C is forecast to grow at 14.84% CAGR through 2031, making it the fastest-moving delivery model in the current structure. That growth is linked to resale platforms and recommerce activity that create parcel demand outside traditional retail supply chains. C2C growth matters because it introduces more uneven shipment patterns, variable pickup points, and dispersed origin locations. Those traits make flexible regional operators and app-based delivery networks more relevant in selected lanes. B2B remains smaller in the e-commerce last-mile setting, but it still supports meaningful volume in industrial supplies, commercial replenishment, and scheduled business deliveries. As that blurring continues, the United States e-commerce last mile delivery industry will need more flexible pickup, reverse logistics, and order orchestration capabilities to serve both structured retail flows and less predictable peer-originated parcel activity.
Complete Report Scope:
- By Delivery Type
- Standard Delivery
- Same-Day Delivery
- Next-Day Delivery
- By Delivery Model
- Business-to-Consumer (B2C)
- Business-to-Business (B2B)
- Consumer-to-Consumer (C2C)
- By City Tier
- Tier 1
- Tier 2
- Tier 3 and Below
- By Product Type
- Foods and Beverages
- Personal and Household Care
- Fashion and Lifestyle (Accessories, Apparel, Footwear)
- Furniture
- Consumer Electronics and Household Appliances
- Other Products
- By Region
- Northeast
- Southeast
- Midwest
- Southwest
- West
List of Companies Covered in this Report:
- Amazon, Inc.
- United Parcel Service of America, Inc.
- FedEx
- United States Postal Service (USPS)
- OnTrac
- DHL Group
- Pitney Bowes, Inc.
- Veho Tech, Inc.
- Target Corporation
- DoorDash, Inc.
- Instacart, Inc.
- Uber Technologies, Inc.
- Walmart, Inc.
- Better Trucks
- Jitsu
- UniUni
- SpeedX
- Sway
- International Distribution Service plc
- Dropoff, Inc.
- RXO, Inc.
- GoFor
Additional Benefits:
- The market estimate (ME) sheet in Excel format
- 3 months of analyst support
TABLE OF CONTENTS
1 Introduction
- 1.1 Study Assumptions and Market Definition
- 1.2 Scope of the Study
2 Research Methodology
3 Executive Summary
4 Market Landscape
- 4.1 Market Overview and Role of Last-Mile Delivery in E-Commerce Logistics
- 4.2 E-Commerce Spending Trends
- 4.3 Market Drivers
- 4.3.1 Rising Demand for Same-Day and Next-Day Delivery in Urban E-Commerce Corridors
- 4.3.2 Parcel Density Gains from Micro-Fulfillment and Route Optimization
- 4.3.3 Carrier Diversification Away From Single-Carrier Dependence
- 4.3.4 Growth of Alternative Delivery Points, Lockers, and Pickup Networks
- 4.3.5 Automation in Sortation, Dispatch, and Exception Management
- 4.3.6 Sustainable Fleet Transition in High-Stop-Density Urban Routes
- 4.4 Market Restraints
- 4.4.1 Last-Mile Cost Inflation from Residential Surcharges and Failed Delivery Attempts
- 4.4.2 Driver Shortages and Peak-Season Capacity Constraints
- 4.4.3 Fragmented Address Quality and Hard-to-Serve Suburban Sprawl
- 4.4.4 Regulatory and Labor Compliance Complexity Across States and Cities
- 4.5 Regulatory Framework
- 4.6 Value Chain and Distribution Channel Architecture Analysis
- 4.7 Technology Innovations Outlook
- 4.8 Porter's Five Forces Analysis
- 4.8.1 Threat of New Entrants
- 4.8.2 Bargaining Power of Suppliers
- 4.8.3 Bargaining Power of Buyers
- 4.8.4 Threat of Substitutes
- 4.8.5 Rivalry Among Competitors
- 4.9 Evolution of E-Commerce Last-Mile Delivery Requirements
- 4.10 Pricing and Cost Structure Analysis
- 4.11 Consumer Behavior and Delivery Preferences Analysis
- 4.12 Sustainable Delivery Solutions and Green Logistics Initiatives
- 4.13 Impact of Geo-Political Events on Supply Chain Shifts
5 Market Size and Growth Forecasts (Value, 2026-2031)
- 5.1 By Delivery Type
- 5.1.1 Standard Delivery
- 5.1.2 Same-Day Delivery
- 5.1.3 Next-Day Delivery
- 5.2 By Delivery Model
- 5.2.1 Business-to-Consumer (B2C)
- 5.2.2 Business-to-Business (B2B)
- 5.2.3 Consumer-to-Consumer (C2C)
- 5.3 By City Tier
- 5.3.1 Tier 1
- 5.3.2 Tier 2
- 5.3.3 Tier 3 and Below
- 5.4 By Product Type
- 5.4.1 Foods and Beverages
- 5.4.2 Personal and Household Care
- 5.4.3 Fashion and Lifestyle (Accessories, Apparel, Footwear)
- 5.4.4 Furniture
- 5.4.5 Consumer Electronics and Household Appliances
- 5.4.6 Other Products
- 5.5 By Region
- 5.5.1 Northeast
- 5.5.2 Southeast
- 5.5.3 Midwest
- 5.5.4 Southwest
- 5.5.5 West
6 Competitive Landscape
- 6.1 Market Concentration
- 6.2 Key Strategic Moves
- 6.3 Market Share Analysis
- 6.4 Company Profiles (includes Global Level Overview, Market Level Overview, Core Segments, Financials as Available, Strategic Information, Market Rank/Share for Key Companies, Products & Services, and Recent Developments)
- 6.4.1 Amazon, Inc.
- 6.4.2 United Parcel Service of America, Inc.
- 6.4.3 FedEx
- 6.4.4 United States Postal Service (USPS)
- 6.4.5 OnTrac
- 6.4.6 DHL Group
- 6.4.7 Pitney Bowes, Inc.
- 6.4.8 Veho Tech, Inc.
- 6.4.9 Target Corporation
- 6.4.10 DoorDash, Inc.
- 6.4.11 Instacart, Inc.
- 6.4.12 Uber Technologies, Inc.
- 6.4.13 Walmart, Inc.
- 6.4.14 Better Trucks
- 6.4.15 Jitsu
- 6.4.16 UniUni
- 6.4.17 SpeedX
- 6.4.18 Sway
- 6.4.19 International Distribution Service plc
- 6.4.20 Dropoff, Inc.
- 6.4.21 RXO, Inc.
- 6.4.22 GoFor
7 Market Opportunities and Future Outlook
- 7.1 White-space and Unmet-Need Assessment


