

|
시장보고서
상품코드
2119217
폐기물 유래 연료(RDF) 시장 : 시장 점유율 분석, 업계 동향 및 통계, 성장 예측(2026-2031년)Refuse-Derived Fuel (RDF) - Market Share Analysis, Industry Trends & Statistics, Growth Forecasts (2026 - 2031) |
||||||
 Mordor Intelligence
Mordor Intelligence에 의하면, 폐기물 유래 연료 시장 규모는 2025년 73억 4,000만 달러로 평가되었고, 2026년에는 77억 2,000만 달러로 추정되고, 2026-2031년 CAGR 5.56%로 성장을 지속할 전망이며, 2031년에는 101억 2,000만 달러에 이를 것으로 예측됩니다.
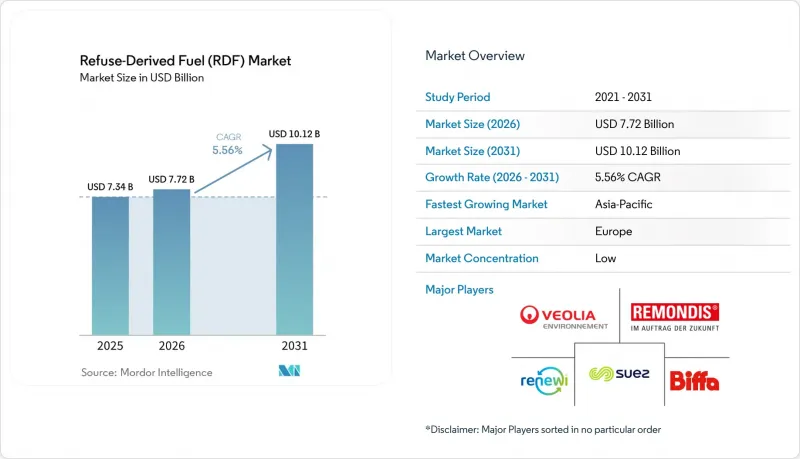
본 보고서는 원료별(일반 폐기물(MSW), 상업 및 산업(C&I) 폐기물, 건설·해체(C&D) 폐기물, 농업 폐기물, 기타 폐기물 스트림), 연료 유형별(고체 RDF, 액체 RDF, 기체 RDF), 최종 사용자별(시멘트 제조, 발전, 열병합 발전(CHP), 산업용 보일러, 폐기물 발전소, 석회 산업, 철강·금속 가공, 제지 및 펄프, 기타), 지역별(북미, 유럽, 아시아태평양, 남미, 중동 및 아프리카)로 분류되어 있습니다. 시장 전망은 금액(달러) 기준으로 제시되어 있습니다.
세계의 폐기물 유래 연료(RDF) 시장 동향 및 인사이트
매립 폐기물 감축 및 순환 경제 관련 의무화
매립 폐기물 감축 요건은 재활용이 불가능한 자재를 자원 회수로 전환함으로써 폐기물 유래 연료 시장을 지속적으로 뒷받침하고 있습니다. EU의 목표에 따르면 2035년까지 매립 처분율을 10%로 제한해야 하며, 이미 9개 회원국이 이 수준에 도달했습니다. 루마니아와 크로아티아는 2021년에 각각 73%와 71%의 매립 처리율을 보고했으며, 처리 능력이 확대됨에 따라 처리 시스템으로 유입될 수 있는 막대한 양의 자재가 남아 있습니다. 유럽연합 집행위원회는 2026년 순환 경제 정책 의제의 일환으로 ‘순환 경제법’을 제정했습니다. 향후 가연성 도시 쓰레기와 사업장 폐기물의 매립 처리가 제한되면, 여전히 매립 처리가 일반적인 지역에서 이용 가능한 원료가 확대될 것입니다. 다만, 새로운 폐기물을 연료로 활용하기 위해서는 지역 차원의 분리 수거, 전처리, 안정적인 계약 체결이 필요합니다. 폐기물 유래 연료 시장은 매립을 피한 물질을 적절한 연료 흐름으로 전환하기 위해 이러한 지역 차원의 처리 능력에 의존하고 있습니다.
시멘트 및 산업 분야의 화석 연료 대체
시멘트 제조는 가마의 열원을 직접 전기화로 대체하기 어렵기 때문에 폐기물 유래 연료 시장에 가장 안정적인 수요 기반을 제공합니다. 유럽의 시멘트 공장에서는 가마 연료의 53%를 폐기물 유래 대체 연료로 대체했으나, 세계 평균은 6%에 그치고 있습니다. JSW Cement는 2024-25 회계연도에 15만 7,000톤의 RDF를 공동 처리하여 두 시설 전체에서 16.5%의 열 대체율을 달성했습니다. 이 회사는 12만 톤의 CO₂ 배출 감축을 보고했으며, 이를 통해 연료 대체와 탈탄소화 성과가 연계되었습니다. 2025년 조사에 따르면, RDF를 통한 20%의 열 대체로 시멘트 생산의 지구 온난화 계수를 3.3%에서 4.2%까지 줄일 수 있는 것으로 나타났으며, 매립 처리에 따른 메탄 배출 방지 분량을 포함하면 그 효과는 더욱 높아지는 것으로 밝혀졌습니다. Indocement가 2026년에 파셀 주와 체결한 협정은 아시아의 시멘트 제조업체들이 단기 조달에만 의존하지 않고, 정식 현지 공급 계약으로 전환하고 있음을 보여줍니다.
원료의 품질과 수분 함량 변동
시멘트 가마에서는 예측 가능한 연소 특성이 요구되기 때문에 원료의 품질에 편차가 있는 것이 폐기물 유래 연료(RDF) 시장의 보급 확대에 걸림돌이 되고 있습니다. 처리되지 않은 혼합 폐기물에는 35%를 초과하는 수분이 포함될 수 있으며, 이로 인해 순발열량이 목표치인 18MJ/kg에서 11MJ/kg 미만으로 떨어질 가능성이 있습니다. 유럽의 산업 배출 규제에서는 염소와 수분에 대한 제한이 부과되어 있어, 품질이 낮은 RDF의 반입 거절로 이어질 수 있습니다. 아시아 개발도상국의 폐기물은 유기물 함량이 높아 수분율이 40%를 초과하여 건조 처리 부담이 커질 가능성이 있습니다. 인도의 공동 처리 지침에는 품질 기준이 정해져 있지만, 소규모 시설에서는 이를 충족하기 어려울 수 있습니다. 고도 건조 처리 및 실시간 모니터링을 도입하면 처리 비용이 톤당 8-15달러 증가합니다.
부문 분석
2025년, 일반 폐기물은 폐기물 유래 연료 시장 가치의 58.4%를 차지했습니다. 이는 지자체의 자원화 요건과 확립된 기계적·생물학적 처리 시설에 힘입은 결과입니다. 그 공급 규모는 수년에 걸친 수거 및 처리 시스템에 대한 투자를 반영하고 있습니다. 그러나 유기물의 혼입이나 계절적 수분 함량으로 인해 발열량이나 염소 함량을 제어하는 데 제약이 따를 수 있습니다. 이러한 제약으로 인해 고품질 고형 회수 연료의 규격을 충족할 수 있는 도시 폐기물의 비율은 제한적입니다. 상업 및 산업 폐기물은 2031년까지 연평균 성장률(CAGR) 6.3%를 나타낼 것으로 예측되며, 이는 원료 중 가장 높은 성장률입니다.
이 폐기물은 수분이 적고 성분이 안정적일 뿐만 아니라, 확대 생산자 책임(EPR) 체계에 따른 발생원별 분리 수거가 이루어지고 있어, 폐기물 유래 연료 시장의 가공 연료 요건을 보다 엄격하게 충족시킬 수 있습니다. SoliD-Q 프로젝트는 재활용 제품의 품질을 정확하게 관리하기 위한 디지털 재활용 데이터를 개발할 목적으로 2026년에 시작되었습니다. 건설·철거 폐기물은 인프라가 잘 갖춰진 시장에서 여전히 규모가 작은 시장 기회로 남아 있지만, 석고나 처리된 목재가 가마 사용을 제한할 가능성이 있습니다. 남아시아와 남미에서는 농업 폐기물을 혼합하여 공동 펠릿화하는 방법이 시험되고 있습니다. 펠릿의 생산 비용은 1톤당 35-50달러이지만, 석탄과 비교했을 때 연료비 절감 효과는 1톤당 최대 70달러에 달하며, 품질 기준을 충족함으로써 장기적인 인수 계약을 체결할 수 있습니다.
지역별 분석
2025년, 유럽은 46.7%의 점유율을 차지했습니다. 이는 매립 금지 규제, 에너지 회수 시설, 폐기물 유래 연료 시장의 탄소 가격 책정에 힘입은 결과입니다. 독일, 네덜란드, 이탈리아, 영국, 프랑스는 계속해서 주요 생산 및 소비 거점으로 자리 잡고 있습니다. 폴란드, 루마니아, 크로아티아는 기계적·생물학적 처리 시설에 대한 투자를 통해 처리 능력을 확대되고 있습니다. 스웨덴의 영국 및 노르웨이로부터의 수입은 폐기물 발전 도입 용량이 국경을 넘는 연료 거래를 어떻게 뒷받침하고 있는지를 보여줍니다. EU의 매립 지침과 폐기물 기본 지침이 계속해서 지역 수요를 형성하는 한편, 2026년에는 순환 경제법이 새로운 정책 방향을 제시하게 될 것입니다.
아시아태평양은 2031년까지 연평균 성장률(CAGR) 6.1%를 나타낼 것으로 예측되며, 폐기물 유래 연료 시장에서 가장 빠르게 성장하는 지역이 될 전망입니다. 도시 쓰레기 증가, 매립지 공간 부족, 시멘트 제조업체의 석탄 사용 감축 노력이 이러한 전망을 뒷받침하고 있습니다. 인도의 일일 도시 쓰레기 발생량은 15만 톤을 초과하지만, 그중 RDF 연료로 전환되는 비율은 25% 미만에 그치고 있습니다. 중국의 산업 성장에 따라 안정적인 대체 연료에 대한 수요가 높아지는 한편, 일본의 폐기물 분리 수거 인프라는 고형 재생 연료의 이용 확대를 뒷받침하고 있습니다. 인도네시아에서는 2026년에 체결된 Indocement와 파셀 현 간의 합의가 정부 지원을 통한 소성로 공동 처리의 한 사례로 꼽히고 있습니다.
북미의 경우, 미국의 많은 주와 캐나다의 주에서 매립 처리가 여전히 비교적 저렴한 가격으로 이루어지고 있기 때문에 그 동향은 완만합니다. 미국 환경보호청(EPA)은 2026년 3월, 57개 시설의 150기 이상의 대형 도시 쓰레기 소각로를 대상으로 하는 개정된 기준을 최종 확정했습니다. 남미는 여전히 초기 단계에 있으며, 브라질, 칠레, 아르헨티나에서의 RDF 이용률은 잔여 폐기물량의 5% 미만에 그치고 있습니다. 물류 측면과 시멘트 공처리 능력의 제한이 해당 지역의 발전을 저해하고 있습니다. 중동 및 아프리카의 활동은 사우디아라비아, 아랍에미리트, 이집트, 모로코에서 가장 두드러지지만, 사하라 이남 아프리카에서는 수분 함량이 높은 폐기물이 대규모 RDF 프로젝트의 지연 요인이 될 가능성이 있습니다. 이러한 상황으로 인해 폐기물 유래 연료 시장 전체에서 프로젝트의 경제성은 지역에 따라 편차를 보이고 있습니다.
기타 혜택
- 엑셀 형식 시장 예측(ME) 시트
- 3개월간의 애널리스트 지원
자주 묻는 질문
목차
제1장 서론
제2장 조사 방법
제3장 주요 요약
제4장 시장 구도
제5장 시장 규모 및 성장 예측
제6장 경쟁 구도
제7장 시장 기회 및 향후 전망
AJY 26.09.03According to Mordor Intelligence, the refuse-Derived fuel market size is expected to grow from USD 7.34 billion in 2025 to USD 7.72 billion in 2026 and is forecast to reach USD 10.12 billion by 2031 at 5.56% CAGR over 2026-2031.
This report is Segmented by Feedstock Source (MSW, C&I, C&D, Agricultural, Other Waste), Fuel Type (Solid, Liquid, Gaseous RDF), End User (Cement, Power Generation, CHP, Industrial Boilers, Waste-To-Energy, Lime, Steel, Paper & Pulp, Other), and Geography (North America, Europe, Asia-Pacific, South America, and Middle East and Africa). The Market Forecasts are Provided in Terms of Value (USD).
Global Refuse-Derived Fuel (RDF) Market Trends and Insights
Landfill Diversion and Circular-Economy Mandates
Landfill diversion requirements continue to support the refuse-derived fuel market by redirecting non-recyclable material toward recovery. The EU target limits landfill disposal to 10% by 2035, and 9 Member States have reached that level. Romania and Croatia reported landfill rates of 73% and 71%, respectively, in 2021, leaving substantial material that could enter processing systems as capacity develops. The European Commission identified a Circular Economy Act as part of its circular economy policy agenda in 2026. A future restriction on landfilling combustible municipal and commercial waste would expand available feedstock where disposal remains common and require local sorting, pre-treatment, and stable contracts before new volumes can become usable fuel. The refuse-derived fuel market depends on this local capacity to turn diverted material into an acceptable fuel stream.
Cement and Industrial Fossil-Fuel Substitution
Cement manufacturing provides the most stable demand base for the refuse-derived fuel market because kiln heat is difficult to replace through direct electrification. European cement plants substituted 53% of kiln fuel with waste-derived alternatives, compared with a global average of 6%. JSW Cement co-processed 157,000 tonnes of RDF in FY2024-25 and achieved a 16.5% thermal substitution rate across 2 facilities. The company reported avoided emissions of 120,000 tonnes of CO2, which connects fuel substitution with decarbonization reporting. A 2025 review found that 20% RDF thermal substitution could reduce the global warming potential of cement production by 3.3% to 4.2%, with a higher result when avoided landfill methane was included. Indocement's 2026 agreement with Paser Regency shows that Asian cement producers are shifting toward formal local supply arrangements instead of relying only on spot procurement.
Feedstock Quality and Moisture Variability
Feedstock inconsistency limits wider adoption in the refuse-derived fuel market because cement kilns require predictable combustion characteristics. Unprocessed mixed waste can contain more than 35% moisture, which can reduce net calorific value from a target of 18 MJ/kg to below 11 MJ/kg. European industrial emissions rules impose chlorine and moisture limits that can lead to rejection of poor-quality RDF loads. High organic content in developing Asian waste streams can raise moisture above 40% and increase the drying requirement. India's co-processing guidelines set quality thresholds that small facilities may struggle to meet. Advanced drying and real-time monitoring add USD 8 to USD 15 per tonne to processing costs.
Other drivers and restraints analyzed in the detailed report include:
- Rising Residual Waste Volumes and Waste-to-Energy Demand
- Carbon Pricing and Embedded-Carbon Accounting
- High Logistics Cost and Limited Economical Haul Distance
For complete list of drivers and restraints, kindly check the Table Of Contents.
Segment Analysis
Municipal solid waste accounted for 58.4% of the refuse-derived fuel market value in 2025, supported by municipal diversion requirements and established mechanical-biological treatment assets. Its supply scale reflects years of investment in collection and processing systems. However, organic contamination and seasonal moisture can restrict calorific output and chlorine control. These constraints limit the share of municipal material that can meet premium solid recovered fuel specifications. Commercial and industrial waste is forecast to grow at a 6.3% CAGR through 2031, the highest rate among feedstock sources.
Its lower moisture and more consistent composition, together with source separation under extended producer responsibility frameworks, can support a closer match with engineered fuel requirements in the refuse-derived fuel market. The SoliD-Q project began in 2026 to develop digital recycling data for precise recyclate quality. Construction and demolition waste remains a smaller opportunity in infrastructure-intensive markets, though gypsum and treated timber can restrict kiln use. Agricultural waste is being tested in South Asia and South America through co-pelletized blends. Pellet production costs range from USD 35 to USD 50 per tonne, while the cited fuel savings versus coal can reach USD 70 per tonne and quality standards can support longer-term offtake agreements.
Complete Report Scope:
- By Feedstock Source
- Municipal Solid Waste (MSW)
- Commercial & Industrial (C&I) Waste
- Construction & Demolition (C&D) Waste
- Agricultural Waste
- Other Waste Streams
- By Fuel Type
- Solid RDF
- Liquid RDF
- Gaseous RDF
- By End User
- Cement Manufacturing
- Power Generation
- Combined Heat & Power (CHP)
- Industrial Boilers
- Waste-to-Energy Plants
- Lime Industry
- Steel & Metal Processing
- Paper & Pulp
- Other Industrial Applications
- By Geography
- North America
- United States
- Canada
- Mexico
- Europe
- Germany
- France
- Italy
- Spain
- United Kingdom
- Poland
- Russia
- Rest of Europe
- Asia-Pacific
- China
- India
- Japan
- South Korea
- Australia
- Indonesia
- Vietnam
- Thailand
- Rest of Asia-Pacific
- South America
- Brazil
- Argentina
- Chile
- Rest of South America
- Middle East and Africa
- Saudi Arabia
- United Arab Emirates
- Egypt
- South Africa
- Morocco
- Rest of Middle East and Africa
- North America
Geography Analysis
Europe held 46.7% in 2025, supported by landfill diversion rules, energy recovery assets, and carbon pricing in the refuse-derived fuel market. Germany, the Netherlands, Italy, the United Kingdom, and France remained central production and consumption centers. Poland, Romania, and Croatia are adding capacity through mechanical-biological treatment investment. Sweden's imports from the United Kingdom and Norway show how installed energy-from-waste capacity can sustain cross-border fuel trade. The EU Landfill Directive and Waste Framework Directive continue to shape regional demand, while the Circular Economy Act adds policy direction in 2026.
Asia-Pacific is expected to grow at a 6.1% CAGR through 2031, making it the fastest-growing regional component of the refuse-derived fuel market. Urban waste growth, limited landfill space, and cement producers' efforts to reduce coal use support this outlook. India's daily municipal waste volume exceeds 150,000 tonnes, with less than 25% converted to RDF fuel. China's industrial growth increases demand for consistent alternative fuels, while Japan's waste-separation infrastructure supports higher use of solid recovered fuel. Indonesia's 2026 Indocement and Paser Regency agreement provides an example of government-supported kiln co-processing.
North America has a moderate position because landfill disposal remains relatively affordable across many U.S. states and Canadian provinces. The U.S. Environmental Protection Agency finalized updated large municipal waste combustor standards in March 2026, covering more than 150 units at 57 facilities. South America remains at an early stage, with RDF use below 5% of residual waste volumes in Brazil, Chile, and Argentina. Logistics and limited cement co-processing capacity constrain development there. Middle East and African activity is most visible in Saudi Arabia, the United Arab Emirates, Egypt, and Morocco, while high-moisture waste can delay larger RDF projects in Sub-Saharan Africa. These conditions keep project economics uneven across the refuse-derived fuel market.
- A2A S.p.A.
- Andusia Recovered Fuels Limited
- Averda International Limited
- Biffa Limited
- Blue Phoenix Group B.V.
- Enva Group Limited
- FCC Servicios Medio Ambiente Holding, S.A.U.
- Geminor AS
- Indaver NV
- PAPREC Group
- PreZero International GmbH
- Ragn-Sells AB
- REMONDIS SE & Co. KG
- Renewi plc
- SARIA SE & Co. KG
- SUEZ S.A.
- Veolia Environnement S.A.
- Waste Management, Inc.
Additional Benefits:
- The market estimate (ME) sheet in Excel format
- 3 months of analyst support
TABLE OF CONTENTS
1 INTRODUCTION
- 1.1 Study Assumptions and Market Definition
- 1.2 Scope of the Study
2 RESEARCH METHODOLOGY
3 EXECUTIVE SUMMARY
4 MARKET LANDSCAPE
- 4.1 Market Overview
- 4.2 Market Drivers
- 4.2.1 Landfill Diversion and Circular-Economy Mandates
- 4.2.2 Cement and Industrial Fossil-Fuel Substitution
- 4.2.3 Rising Residual Waste Volumes and Waste-to-Energy Demand
- 4.2.4 Carbon Pricing and Embedded-Carbon Accounting
- 4.2.5 Digital Sorting and Fuel-Quality Traceability
- 4.2.6 Local Energy Security Through Distributed Heat and Power
- 4.3 Market Restraints
- 4.3.1 Feedstock Quality and Moisture Variability
- 4.3.2 High Logistics Cost and Limited Economical Haul Distance
- 4.3.3 Permitting, Community Acceptance and Emissions Retrofit Risk
- 4.3.4 Competition for High-Calorific Residual Waste
- 4.4 Supply-Chain Analysis
- 4.5 Porter's Five Forces Analysis
- 4.5.1 Bargaining Power of Suppliers
- 4.5.2 Bargaining Power of Buyers
- 4.5.3 Threat of New Entrants
- 4.5.4 Threat of Substitutes
- 4.5.5 Competitive Rivalry
- 4.6 Technology Outlook
- 4.7 Regulatory Landscape
- 4.8 Investment Analysis
5 MARKET SIZE AND GROWTH FORECASTS
- 5.1 By Feedstock Source
- 5.1.1 Municipal Solid Waste (MSW)
- 5.1.2 Commercial & Industrial (C&I) Waste
- 5.1.3 Construction & Demolition (C&D) Waste
- 5.1.4 Agricultural Waste
- 5.1.5 Other Waste Streams
- 5.2 By Fuel Type
- 5.2.1 Solid RDF
- 5.2.2 Liquid RDF
- 5.2.3 Gaseous RDF
- 5.3 By End User
- 5.3.1 Cement Manufacturing
- 5.3.2 Power Generation
- 5.3.3 Combined Heat & Power (CHP)
- 5.3.4 Industrial Boilers
- 5.3.5 Waste-to-Energy Plants
- 5.3.6 Lime Industry
- 5.3.7 Steel & Metal Processing
- 5.3.8 Paper & Pulp
- 5.3.9 Other Industrial Applications
- 5.4 By Geography
- 5.4.1 North America
- 5.4.1.1 United States
- 5.4.1.2 Canada
- 5.4.1.3 Mexico
- 5.4.2 Europe
- 5.4.2.1 Germany
- 5.4.2.2 France
- 5.4.2.3 Italy
- 5.4.2.4 Spain
- 5.4.2.5 United Kingdom
- 5.4.2.6 Poland
- 5.4.2.7 Russia
- 5.4.2.8 Rest of Europe
- 5.4.3 Asia-Pacific
- 5.4.3.1 China
- 5.4.3.2 India
- 5.4.3.3 Japan
- 5.4.3.4 South Korea
- 5.4.3.5 Australia
- 5.4.3.6 Indonesia
- 5.4.3.7 Vietnam
- 5.4.3.8 Thailand
- 5.4.3.9 Rest of Asia-Pacific
- 5.4.4 South America
- 5.4.4.1 Brazil
- 5.4.4.2 Argentina
- 5.4.4.3 Chile
- 5.4.4.4 Rest of South America
- 5.4.5 Middle East and Africa
- 5.4.5.1 Saudi Arabia
- 5.4.5.2 United Arab Emirates
- 5.4.5.3 Egypt
- 5.4.5.4 South Africa
- 5.4.5.5 Morocco
- 5.4.5.6 Rest of Middle East and Africa
- 5.4.1 North America
6 COMPETITIVE LANDSCAPE
- 6.1 Market Concentration
- 6.2 Strategic Moves
- 6.3 Market Share Analysis
- 6.4 Company Profiles (includes Global Level Overview, Market Level Overview, Core Segments, Financials as available, Strategic Information, Market Rank/Share, Products and Services, Recent Developments)
- 6.4.1 A2A S.p.A.
- 6.4.2 Andusia Recovered Fuels Limited
- 6.4.3 Averda International Limited
- 6.4.4 Biffa Limited
- 6.4.5 Blue Phoenix Group B.V.
- 6.4.6 Enva Group Limited
- 6.4.7 FCC Servicios Medio Ambiente Holding, S.A.U.
- 6.4.8 Geminor AS
- 6.4.9 Indaver NV
- 6.4.10 PAPREC Group
- 6.4.11 PreZero International GmbH
- 6.4.12 Ragn-Sells AB
- 6.4.13 REMONDIS SE & Co. KG
- 6.4.14 Renewi plc
- 6.4.15 SARIA SE & Co. KG
- 6.4.16 SUEZ S.A.
- 6.4.17 Veolia Environnement S.A.
- 6.4.18 Waste Management, Inc.
7 MARKET OPPORTUNITIES AND FUTURE OUTLOOK
- 7.1 White-Space and Unmet-Need Assessment


