

|
시장보고서
상품코드
2119219
고형 재생 연료(SRF) 시장 : 시장 점유율 분석, 업계 동향 및 통계, 성장 예측(2026-2031년)Solid Recovered Fuel (SRF) - Market Share Analysis, Industry Trends & Statistics, Growth Forecasts (2026 - 2031) |
||||||
 Mordor Intelligence
Mordor Intelligence에 의하면, 고형 재생 연료(SRF) 시장 규모는 2025년 66억 4,000만 달러로 평가되었고, 2026년에는 69억 7,000만 달러로 추정되고, 2026-2031년 CAGR 5.26%로 성장을 지속할 전망이며, 2031년에는 90억 1,000만 달러에 이를 것으로 예측됩니다.
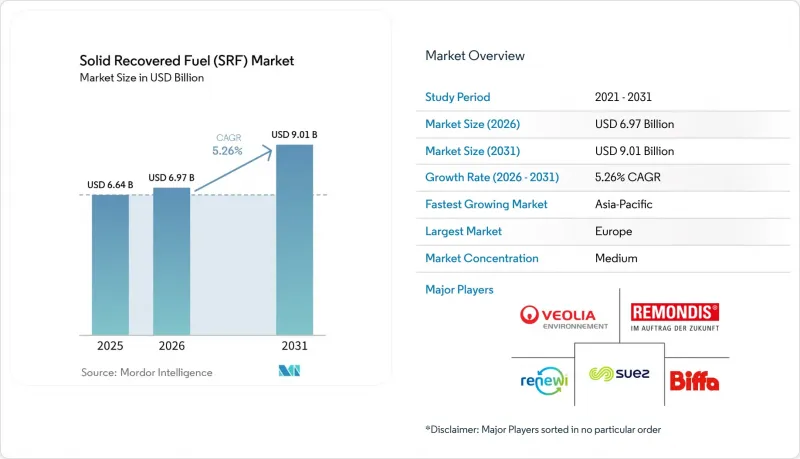
본 보고서는 원료별(일반 폐기물, 상업 및 산업 폐기물, 건설·철거 폐기물, 기타 폐기물 유동), 최종 사용자별(시멘트 산업, 열병합 발전(CHP) 플랜트,발전소, 석회 산업, 철강·금속 가공, 펄프·제지 산업, 기타 산업 사용자), 지역별(북미, 유럽, 아시아태평양, 남미, 중동 및 아프리카)로 분류되어 있습니다. 시장 예측은 금액(달러) 기준으로 제시되어 있습니다.
세계의 고형 재생 연료(SRF) 시장 동향 및 인사이트
매립 폐기물 감축 및 에너지 회수에 관한 규제
매립 감축 목표에 따라 잔여 폐기물은 회수 경로로 전환되고 있으며, 이는 고형 재생 연료 시장의 원료 공급을 뒷받침하고 있습니다. EU의 틀 내에서 회원국들은 2035년까지 매립 처리되는 도시 폐기물을 10% 이하로 제한해야 합니다. EU 출판국이 2024년에 실시한 조사에 따르면, 일부 회원국에서는 SRF의 잠재적 생산량이 SRF 흡수 관련 추정 최대 용량을 초과할 가능성이 있는 것으로 밝혀졌습니다. 이에 따라 폐기물 공급량 자체보다 처리 능력이나 안정적인 산업용 인수처가 더욱 중요시되고 있습니다. 규제 기한이 강화되기 전에 SRF 처리 플랜트를 개발하는 사업자는 지역 수거 구역 내 잔여 물질에 대한 접근성을 확보할 수 있습니다. 프랑스의 해당 산업은 연간 약 100만 톤을 생산하고 있으며, 2030년까지 250만-300만 톤이라는 목표를 세웠으나, AFOCO는 2025년에 ADEME의 프로젝트 기금이 중단됨에 따라 10억 유로의 투자 격차를 확인했습니다.
시멘트 제조에서 화석 연료의 대체
시멘트 가마는 높은 운전 온도 덕분에 적격한 폐기물 유래 연료를 처리할 수 있어, 고형 재생 연료 시장에 있어 여전히 신뢰할 수 있는 수요원입니다. 오스트리아 시멘트 산업은 2025년에 대체 연료 사용률 88.8%를 달성하여 2024년의 87.7%에서 상승한 반면, 기존 연료 투입량은 전년 대비 6.4% 감소했습니다. 2025년 발표된 동료 심사 연구에 따르면, 시멘트 가마에서 SRF를 대체 연료로 활용함으로써 시멘트 1톤당 200kg의 CO₂ 환산량에 해당하는 공정 온실가스 배출량을 감축할 수 있는 것으로 밝혀졌으며, 환경적 이점이 최대화되는 최적의 대체율은 80%로 확인되었습니다. 일반 폐기물(MSW) 유래 SRF에 포함된 생물 유래 탄소 성분 덕분에, EU 배출권 거래 제도(EU ETS)의 대상이 되는 시멘트 사업자의 화석 탄소 부채를 줄일 수 있습니다. 따라서 생산자 입장에서는 저품질의 폐기물 유래 연료보다 인증된 연료를 공급하는 것이 더 강력한 이유가 됩니다. 프랑스 시멘트 산업은 열 대체율을 2023년 52%에서 2024년 55%로 높이고, 2030년까지 80%로 끌어올리는 목표를 세웠습니다.
원료의 수분 및 조성 편차
수분 함량 및 조성의 편차는 고형 재생 연료 시장에 있어 여전히 운영상의 과제로 남아 있습니다. EUWID는 2024년 12월, 독일의 한 시설에 공급된 상업 및 산업 폐기물의 발열량이 11-12MJ/kg이었던 반면, 플랜트의 설계치는 9.5-10.5MJ/kg이었습니다고 보고했습니다. 이러한 편차는 열적 스트레스를 유발하여, 지정된 가마 용도에서 연료의 적합성을 저하시킬 가능성이 있습니다. 또한, 재활용 요건으로 인해 PVC를 많이 함유한 플라스틱, 복합재료, 다층 포장재 등 처리가 어려운 성분이 잔여물로 남기도 합니다. 이러한 물질은 오염 위험을 높여 안정적인 연료 생산을 더욱 어렵게 만듭니다. 적응형 광학 선별 및 실시간 발열량 모니터링은 플랜트가 투입물의 변화에 대응하는 데 도움이 되지만, 지속적인 설비 투자와 운영 비용이 필요합니다.
부문 분석
2025년 기준, 고형 재생 연료(SRF) 시장 규모에서 원료별 점유율로 볼 때 일반 폐기물(MSW)이 54.8%를 차지했습니다. 이는 유럽과 북미의 가정용 쓰레기 수거 시스템 규모와 상대적인 일관성을 반영한 것입니다. MSW의 확고한 위상은 이 원료가 많은 유럽 시장에서 성숙 단계에 접어들었음을 나타냅니다. 고발열량 물질은 기계적·생물학적 처리나 재활용으로 전환될 가능성이 있어, 이에 따라 적절한 MSW 분획을 둘러싼 경쟁이 심화될 수 있습니다. 상업 및 산업 폐기물은 2026-2031년 연평균 성장률(CAGR) 5.9%를 나타낼 것으로 예측됩니다.
PreZero의 무르시아 시설은 Cemex 알리칸테 공장에 원료를 공급하고 있으며, 이 회사의 바르셀로나 공장은 연간 19만 톤의 상업 및 산업 폐기물을 처리하고 있습니다. 이러한 시설들은 선별과 물류가 통합될 경우, 상업 및 산업 폐기물이 시멘트 용도로 어떻게 활용될 수 있는지를 보여줍니다. 건설·해체 폐기물은 광물성 비활성 물질, 금속, 석고가 발열량을 낮출 가능성이 있어 여전히 충분히 활용되지 못하고 있습니다. 농업 폐기물 및 기타 폐기물 유입은 고형 재생 연료(SRF) 산업에서 여전히 비교적 작은 비중을 차지하고 있는데, 이는 주로 남아시아와 동남아시아에서 바이오매스 공급량과 시멘트의 공동 처리 능력 확대가 일치하고 있기 때문입니다. 2025년 보고서에 따르면, 독일의 시멘트 기업들은 일반 폐기물(MSW)과 상업 및 산업 폐기물의 혼합 비율을 문서화함으로써 2030년 열 대체 목표를 상향 조정하고 있는 것으로 나타났습니다.
지역별 분석
2025년, 유럽은 고형 재생 연료 시장의 56.9%를 차지했습니다. 이러한 위상은 폐기물 처리, 연료 품질 기준, 공동 처리 네트워크, 물류에 대한 장기적인 투자를 반영한 것입니다. 오스트리아, 독일, 스웨덴, 네덜란드는 성숙한 이용 시스템을 갖추고 있습니다. 오스트리아의 시멘트 산업은 사양서에 따른 연료 계약을 통해 2025년에 88.8%의 대체 연료 사용률을 달성했습니다. 개정된 EU 폐기물 운송 규정과 디지털 폐기물 운송 시스템은 2026년 5월부터 적용되기 시작했습니다.
아시아태평양은 2026-2031년 연평균 성장률(CAGR) 7.2%로 확대될 것으로 예상되며, 이는 고형 재생 연료 시장에서 지역별 가장 높은 성장률입니다. 중국, 인도, 인도네시아, 베트남이 주요 성장 지역이 될 것입니다. 중국의 ‘제로 웨이스트 도시’ 이니셔티브에는 도시 폐기물 관리를 보다 강력한 자원 회수 시스템으로 이끄는 시범 도시들이 포함되어 있습니다. 인도네시아는 2026년에 6억 달러를 초과하는 폐기물 발전 투자를 시작하여 전처리 및 연료 제조 인프라를 지원했습니다. 인도는 도시 폐기물의 수분 및 오염 문제에 직면해 있으며, 건조 처리나 고도 전처리를 하지 않으면 발열량이 저하될 가능성이 있습니다.
북미는 여전히 규모는 작지만, 시멘트 제조업체의 대체율 향상과 매립 비용 상승에 따라 발전 여지가 있습니다. 남미는 브라질을 선두로 발전하고 있으며, 상파울루에 위치한 연산 55만 톤 규모의 UTM Leste 플랜트는 2027년 가동을 시작할 예정이며, RDF 생산과 유기물 회수를 결합하도록 설계되었습니다. 중동 및 아프리카는 공동 처리 인프라가 제한적이어서 여전히 초기 단계에 머물러 있습니다. Geminor는 2026년 2월, Norad로부터 500만 노르웨이 크로네의 보조금을 받아, 서아프리카에서 플라스틱 폐기물을 활용해 SRF를 생산하고 시멘트 가마에서 이용하기 위한 허브 시설을 평가하게 되었습니다.
기타 혜택
- 엑셀 형식 시장 예측(ME) 시트
- 3개월간의 애널리스트 지원
자주 묻는 질문
목차
제1장 서론
제2장 조사 방법
제3장 주요 요약
제4장 시장 구도
제5장 시장 규모 및 성장 예측
제6장 경쟁 구도
제7장 시장 기회 및 향후 전망
AJY 26.09.03According to Mordor Intelligence, the solid recovered fuel market size is expected to grow from USD 6.64 billion in 2025 to USD 6.97 billion in 2026 and is forecast to reach USD 9.01 billion by 2031 at 5.26% CAGR over 2026-2031.
This report is Segmented by Feedstock Source (MSW, C&I Waste, C&D Waste, Other Waste Streams), End User (Cement Industry, CHP Plants, Power Generation Plants, Lime Industry, Steel & Metal Processing, Pulp & Paper, Other Industrial Users), and Geography (North America, Europe, Asia-Pacific, South America, and Middle East and Africa). The Market Forecasts are Provided in Terms of Value (USD).
Global Solid Recovered Fuel (SRF) Market Trends and Insights
Landfill Diversion and Energy-Recovery Mandates
Landfill reduction targets are shifting residual waste toward recovery routes and supporting feedstock availability for the solid recovered fuel market. The EU framework requires member states to limit municipal waste sent to landfill to 10% or less by 2035. A 2024 study for the EU Publications Office found that potential SRF production could exceed the estimated maximum capacity for SRF uptake in several member states. This places greater importance on processing capacity and stable industrial offtake than on waste availability alone. Operators that develop SRF-capable plants before regulatory deadlines tighten can secure access to residual material in their local catchment areas. France's sector produced nearly 1 million tonnes each year and had a target of 2.5 million to 3 million tonnes by 2030, although AFOCO identified a EUR 1 billion investment gap after the cancellation of the ADEME project fund in 2025.
Fossil-Fuel Substitution in Cement Manufacturing
Cement kilns remain a dependable source of demand for the solid recovered fuel market because their high operating temperatures can accommodate qualified waste-derived fuels. Austria's cement industry achieved an alternative fuel rate of 88.8% in 2025, rising from 87.7% in 2024, while conventional fuel inputs fell 6.4% year over year. A 2025 peer-reviewed study found that SRF substitution in cement kilns can reduce process greenhouse gas emissions by 200 kg CO2-equivalent per tonne of cement, with 80% substitution identified as the optimal point for environmental benefit. WASTE AND BIOMASS VALORIZATION The biogenic carbon fraction in MSW-derived SRF can lower fossil-carbon liability for cement operators covered by the EU ETS. Producers therefore have a stronger reason to provide certified fuel rather than lower-grade refuse-derived fuel. France's cement sector raised thermal substitution to 55% in 2024 from 52% in 2023 and stated a target of 80% by 2030. RECY.NET
Feedstock Moisture and Composition Variability
Inconsistent moisture content and composition remain operating challenges for the solid recovered fuel market. EUWID reported in December 2024 that commercial and industrial waste supplied to German facilities delivered calorific values of 11-12 MJ/kg against plant designs of 9.5-10.5 MJ/kg. Such variation can create thermal stress and reduce the suitability of fuel for intended kiln applications. Recycling requirements can also leave difficult fractions, including PVC-rich plastics, composites, and multilayer packaging, in the residual stream. These materials increase contamination risks and make consistent fuel production more difficult. Adaptive optical sorting and real-time calorific monitoring can help plants respond to changing inputs, but they require continuing capital and operating expenditure.
Other drivers and restraints analyzed in the detailed report include:
- EU ETS Fossil-Carbon Traceability and Premium SRF Demand
- Investment in Advanced Sorting and SRF Quality Infrastructure
- Capital, Permitting and Community-Acceptance Requirements
For complete list of drivers and restraints, kindly check the Table Of Contents.
Segment Analysis
Municipal solid waste held 54.8% of the solid recovered fuel market size by feedstock share in 2025. This reflects the scale and relative consistency of household waste collection systems in Europe and North America. The established position of MSW also shows that this feedstock is mature in many European markets. Higher-calorific material can be directed to mechanical-biological treatment and recycling, which can intensify competition for suitable MSW fractions. Commercial and industrial waste is forecast to grow at a 5.9% CAGR from 2026 to 2031.
PreZero's Murcia facility supplies the Cemex Alicante plant, and its Barcelona plant processes 190,000 tonnes of commercial and industrial waste each year. These facilities show how commercial and industrial waste can be used in cement applications when sorting and logistics are integrated. Construction and demolition waste remains underused because mineral inerts, metals, and gypsum can reduce calorific yield. Agricultural and other waste streams remain smaller elements of the solid recovered fuel industry, mainly in South and Southeast Asia, where biomass availability meets developing cement co-processing capacity. German cement companies were reported in 2025 to be increasing their 2030 thermal substitution targets through documented blends of MSW and commercial and industrial fractions.
Complete Report Scope:
- By Feedstock Source
- Municipal Solid Waste (MSW)
- Commercial & Industrial (C&I) Waste
- Construction & Demolition (C&D) Waste
- Agricultural Waste
- Other Waste Streams
- By End User
- Cement Industry
- Combined Heat and Power (CHP) Plants
- Power Generation Plants
- Lime Industry
- Steel & Metal Processing
- Pulp & Paper Industry
- Other Industrial Users
- By Geography
- North America
- United States
- Canada
- Mexico
- Europe
- Germany
- France
- Italy
- Spain
- United Kingdom
- Poland
- Russia
- Rest of Europe
- Asia-Pacific
- China
- India
- Japan
- South Korea
- Australia
- Indonesia
- Vietnam
- Thailand
- Rest of Asia-Pacific
- South America
- Brazil
- Argentina
- Chile
- Rest of South America
- Middle East and Africa
- Saudi Arabia
- United Arab Emirates
- Egypt
- South Africa
- Morocco
- Rest of Middle East and Africa
- North America
Geography Analysis
Europe held 56.9% of the solid recovered fuel market share in 2025. This position reflects long-term investment in waste processing, fuel quality standards, co-processing networks, and logistics. Austria, Germany, Sweden, and the Netherlands have mature utilization systems. Austria's cement industry achieved an 88.8% alternative fuel substitution rate in 2025 through specification-based fuel contracts. The revised EU Waste Shipment Regulation and the Digital Waste Shipment System became applicable in May 2026.
Asia-Pacific is forecast to expand at a 7.2% CAGR from 2026 to 2031, the highest rate among regions in the solid recovered fuel market. China, India, Indonesia, and Vietnam are the main growth areas. China's Zero Waste City initiative has included pilot cities that direct urban waste management toward stronger resource recovery systems. Indonesia initiated more than USD 600 million in waste-to-energy investment in 2026, supporting pretreatment and fuel-preparation infrastructure. India faces moisture and contamination issues in municipal waste, which can reduce calorific yield without drying and advanced pretreatment.
North America remains smaller but has room to develop as cement producers raise substitution rates and landfill costs increase. South America is advancing through Brazil, where the 550,000 tonne-per-year UTM Leste plant in Sao Paulo is scheduled for commissioning in 2027 and is designed to combine RDF production with organic recovery. The Middle East and Africa remain at an earlier stage because co-processing infrastructure is limited. Geminor received a NOK 5 million grant from Norad in February 2026 to assess a plastic-waste-to-SRF hub in West Africa for cement-kiln use.
- A2A S.p.A.
- Andusia Recovered Fuels Limited
- Beauparc Group
- Biffa Limited
- BMH Technology Oy
- Enva Group plc
- FCC Servicios Medio Ambiente Holding, S.A.U.
- Geminor AS
- Geocycle SA
- Indaver NV
- N+P Group Holdings Ltd.
- PreZero International GmbH
- REMONDIS SE & Co. KG
- Renewi plc
- SUEZ S.A.
- Veolia Environnement S.A.
Additional Benefits:
- The market estimate (ME) sheet in Excel format
- 3 months of analyst support
TABLE OF CONTENTS
1 INTRODUCTION
- 1.1 Study Assumptions and Market Definition
- 1.2 Scope of the Study
2 RESEARCH METHODOLOGY
3 EXECUTIVE SUMMARY
4 MARKET LANDSCAPE
- 4.1 Market Overview
- 4.2 Market Drivers
- 4.2.1 Landfill Diversion and Energy-Recovery Mandates
- 4.2.2 Fossil-Fuel Substitution in Cement Manufacturing
- 4.2.3 Investment in Advanced Sorting and SRF Quality Infrastructure
- 4.2.4 Waste Generation and Industrial Heat Demand
- 4.2.5 EU ETS Fossil-Carbon Traceability and Premium SRF Demand
- 4.2.6 Cross-Border Price Arbitrage and Digital Traceability
- 4.3 Market Restraints
- 4.3.1 Feedstock Moisture and Composition Variability
- 4.3.2 Capital, Permitting and Community-Acceptance Requirements
- 4.3.3 Recycling Cannibalization and Negative-Value Plastic Fractions
- 4.3.4 Limited Economical Haul Distance and Contamination Risk
- 4.4 Supply-Chain Analysis
- 4.5 Porter's Five Forces Analysis
- 4.5.1 Bargaining Power of Suppliers
- 4.5.2 Bargaining Power of Buyers
- 4.5.3 Threat of New Entrants
- 4.5.4 Threat of Substitutes
- 4.5.5 Competitive Rivalry
- 4.6 Technology Outlook
- 4.7 Regulatory Landscape
- 4.8 Investment Analysis
5 MARKET SIZE AND GROWTH FORECASTS
- 5.1 By Feedstock Source
- 5.1.1 Municipal Solid Waste (MSW)
- 5.1.2 Commercial & Industrial (C&I) Waste
- 5.1.3 Construction & Demolition (C&D) Waste
- 5.1.4 Agricultural Waste
- 5.1.5 Other Waste Streams
- 5.2 By End User
- 5.2.1 Cement Industry
- 5.2.2 Combined Heat and Power (CHP) Plants
- 5.2.3 Power Generation Plants
- 5.2.4 Lime Industry
- 5.2.5 Steel & Metal Processing
- 5.2.6 Pulp & Paper Industry
- 5.2.7 Other Industrial Users
- 5.3 By Geography
- 5.3.1 North America
- 5.3.1.1 United States
- 5.3.1.2 Canada
- 5.3.1.3 Mexico
- 5.3.2 Europe
- 5.3.2.1 Germany
- 5.3.2.2 France
- 5.3.2.3 Italy
- 5.3.2.4 Spain
- 5.3.2.5 United Kingdom
- 5.3.2.6 Poland
- 5.3.2.7 Russia
- 5.3.2.8 Rest of Europe
- 5.3.3 Asia-Pacific
- 5.3.3.1 China
- 5.3.3.2 India
- 5.3.3.3 Japan
- 5.3.3.4 South Korea
- 5.3.3.5 Australia
- 5.3.3.6 Indonesia
- 5.3.3.7 Vietnam
- 5.3.3.8 Thailand
- 5.3.3.9 Rest of Asia-Pacific
- 5.3.4 South America
- 5.3.4.1 Brazil
- 5.3.4.2 Argentina
- 5.3.4.3 Chile
- 5.3.4.4 Rest of South America
- 5.3.5 Middle East and Africa
- 5.3.5.1 Saudi Arabia
- 5.3.5.2 United Arab Emirates
- 5.3.5.3 Egypt
- 5.3.5.4 South Africa
- 5.3.5.5 Morocco
- 5.3.5.6 Rest of Middle East and Africa
- 5.3.1 North America
6 COMPETITIVE LANDSCAPE
- 6.1 Market Concentration
- 6.2 Strategic Moves
- 6.3 Market Share Analysis
- 6.4 Company Profiles (includes Global Level Overview, Market Level Overview, Core Segments, Financials as available, Strategic Information, Market Rank/Share, Products and Services, Recent Developments)
- 6.4.1 A2A S.p.A.
- 6.4.2 Andusia Recovered Fuels Limited
- 6.4.3 Beauparc Group
- 6.4.4 Biffa Limited
- 6.4.5 BMH Technology Oy
- 6.4.6 Enva Group plc
- 6.4.7 FCC Servicios Medio Ambiente Holding, S.A.U.
- 6.4.8 Geminor AS
- 6.4.9 Geocycle SA
- 6.4.10 Indaver NV
- 6.4.11 N+P Group Holdings Ltd.
- 6.4.12 PreZero International GmbH
- 6.4.13 REMONDIS SE & Co. KG
- 6.4.14 Renewi plc
- 6.4.15 SUEZ S.A.
- 6.4.16 Veolia Environnement S.A.
7 MARKET OPPORTUNITIES AND FUTURE OUTLOOK
- 7.1 White-Space and Unmet-Need Assessment


