|
시장보고서
상품코드
2119805
인도네시아의 데이터센터 스토리지 : 시장 점유율 분석, 업계 동향 및 통계, 성장 예측(2026-2031년)Indonesia Data Center Storage - Market Share Analysis, Industry Trends & Statistics, Growth Forecasts (2026 - 2031) |
||||||
 Mordor Intelligence
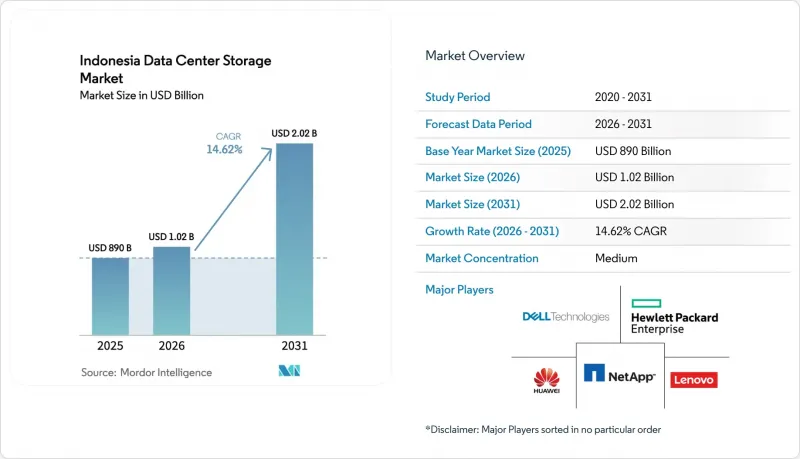
Mordor Intelligence에 의하면, 2026년 인도네시아의 데이터센터 스토리지 시장 규모는 10억 2,000만 달러로 추정되고 2025년 8억 9,000만 달러에서 성장하여 2031년에는 20억 2,000만 달러에 이를 것으로 예측됩니다.
2026-2031년 동안의 연평균 성장률(CAGR)은 14.62%가 될 것으로 전망됩니다.
본 보고서는 스토리지 기술(네트워크 연결형 스토리지, 스토리지 영역 네트워크, 기타), 스토리지 유형(기존 HDD 어레이, 기타),데이터센터 유형(코로케이션 시설, 기타), 최종 사용자(IT 및 통신, 은행, 금융서비스 및 보험(BFSI), 기타), 폼 팩터(랙 마운트형, 기타), 인터페이스(SAS/SATA, NVMe, 파이버 채널·iSCSI)별로 분류되어 있습니다. 시장 예측은 금액(미 달러) 기준으로 제시되어 있습니다.
인도네시아의 데이터센터 스토리지 시장 동향 및 인사이트
전국적인 IT 인프라 확대
전국 규모의 백본 구축으로 인해 용량이 자카르타에서 514개 지자체로 이전되고 있으며, 사업자들은 1만 7,000개의 섬 전역에서 저지연 서비스를 보장하기 위해 분산형 스토리지 토폴로지를 도입해야 합니다. 텔콤 인도네시아는 1,000만 가구에 광섬유를 확장하여 동영상 캐시 및 IoT 원격 측정용 엣지 스토리지 노드의 보급을 촉진하고 있습니다. 모바일 데이터 소비량 증가(2013년 대비 50배)로 인해 총 스토리지 용량은 확대되고 있는 반면, 각 지자체의 ‘스마트 시티’ 프로젝트로 인해 수십 개의 마이크로 수요 거점이 생겨나고 있습니다. 따라서 각 벤더사는 대역폭에 제약이 있는 사이트에서도 자율적인 운영이 가능한 페더레이티드 SAN 및 오브젝트 스토리지로 무게중심을 옮기고 있습니다. 이러한 추세는 자가 복구 기능과 경량 관리 스택을 결합한 인도네시아의 데이터센터 스토리지 시장 솔루션의 장기적인 성장을 뒷받침하는 기반이 되고 있습니다.
하이퍼스케일 시설에 대한 투자 확대
마이크로소프트가 17억 달러를 투자한 클라우드 리전은 AI 지원 인프라의 새로운 기준을 제시하고 있습니다. GPU 클러스터와 NVMe-oF 패브릭을 결합하여 100마이크로초 미만의 지연 시간을 실현하고 있습니다. 디지털 리얼티가 벨사마 디지털 인프라 아시아와 1억 달러 규모로 설립한 합작 기업은 세계 기업이 지분 공유 구조를 통해 현지 규정 준수 요건을 충족하는 방법을 보여주고 있습니다. 자카르타와 바탐에 위치한 하이퍼스케일 클러스터는 전력, 광섬유, 중립적인 코로케이션을 한곳에 집중시켜 테라바이트당 가격을 낮추는 동시에 올플래시 어레이로의 교체 주기를 가속화하고 있습니다. 소규모 공급업체들은 경쟁력을 유지하기 위해 레거시 시설의 개조를 서두르고 있으며, 이는 인도네시아 데이터센터 스토리지 시장에서 선순환적인 업그레이드 연쇄를 촉진하고 있습니다. 이러한 자본 유입으로 차세대 스토리지 프로토콜의 도입 기간이 단축되고, 서비스 수준에 대한 약속을 둘러싼 경쟁이 치열해지고 있습니다.
최신 스토리지 어레이의 높은 초기 CAPEX
엔터프라이즈급 올플래시 플랫폼은 대개 50만 달러를 초과하기 때문에 자금 조달에 제약이 있는 인도네시아 기업들에게는 장벽이 되고 있습니다. 2024년에는 반도체 부족으로 인해 조달 비용이 더욱 치솟고, 리드타임이 길어지며, 리프레시 주기가 지연되었습니다. 중소기업은 리스 모델에 의존하거나 HDD 중심의 구성을 유지하고 있으며, 그 결과 운영 비용(OPEX)이 증가하고 성능 향상의 여지가 제한되고 있습니다. 엄격한 암호화 및 감사 규정에 얽매여 있는 금융 기관은 기본 하드웨어에 규정 준수 모듈을 추가함으로써 더욱 막대한 비용을 부담하게 됩니다. 이러한 자본 유출로 인해 인도네시아의 데이터센터 스토리지 시장에서 NVMe 및 소프트웨어 정의 아키텍처의 광범위한 보급이 지연되고 있습니다.
부문 분석
인도네시아의 데이터센터 스토리지 시장에서 SAN이 차지하는 시장 규모는 2025년에 2억 3,250만 달러에 달하며, 점유율은 26.12%를 기록했습니다. 고성능 블록 액세스를 통해 SAN은 핵심 뱅킹, 청구 처리, ERP 워크로드 분야에서 여전히 확고한 입지를 유지하고 있습니다. 한편, 지방 지점에서 파일을 로컬에 캐시한 후 수도로 미러링하여 WAN 트래픽을 줄이고 있기 때문에 NAS는 연평균 성장률(CAGR) 14.78%라는 빠른 속도로 확대되고 있습니다. 오브젝트 스토리지와 테이프 스토리지는 틈새 시장이면서도 전략적인 위치를 계속 차지하고 있습니다. 오브젝트 스토리지는 OTT 동영상 라이브러리를, 테이프 스토리지는 에어 갭이 적용된 규정 준수 아카이브를 보호하고 있습니다.
NAS의 성장은 분산형 컴퓨팅으로의 구조적 전환을 여실히 보여주고 있습니다. 소매 체인은 POS 시스템 근처에 듀얼 컨트롤러 NAS 클러스터를 도입하여 네트워크 장애 시에도 업무를 지속하고 있습니다. 이에 대응하여 SAN 벤더는 지연 시간을 줄이기 위해 NVMe-over-Fabrics를 번들로 제공함으로써 미션 크리티컬 시장 점유율을 지키고 있습니다. 하이브리드 환경이 성숙해짐에 따라 오케스트레이션 도구가 SAN, NAS, 오브젝트 풀 간에 데이터 세트를 자동으로 마이그레이션하여, 인도네시아의 데이터센터 스토리지 시장을 워크로드 프로파일 및 비용 한도에 맞추어 최적화하고 있습니다.
HDD 어레이는 2025년에도 매출 점유율 43.02%를 유지하며, 콜드 데이터나 동영상 데이터 저장에 주로 활용되었습니다. 그럼에도 불구하고, 올플래시 어레이가 핀테크 및 라이드셰어 앱의 지연 시간 문제를 해결함에 따라 플래시 제품의 출하 대수는 전년 대비 급증했습니다. 기가바이트당 비용 감소와 전력 소비 절감으로 인해, 특히 메가와트당 단가가 전 세계 연료 가격 동향에 연동되는 상황에서는 플래시의 ROI가 더욱 향상되고 있습니다. 하이브리드 어레이는 이러한 격차를 메우고 있습니다. 자동 계층화 소프트웨어가 사용되지 않는 블록을 동적으로 HDD로 이동시킴으로써 스토리지 용량에 드는 비용을 30-40% 절감합니다.
또한, 플래시는 랙 밀도 향상에도 기여하고 있으며, 올플래시 어레이(AFA)는 2031년까지 연평균 15.12%의 성장이 예상됩니다. 유통업체에 따르면, 주류 AFA SKU의 리드타임은 6주 이하로, 탄중 프리옥 항구에서 종종 체류하는 HDD의 일괄 출하에 비해 우위를 점하고 있습니다. NAND 로드맵이 3D-QLC로 진전되는 가운데, 인도네시아의 데이터센터 스토리지 시장에서는 2027년까지 읽기 집약형 워크로드에서 NAND와 HDD의 가격이 동등해질 것으로 예상되며, 이로 인해 회전식 미디어로부터의 전환이 가속화될 전망입니다.
기타 혜택
- 엑셀 형식 시장 예측(ME) 시트
- 3개월간의 애널리스트 지원
자주 묻는 질문
목차
제1장 서론
제2장 조사 방법
제3장 주요 요약
제4장 시장 구도
제5장 시장 규모 및 성장 예측
제6장 경쟁 구도
제7장 시장 기회 및 향후 전망
KTHAccording to Mordor Intelligence, Indonesia's data center storage market size in 2026 is estimated at USD 1.02 billion, growing from 2025 value of USD 890 million with 2031 projections showing USD 2.02 billion, growing at 14.62% CAGR over 2026-2031.
This report is Segmented by Storage Technology (Network-Attached Storage, Storage Area Network, and More), Storage Type (Traditional HDD Arrays and More ), Data Center Type (Colocation Facilities and More), End User (IT and Telecommunication, BFSI and More), Form Factor (Rack-Mounted and More), Interface(sas / SATA, Nvme, Fibre Channel and ISCSI). The Market Forecasts are Provided in Terms of Value (USD).
Indonesia Data Center Storage Market Trends and Insights
Expansion of IT Infrastructure Nationwide
Nationwide backbone roll-outs move capacity from Jakarta toward 514 municipalities, forcing operators to adopt distributed storage topologies that guarantee low-latency services across 17,000 islands. Telkom Indonesia has extended fiber to 10 million homes, stimulating edge-storage nodes for video caching and IoT telemetry. Rising mobile data consumption-up fifty-fold since 2013-magnifies aggregate storage volumes, while municipal "smart-city" projects create dozens of micro demand centers. Vendors, therefore, pivot to federated SAN and object stores capable of autonomous operations in bandwidth-constrained sites. This pattern anchors long-run growth for Indonesia data center storage market solutions that combine self-healing capabilities with lightweight management stacks.
Rising Investments in Hyperscale Facilities
Microsoft's USD 1.7 billion cloud region is setting a new benchmark for AI-ready infrastructure, pairing GPU clusters with NVMe-oF fabrics for sub-100-microsecond latency. Digital Realty's USD 100 million joint venture with Bersama Digital Infrastructure Asia shows how global firms secure local compliance through shared equity structures. Hyperscale clusters in Jakarta and Batam concentrate power, fiber, and neutral colocation, compressing per-terabyte pricing and accelerating refresh cycles toward all-flash arrays. Smaller providers rush to retrofit legacy halls to stay relevant, fuelling a virtuous upgrade loop in the Indonesia data center storage market. These capital flows shorten adoption timelines for next-generation storage protocols and intensify competition on service-level commitments.
High Upfront CAPEX for Modern Storage Arrays
All-flash platforms often exceed USD 500,000 for enterprise-grade sets, a hurdle for cash-constrained Indonesian firms. Semiconductor shortages amplified procurement costs in 2024, extending lead times and delaying refresh cycles. SMEs resort to leasing models or continue with HDD-centric layouts that inflate OPEX and limit performance headroom. Financial institutions, bound by stringent encryption and audit rules, face even higher bills when layering compliance modules onto base hardware. This capital drain postpones the broader penetration of NVMe and software-defined architectures within the Indonesian data center storage market.
Other drivers and restraints analyzed in the detailed report include:
- Accelerated Enterprise Cloud-Adoption Wave
- Government "Making Indonesia 4.0" Digital Push
- Shortage of Advanced Storage-Management Talent
For complete list of drivers and restraints, kindly check the Table Of Contents.
Segment Analysis
The Indonesian data center storage market size attributable to SAN reached USD 232.5 million in 2025, equal to a 26.12% share. High-performance block access keeps SAN entrenched in core banking, billing, and ERP workloads. Yet, NAS is expanding faster at a 14.78% CAGR as provincial branches cache files locally and then mirror to the capital, cutting WAN traffic. Object and tape retain niche but strategic seats: object captures OTT video libraries, whereas tape safeguards air-gapped compliance archives.
NAS growth underscores a structural tilt toward distributed compute. Retail chains deploy dual-controller NAS clusters near point-of-sale systems, sustaining operations during network outages. SAN vendors counter by bundling NVMe-over-Fabrics to shave latency, defending mission-critical shares. As hybrid footprints mature, orchestration tools automatically migrate datasets between SAN, NAS, and object pools, keeping the Indonesian data center storage market aligned with workload profiles and cost envelopes.
HDD arrays retained 43.02% revenue share in 2025, favored for cold data and video retention. Still, flash shipments surged year on year as all-flash arrays answered latency complaints in fintech and ride-hailing apps. Falling cost per gigabyte and power savings strengthen flash ROI, especially when megawatt tariffs track global fuel trends. Hybrid arrays bridge the gap: auto-tiering software dynamically demotes idle blocks to HDD, cutting capacity spend by 30-40%.
Flash also improves rack density, while all-flash arrays are growing at 15.12% through 2031. Distributors report lead times under six weeks for mainstream AFA SKUs, an edge over HDD batches that often queue at Tanjung Priok port. As the NAND roadmap heads to 3D-QLC, the Indonesian data center storage market anticipates parity pricing for read-intensive workloads by 2027, accelerating the rotation out of spinning media
Complete Report Scope:
- By Storage Technology
- Network Attached Storage (NAS)
- Storage Area Network (SAN)
- Direct Attached Storage (DAS)
- Object and Tape Storage
- By Storage Type
- Traditional HDD Arrays
- All-Flash Arrays (AFA)
- Hybrid Storage
- By Data Center Type
- Colocation Facilities
- Hyperscalers/Cloud Service Providers
- Enterprise and Edge
- By End User
- IT and Telecommunication
- BFSI
- Government and Public Sector
- Media and Entertainment
- Healthcare and Life Sciences
- Manufacturing
- By Form Factor
- Rack-mounted
- Blade and Modular
- Disaggregated / Composable
- By Interface
- SAS / SATA
- NVMe
- Fibre Channel and iSCSI
List of Companies Covered in this Report:
- Dell Technologies
- Hewlett Packard Enterprise (HPE)
- Huawei Technologies
- NetApp
- Lenovo
- Fujitsu
- Seagate Technology
- Western Digital
- IBM
- Hitachi Vantara
- Pure Storage
- Kingston Technology
- Inspur
- Synology
- Oracle
- NEC
- QNAP Systems
- Supermicro
- Infortrend
- Micron Technology Inc.
Additional Benefits:
- The market estimate (ME) sheet in Excel format
- 3 months of analyst support
TABLE OF CONTENTS
1 INTRODUCTION
- 1.1 Study Assumptions and Market Definition
- 1.2 Scope of the Study
2 RESEARCH METHODOLOGY
3 EXECUTIVE SUMMARY
4 MARKET LANDSCAPE
- 4.1 Market Overview
- 4.2 Market Drivers
- 4.2.1 Expansion of IT infrastructure nationwide
- 4.2.2 Rising investments in hyperscale facilities
- 4.2.3 Accelerated enterprise cloud-adoption wave
- 4.2.4 Government Making Indonesia 4.0 digital push
- 4.2.5 Uptake of S3-compatible object storage for OTT and CCTV
- 4.2.6 New submarine-cable landings enabling data-localisation
- 4.3 Market Restraints
- 4.3.1 High upfront CAPEX for modern storage arrays
- 4.3.2 Shortage of advanced storage-management talent
- 4.3.3 Grid-power unreliability inflating TCO
- 4.3.4 Seismic and flood risks boosting insurance/design costs
- 4.4 Supply-Chain Analysis
- 4.5 Regulatory Landscape
- 4.6 Technological Outlook
- 4.7 Porter's Five Forces Analysis
- 4.7.1 Threat of New Entrants
- 4.7.2 Bargaining Power of Buyers
- 4.7.3 Bargaining Power of Suppliers
- 4.7.4 Threat of Substitutes
- 4.7.5 Competitive Rivalry
- 4.8 Assessment of Macroeconomic Factors on the Market
5 MARKET SIZE and GROWTH FORECASTS (VALUE)
- 5.1 By Storage Technology
- 5.1.1 Network Attached Storage (NAS)
- 5.1.2 Storage Area Network (SAN)
- 5.1.3 Direct Attached Storage (DAS)
- 5.1.4 Object and Tape Storage
- 5.2 By Storage Type
- 5.2.1 Traditional HDD Arrays
- 5.2.2 All-Flash Arrays (AFA)
- 5.2.3 Hybrid Storage
- 5.3 By Data Center Type
- 5.3.1 Colocation Facilities
- 5.3.2 Hyperscalers/Cloud Service Providers
- 5.3.3 Enterprise and Edge
- 5.4 By End User
- 5.4.1 IT and Telecommunication
- 5.4.2 BFSI
- 5.4.3 Government and Public Sector
- 5.4.4 Media and Entertainment
- 5.4.5 Healthcare and Life Sciences
- 5.4.6 Manufacturing
- 5.5 By Form Factor
- 5.5.1 Rack-mounted
- 5.5.2 Blade and Modular
- 5.5.3 Disaggregated / Composable
- 5.6 By Interface
- 5.6.1 SAS / SATA
- 5.6.2 NVMe
- 5.6.3 Fibre Channel and iSCSI
6 COMPETITIVE LANDSCAPE
- 6.1 Market Concentration
- 6.2 Strategic Moves
- 6.3 Market Share Analysis
- 6.4 Company Profiles {(includes Global level Overview, Market level overview, Core Segments, Financials as available, Strategic Information, Market Rank/Share for key companies, Products and Services, and Recent Developments)}
- 6.4.1 Dell Technologies
- 6.4.2 Hewlett Packard Enterprise (HPE)
- 6.4.3 Huawei Technologies
- 6.4.4 NetApp
- 6.4.5 Lenovo
- 6.4.6 Fujitsu
- 6.4.7 Seagate Technology
- 6.4.8 Western Digital
- 6.4.9 IBM
- 6.4.10 Hitachi Vantara
- 6.4.11 Pure Storage
- 6.4.12 Kingston Technology
- 6.4.13 Inspur
- 6.4.14 Synology
- 6.4.15 Oracle
- 6.4.16 NEC
- 6.4.17 QNAP Systems
- 6.4.18 Supermicro
- 6.4.19 Infortrend
- 6.4.20 Micron Technology Inc.
7 MARKET OPPORTUNITIES and FUTURE OUTLOOK
- 7.1 White-space and Unmet-need Assessment