|
시장보고서
상품코드
2119814
싱가포르의 데이터센터 스토리지 : 시장 점유율 분석, 업계 동향 및 통계, 성장 예측(2026-2031년)Singapore Data Center Storage - Market Share Analysis, Industry Trends & Statistics, Growth Forecasts (2026 - 2031) |
||||||
 Mordor Intelligence
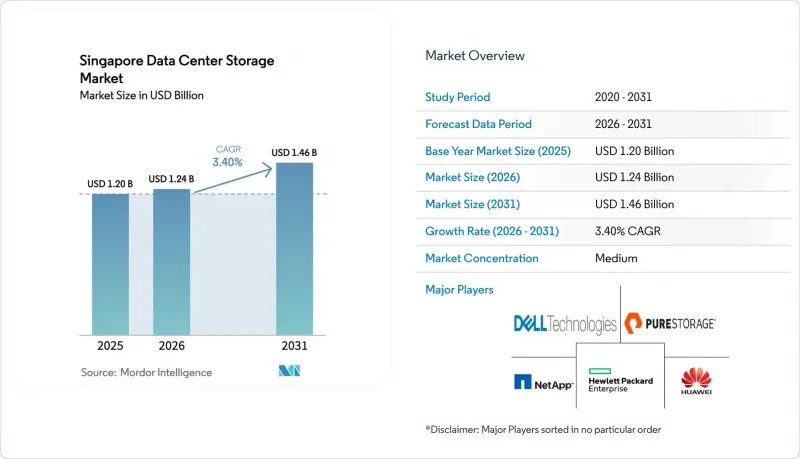
Mordor Intelligence에 의하면, 2026년 싱가포르의 데이터센터 스토리지 시장 규모는 12억 4,000만 달러로 추정되고 2025년 12억 달러에서 확대해, 2031년에는 14억 6,000만 달러에 이를 것으로 예측됩니다.
2026-2031년 동안의 연평균 성장률(CAGR)은 3.40%가 될 것으로 전망됩니다.
본 보고서는 스토리지 기술(네트워크 연결형 스토리지(NAS), 스토리지 영역 네트워크(SAN), 기타), 스토리지 유형(기존 HDD 어레이, 기타), 최종 사용자(IT 및 통신, 은행, 금융서비스 및 보험(BFSI), 정부 기관, 기타)별로 분류되어 있습니다. 또한 폼 팩터(랙 마운트형, 기타), 인터페이스(SAS/SATA, 기타)에 대해서도 분류되어 있습니다. 모든 부문에 대해 시장 규모와 전망은 금액(달러)으로 제시되어 있습니다.
싱가포르의 데이터센터 스토리지 시장 동향 및 인사이트
정부의 ‘그린 DC’ 전력 배분 정책이 플래시 스토리지 도입을 촉진
싱가포르는 300MW의 신규 전력 공급 할당량을 확보하고, 그중 200MW를 재생에너지를 이용하는 사업자에게 우선적으로 배정함으로써, 구매자들이 엄격한 PUE 1.3 기준치 이내로 전력을 소비하는 저전력 올플래시 어레이로 전환하도록 유도하고 있습니다. 사업자들로부터는 HDD에 비해 최대 85%의 전력 절감 및 랙 설치 면적의 대폭적인 축소가 보고되고 있습니다. 한 정부 부처에서는 최근 Pure Storage 시스템 도입을 통해 바닥 면적을 94% 줄였습니다. 이는 해당 정책이 기술의 보급을 얼마나 촉진하는지 여실히 보여줍니다. 이 정책에서는 조기 도입자에게 우대적인 전력 배분이 제공되어, 싱가포르의 데이터센터 스토리지 시장 전체에서 플래시 스토리지 수요를 가속화하는 경쟁 우위가 창출되고 있습니다.
AI 워크로드에는 NVMe의 성능 능력이 필수적
생성형 AI 모델은 기존 스토리지 설계에 부담을 주고 있지만, NVMe의 병렬 큐는 대용량 GPU 클러스터에 있어 매우 중요한 지연 시간 병목 현상을 해소합니다. 키오크시아의 122.88TB 엔터프라이즈 SSD와 마이크론의 6500 ION 시리즈는 모두 처리량을 향상시키면서 랙의 전력 소비를 억제합니다. 이러한 성능 향상으로 AI 훈련 주기가 단축됨에 따라, 클라우드 제공업체들은 싱가포르의 데이터센터 스토리지 시장에서 신규 용량의 표준으로 NVMe를 지정하고 있습니다.
높은 초기 투자 비용(Capex)이 도입의 장벽으로 작용
올플래시 어레이는 구매 시 비용이 HDD 시스템에 비해 여전히 2-3배 높아, 중견 기업의 예산을 압박하고 있습니다. 게다가 전원 공급 장치 업그레이드나 냉각 시스템 개조에 따른 추가 비용이 발생하여 투자 회수 기간이 길어지고 있습니다. STaaS(Storage-as-a-Service) 모델은 설비 투자를 일부 상쇄하지만, 규제 대상 워크로드의 경우 데이터 주권에 대한 우려가 발생할 가능성이 있어 싱가포르의 데이터센터 스토리지 시장의 성장을 둔화시키고 있습니다.
부문 분석
스토리지 영역 네트워크(SAN)는 2025년에 46.85%의 점유율을 차지했으며, 이는 저지연 블록 스토리지가 필요한 금융 및 통신 용도의 성능 기반으로서의 위상을 반영합니다. 연평균 성장률(CAGR) 5.12%로 성장하고 있는 NAS는 유연한 파일 프로토콜이 중요한 협업 워크로드 및 엣지 데이터 수집 이용 사례를 지원하기 시작하고 있습니다. 싱가포르의 데이터센터용 스토리지 시장에서는 장기 보관을 위한 오브젝트 스토리지 계층을 추가한 하이브리드 환경에서 두 기술이 계속해서 융합되고 있습니다. 벤더의 로드맵에서는 통합 관리 계층이 점점 더 많이 제공되고 있어, 운영자는 다운타임 없이 SAN과 NAS 간에 데이터 세트를 마이그레이션할 수 있게 되었습니다.
동시에, 미국 특허 US10917321B2에 개략적으로 설명된 디어그리게이트된 메모리 아키텍처는 컴퓨팅과 스토리지를 분리하여 리소스 활용을 최적화하는 새로운 대안을 제시하고 있습니다(patents.google.com). 초기 실증 실험에서는 활용도 향상으로 인해 유휴 용량이 감소하는 것으로 나타났으며, 싱가포르의 데이터센터 스토리지 시장 전반에 걸쳐 탄소 관련 비용 압박이 커지는 가운데 이는 매우 매력적인 이점입니다.
2025년에도 기존 HDD 어레이는 여전히 39.55%의 점유율을 차지했지만, 올플래시 어레이는 연평균 성장률(CAGR) 6.54%로 가장 빠르게 성장하고 있습니다. 이러한 전환을 뒷받침하는 것은 AI 및 분석 워크로드를 직접 개선하는 밀리초 미만의 지연 시간과 높은 IOPS와 같은 구체적인 성능 향상입니다. 싱가포르의 데이터센터 스토리지 시장 규모는 미디어 비용의 하락과 에너지 가격의 상승을 모두 반영하고 있으며, 이는 플래시의 낮은 ‘와트/IO’ 프로파일을 유리하게 만들고 있습니다.
공공 부문 프로젝트는 플래시의 경제성을 명확하게 보여주고 있습니다. 한 정부 부처의 도입을 통해 랙 공간이 94% 감소했고, 에너지 비용도 절반으로 줄었습니다. 2026년까지 150TB 및 300TB 드라이브를 실현하겠다고 약속하는 플래시의 밀도 로드맵은 HDD의 퇴출을 더욱 가속화할 것으로 보입니다. 다만, 싱가포르의 데이터센터 스토리지 시장의 중기 전망에서는 Tier 2 워크로드를 위해 하이브리드 시스템이 계속해서 활용될 것으로 예측됩니다.
기타 혜택
- 엑셀 형식 시장 예측(ME) 시트
- 3개월간의 애널리스트 지원
자주 묻는 질문
목차
제1장 서론
제2장 조사 방법
제3장 주요 요약
제4장 시장 구도
제5장 시장 규모 및 성장 예측
제6장 경쟁 구도
제7장 투자 분석
제8장 시장 기회 및 향후 전망
KTHAccording to Mordor Intelligence, Singapore data center storage market size in 2026 is estimated at USD 1.24 billion, growing from 2025 value of USD 1.20 billion with 2031 projections showing USD 1.46 billion, growing at 3.40% CAGR over 2026-2031.
This report is Segmented Into Storage Technology (Network Attached Storage (NAS), Storage Area Network (SAN) and More), Storage Type (Traditional Storage, and More), and End-User (IT & Telecommunication, BFSI, Government, and More). Form Factor (Rack-Mounted and ), Interface (SAS / SATA and More). The Market Sizes and Forecasts are Provided in Terms of Value (USD) for all the Segments.
Singapore Data Center Storage Market Trends and Insights
Government "Green DC" Power-Allocation Drives Flash Storage Adoption
Singapore earmarked 300 MW of new capacity, with 200 MW ring-fenced for operators using renewable energy, nudging buyers toward low-power all-flash arrays that fit within a strict 1.3 PUE threshold. Operators report up to an 85% power reduction versus HDD and significantly smaller rack footprints. A recent ministry refresh trimmed floor area by 94% after deploying Pure Storage systems, underscoring how policy catalyzes technology. The same policy grants early adopters preferential power allocation, creating a competitive edge that accelerates flash demand across the Singapore data center storage market.
AI Workloads Demand NVMe Performance Capabilities
Generative-AI models strain classical storage designs; NVMe's parallel queues eliminate latency bottlenecks vital for high-volume GPU clusters. Kioxia's 122.88 TB enterprise SSD and Micron's 6500 ION series each raise throughput while curbing rack power use. These performance gains shorten AI training cycles, prompting cloud providers to specify NVMe as a standard for new capacity in the Singapore data center storage market.
High Upfront Capex Creates Adoption Barriers
All-flash arrays still cost 2-3x more at purchase than HDD systems, straining budgets for mid-market firms Additional costs arise from power upgrades and cooling retrofits, extending payback periods. Storage-as-a-service models partly offset capex but can introduce sovereignty concerns for regulated workloads, tempering growth in the Singapore data center storage market.
Other drivers and restraints analyzed in the detailed report include:
- Data Sovereignty Rules Reshape Storage Architectures
- Expansion of IT Infrastructure and Cloud On-ramps
- Land and Power Constraints Persist Despite Policy Changes
For complete list of drivers and restraints, kindly check the Table Of Contents.
Segment Analysis
Storage Area Networks captured 46.85% share in 2025, reflecting their position as the performance backbone for financial and telco applications that demand low-latency block storage. NAS, scaling at 5.12% CAGR, is taking on collaborative workloads and edge ingestion use cases where flexible file protocols matter. The Singapore data center storage market continues to blend both technologies in hybrid estates that add object storage tiers for long-term archives. Vendor roadmaps increasingly offer unified management layers, allowing operators to shift datasets between SAN and NAS without downtime.
At the same time, disaggregated memory architectures outlined in US Patent US10917321B2 create an emerging option that separates compute from storage to optimize resource use patents.google.com. Early proofs suggest improved utilization rates that reduce stranded capacity, a compelling benefit as carbon-based cost pressures intensify across the Singapore data center storage market.
Traditional HDD arrays still hold 39.55% share in 2025, yet all-flash arrays rise the fastest at 6.54% CAGR. The switch is driven by tangible performance gains-sub-millisecond latency and higher IOPS-that directly improve AI and analytics workloads. The Singapore data center storage market size, reflecting both falling media costs and rising energy prices that favor flash's lower watt-per-IO profile.
Public-sector projects illustrate flash economics vividly: a ministerial deployment reduced rack space by 94% and cut energy bills in half. Flash density roadmaps that promise 150 TB and 300 TB drives by 2026 will only hasten HDD retirement, though hybrid systems remain in play for tier-2 workloads through the mid-term horizon of the Singapore data center storage market.
Complete Report Scope:
- By Storage Technology
- Network Attached Storage (NAS)
- Storage Area Network (SAN)
- Direct Attached Storage (DAS)
- Object and Tape Storage
- By Storage Type
- Traditional HDD Arrays
- All-Flash Arrays (AFA)
- Hybrid Storage
- By Data Center Type
- Hyperscalers/Cloud Service Provider
- Colocation Facilities
- Enterprise and Edge
- By End User
- IT and Telecommunication
- BFSI
- Government and Public Sector
- Media and Entertainment
- Healthcare and Life Sciences
- Manufacturing
- By Form Factor
- Rack-mounted
- Blade and Modular
- Disaggregated / Composable
- By Interface
- SAS / SATA
- NVMe
- Fibre Channel and iSCSI
List of Companies Covered in this Report:
- Dell Technologies
- Hewlett Packard Enterprise
- NetApp
- Huawei Technologies
- Pure Storage
- Lenovo
- Fujitsu
- Oracle
- Seagate Technology
- Kingston Technology
- IBM
- Hitachi Vantara
- Western Digital
- Micron Technology
- Kioxia Singapore
- Amazon Web Services
- Microsoft Azure
- Inspur
- Supermicro
- Synology
- QNAP Systems
Additional Benefits:
- The market estimate (ME) sheet in Excel format
- 3 months of analyst support
TABLE OF CONTENTS
1 Introduction
- 1.1 Study Assumptions and Market Definition
- 1.2 Scope of the Study
2 Research Methodology
3 Executive Summary
4 Market Landscape
- 4.1 Market Overview
- 4.2 Market Drivers
- 4.2.1 Government Green DC power-allocation (300 MW) unlocks flash-storage capex
- 4.2.2 AI build-outs demand ultra-low-latency NVMe arrays
- 4.2.3 Surge in data-sovereignty rules (PDPA amendments)
- 4.2.4 Expansion of IT infrastructure and cloud on-ramps
- 4.2.5 Hyperscale investment pipeline (Equinix, Digital Realty)
- 4.2.6 Johor-Singapore SEZ enabling modular cross-border storage pods
- 4.3 Market Restraints
- 4.3.1 High upfront capex of enterprise-grade storage
- 4.3.2 Land-and-power scarcity despite moratorium lift
- 4.3.3 SSD controller supply-chain volatility (geo-political)
- 4.3.4 Rising carbon-tax / ESG compliance costs
- 4.4 Value / Supply-Chain Analysis
- 4.5 Regulatory Landscape
- 4.6 Technological Outlook
- 4.7 Porters Five Forces
- 4.7.1 Threat of New Entrants
- 4.7.2 Bargaining Power of Buyers
- 4.7.3 Bargaining Power of Suppliers
- 4.7.4 Threat of Substitutes
- 4.7.5 Intensity of Competitive Rivalry
- 4.8 Assessment of Macro Economic Trends on the Market
5 Market Size and Growth Forecasts (Value)
- 5.1 By Storage Technology
- 5.1.1 Network Attached Storage (NAS)
- 5.1.2 Storage Area Network (SAN)
- 5.1.3 Direct Attached Storage (DAS)
- 5.1.4 Object and Tape Storage
- 5.2 By Storage Type
- 5.2.1 Traditional HDD Arrays
- 5.2.2 All-Flash Arrays (AFA)
- 5.2.3 Hybrid Storage
- 5.3 By Data Center Type
- 5.3.1 Hyperscalers/Cloud Service Provider
- 5.3.2 Colocation Facilities
- 5.3.3 Enterprise and Edge
- 5.4 By End User
- 5.4.1 IT and Telecommunication
- 5.4.2 BFSI
- 5.4.3 Government and Public Sector
- 5.4.4 Media and Entertainment
- 5.4.5 Healthcare and Life Sciences
- 5.4.6 Manufacturing
- 5.5 By Form Factor
- 5.5.1 Rack-mounted
- 5.5.2 Blade and Modular
- 5.5.3 Disaggregated / Composable
- 5.6 By Interface
- 5.6.1 SAS / SATA
- 5.6.2 NVMe
- 5.6.3 Fibre Channel and iSCSI
6 Competitive Landscape
- 6.1 Market Concentration
- 6.2 Strategic Moves
- 6.3 Market Share Analysis
- 6.4 Company Profiles (includes Global-level Overview, Market-level Overview, Core Segments, Financials as available, Strategic Information, Market Rank/Share, Products and Services, Recent Developments)
- 6.4.1 Dell Technologies
- 6.4.2 Hewlett Packard Enterprise
- 6.4.3 NetApp
- 6.4.4 Huawei Technologies
- 6.4.5 Pure Storage
- 6.4.6 Lenovo
- 6.4.7 Fujitsu
- 6.4.8 Oracle
- 6.4.9 Seagate Technology
- 6.4.10 Kingston Technology
- 6.4.11 IBM
- 6.4.12 Hitachi Vantara
- 6.4.13 Western Digital
- 6.4.14 Micron Technology
- 6.4.15 Kioxia Singapore
- 6.4.16 Amazon Web Services
- 6.4.17 Microsoft Azure
- 6.4.18 Inspur
- 6.4.19 Supermicro
- 6.4.20 Synology
- 6.4.21 QNAP Systems
7 Investment Analysis
8 Market Opportunities and Future Outlook
- 8.1 White-space and Unmet-need Assessment